
|
|||||
|
 | |
| |
| |
| |
| |
| |
|
Gene: SCAP |
Gene summary for SCAP |
| Gene information | Species | Human | Gene symbol | SCAP | Gene ID | 22937 |
| Gene name | SREBF chaperone | |
| Gene Alias | SCAP | |
| Cytomap | 3p21.31 | |
| Gene Type | protein-coding | GO ID | GO:0001666 | UniProtAcc | B7Z6H0 |
Top |
Malignant transformation analysis |
| Identification of the aberrant gene expression in precancerous and cancerous lesions by comparing the gene expression of stem-like cells in diseased tissues with normal stem cells |
| Entrez ID | Symbol | Replicates | Species | Organ | Tissue | Adj P-value | Log2FC | Malignancy |
| 22937 | SCAP | HTA11_1938_2000001011 | Human | Colorectum | AD | 4.87e-04 | 3.09e-01 | -0.0811 |
| 22937 | SCAP | HTA11_347_2000001011 | Human | Colorectum | AD | 2.32e-11 | 4.66e-01 | -0.1954 |
| 22937 | SCAP | HTA11_1391_2000001011 | Human | Colorectum | AD | 1.01e-04 | 3.91e-01 | -0.059 |
| 22937 | SCAP | HTA11_99999971662_82457 | Human | Colorectum | MSS | 4.85e-05 | 5.47e-01 | 0.3859 |
| 22937 | SCAP | A002-C-010 | Human | Colorectum | FAP | 9.64e-03 | -2.57e-01 | 0.242 |
| 22937 | SCAP | A015-C-203 | Human | Colorectum | FAP | 3.73e-13 | -2.83e-01 | -0.1294 |
| 22937 | SCAP | A002-C-201 | Human | Colorectum | FAP | 2.01e-04 | -3.28e-01 | 0.0324 |
| 22937 | SCAP | A002-C-203 | Human | Colorectum | FAP | 3.41e-03 | -1.68e-01 | 0.2786 |
| 22937 | SCAP | A001-C-108 | Human | Colorectum | FAP | 3.65e-10 | -3.14e-01 | -0.0272 |
| 22937 | SCAP | A002-C-205 | Human | Colorectum | FAP | 1.95e-11 | -4.34e-01 | -0.1236 |
| 22937 | SCAP | A001-C-104 | Human | Colorectum | FAP | 2.27e-03 | -2.71e-01 | 0.0184 |
| 22937 | SCAP | A015-C-006 | Human | Colorectum | FAP | 6.63e-05 | -3.43e-01 | -0.0994 |
| 22937 | SCAP | A015-C-106 | Human | Colorectum | FAP | 3.40e-08 | -2.38e-01 | -0.0511 |
| 22937 | SCAP | A002-C-114 | Human | Colorectum | FAP | 1.64e-05 | -2.99e-01 | -0.1561 |
| 22937 | SCAP | A015-C-104 | Human | Colorectum | FAP | 1.58e-14 | -3.25e-01 | -0.1899 |
| 22937 | SCAP | A001-C-014 | Human | Colorectum | FAP | 2.84e-11 | -3.44e-01 | 0.0135 |
| 22937 | SCAP | A002-C-016 | Human | Colorectum | FAP | 1.41e-12 | -3.21e-01 | 0.0521 |
| 22937 | SCAP | A015-C-002 | Human | Colorectum | FAP | 3.75e-04 | -3.47e-01 | -0.0763 |
| 22937 | SCAP | A001-C-203 | Human | Colorectum | FAP | 9.99e-09 | -3.06e-01 | -0.0481 |
| 22937 | SCAP | A002-C-116 | Human | Colorectum | FAP | 2.54e-19 | -3.78e-01 | -0.0452 |
| Page: 1 2 3 4 5 6 |
| Tissue | Expression Dynamics | Abbreviation |
| Colorectum (GSE201348) |  | FAP: Familial adenomatous polyposis |
| CRC: Colorectal cancer | ||
| Colorectum (HTA11) |  | AD: Adenomas |
| SER: Sessile serrated lesions | ||
| MSI-H: Microsatellite-high colorectal cancer | ||
| MSS: Microsatellite stable colorectal cancer | ||
| Esophagus | 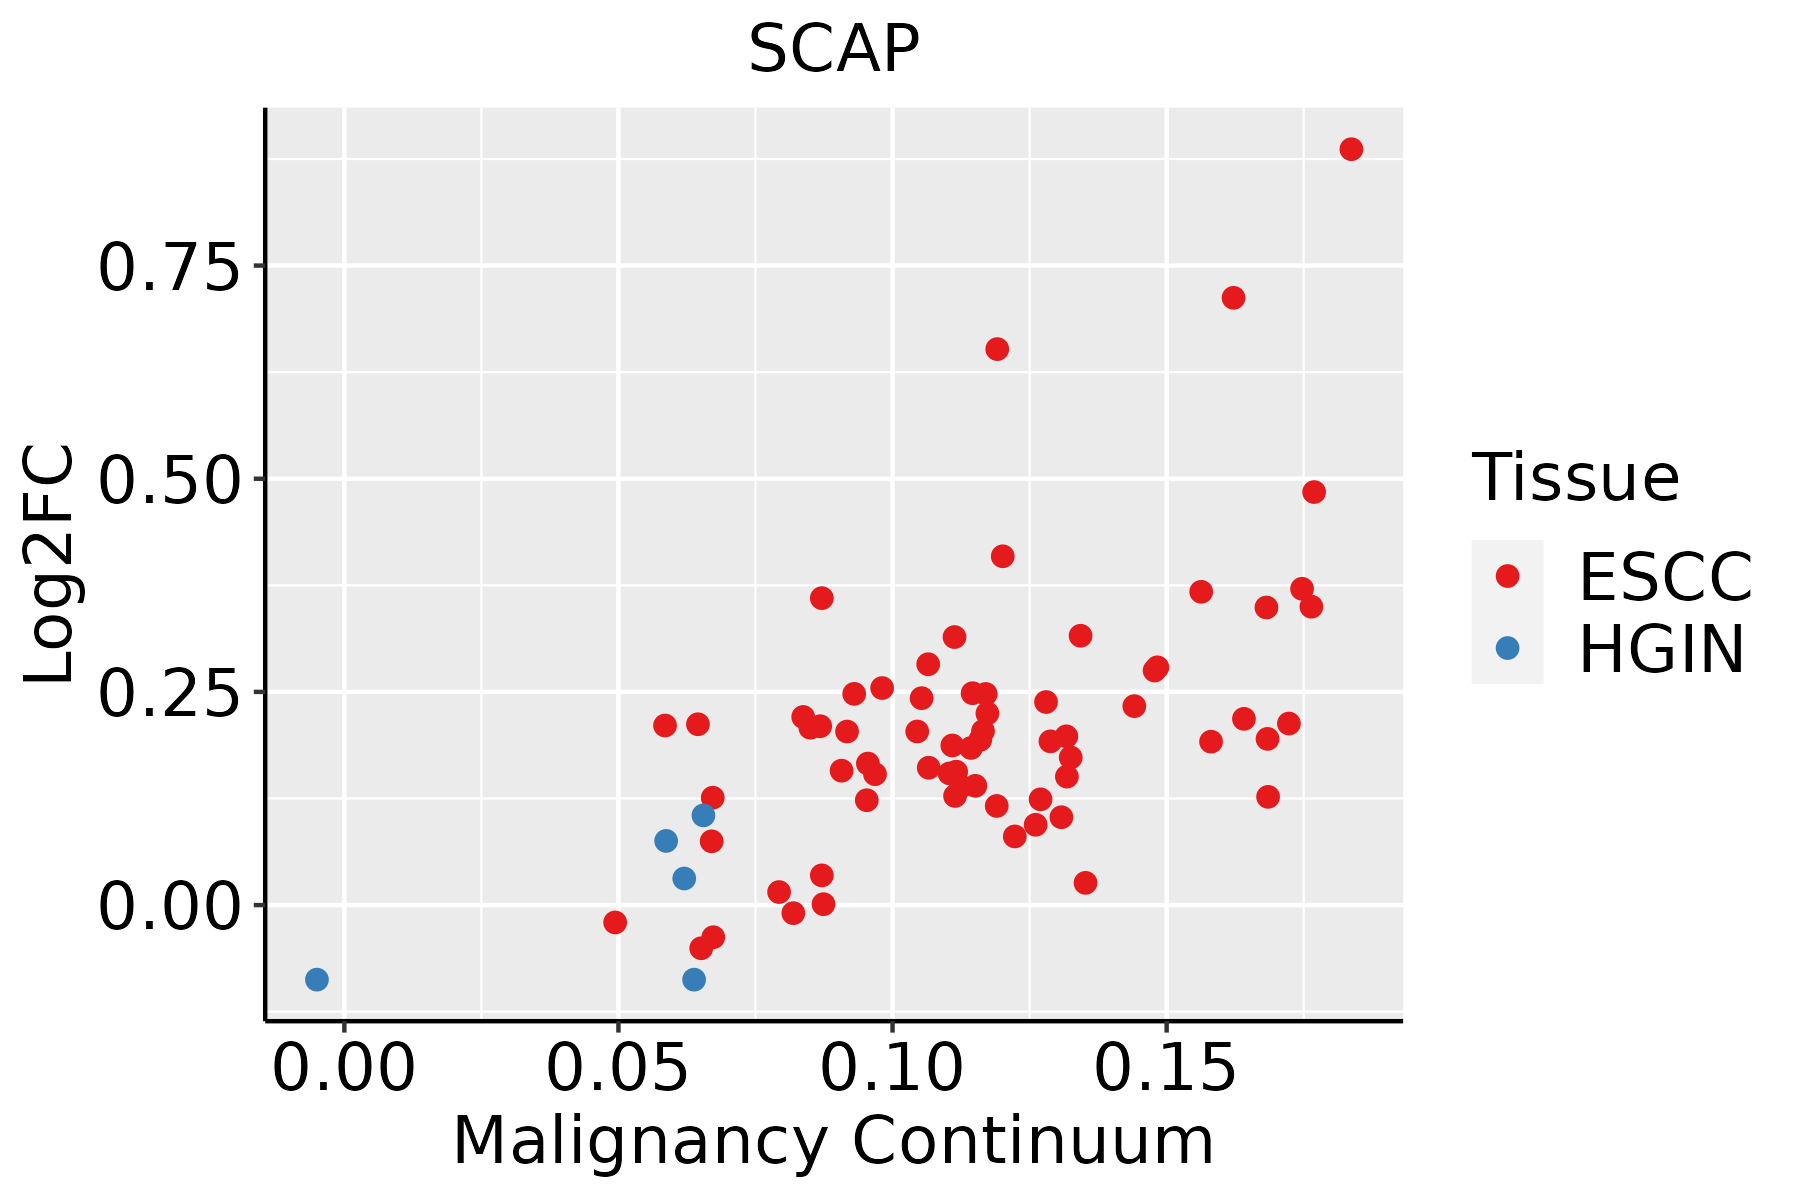 | ESCC: Esophageal squamous cell carcinoma |
| HGIN: High-grade intraepithelial neoplasias | ||
| LGIN: Low-grade intraepithelial neoplasias | ||
| Liver | 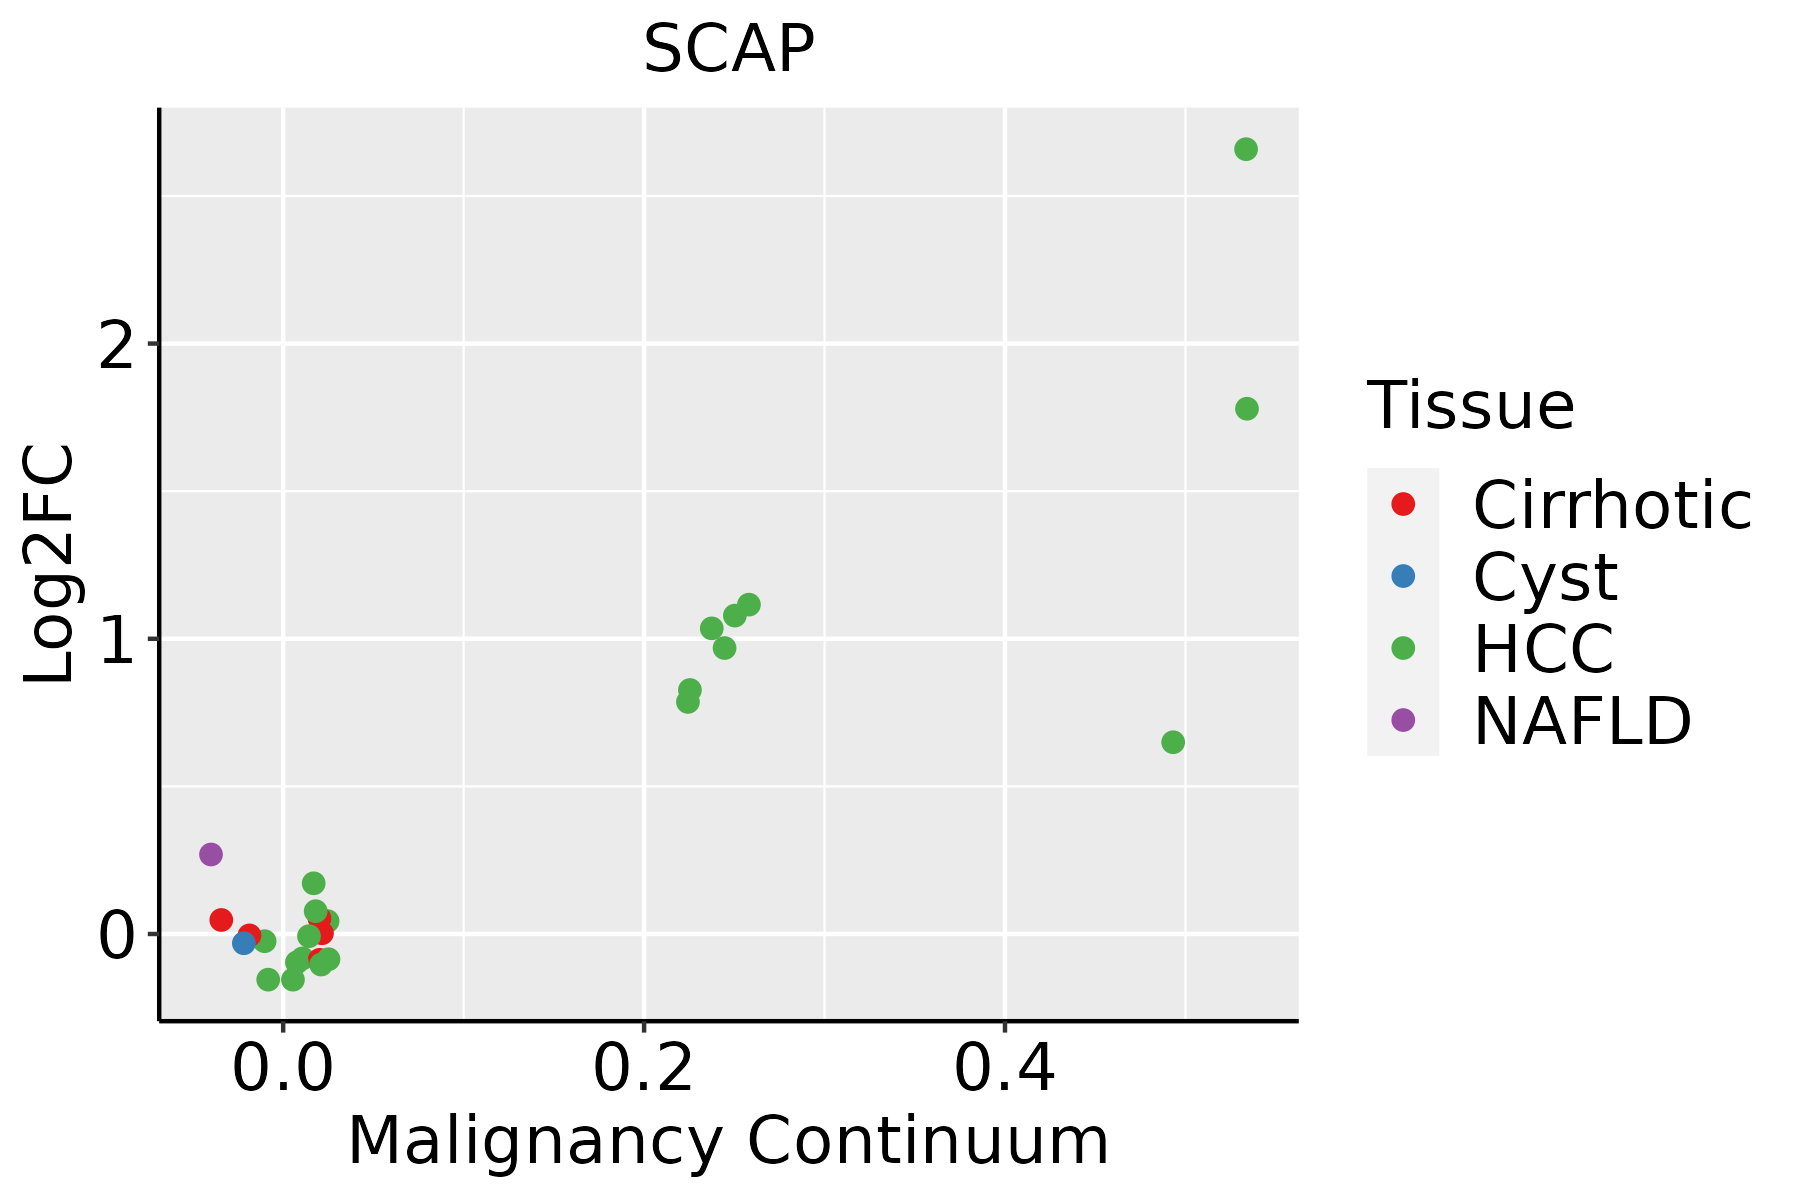 | HCC: Hepatocellular carcinoma |
| NAFLD: Non-alcoholic fatty liver disease | ||
| Skin | 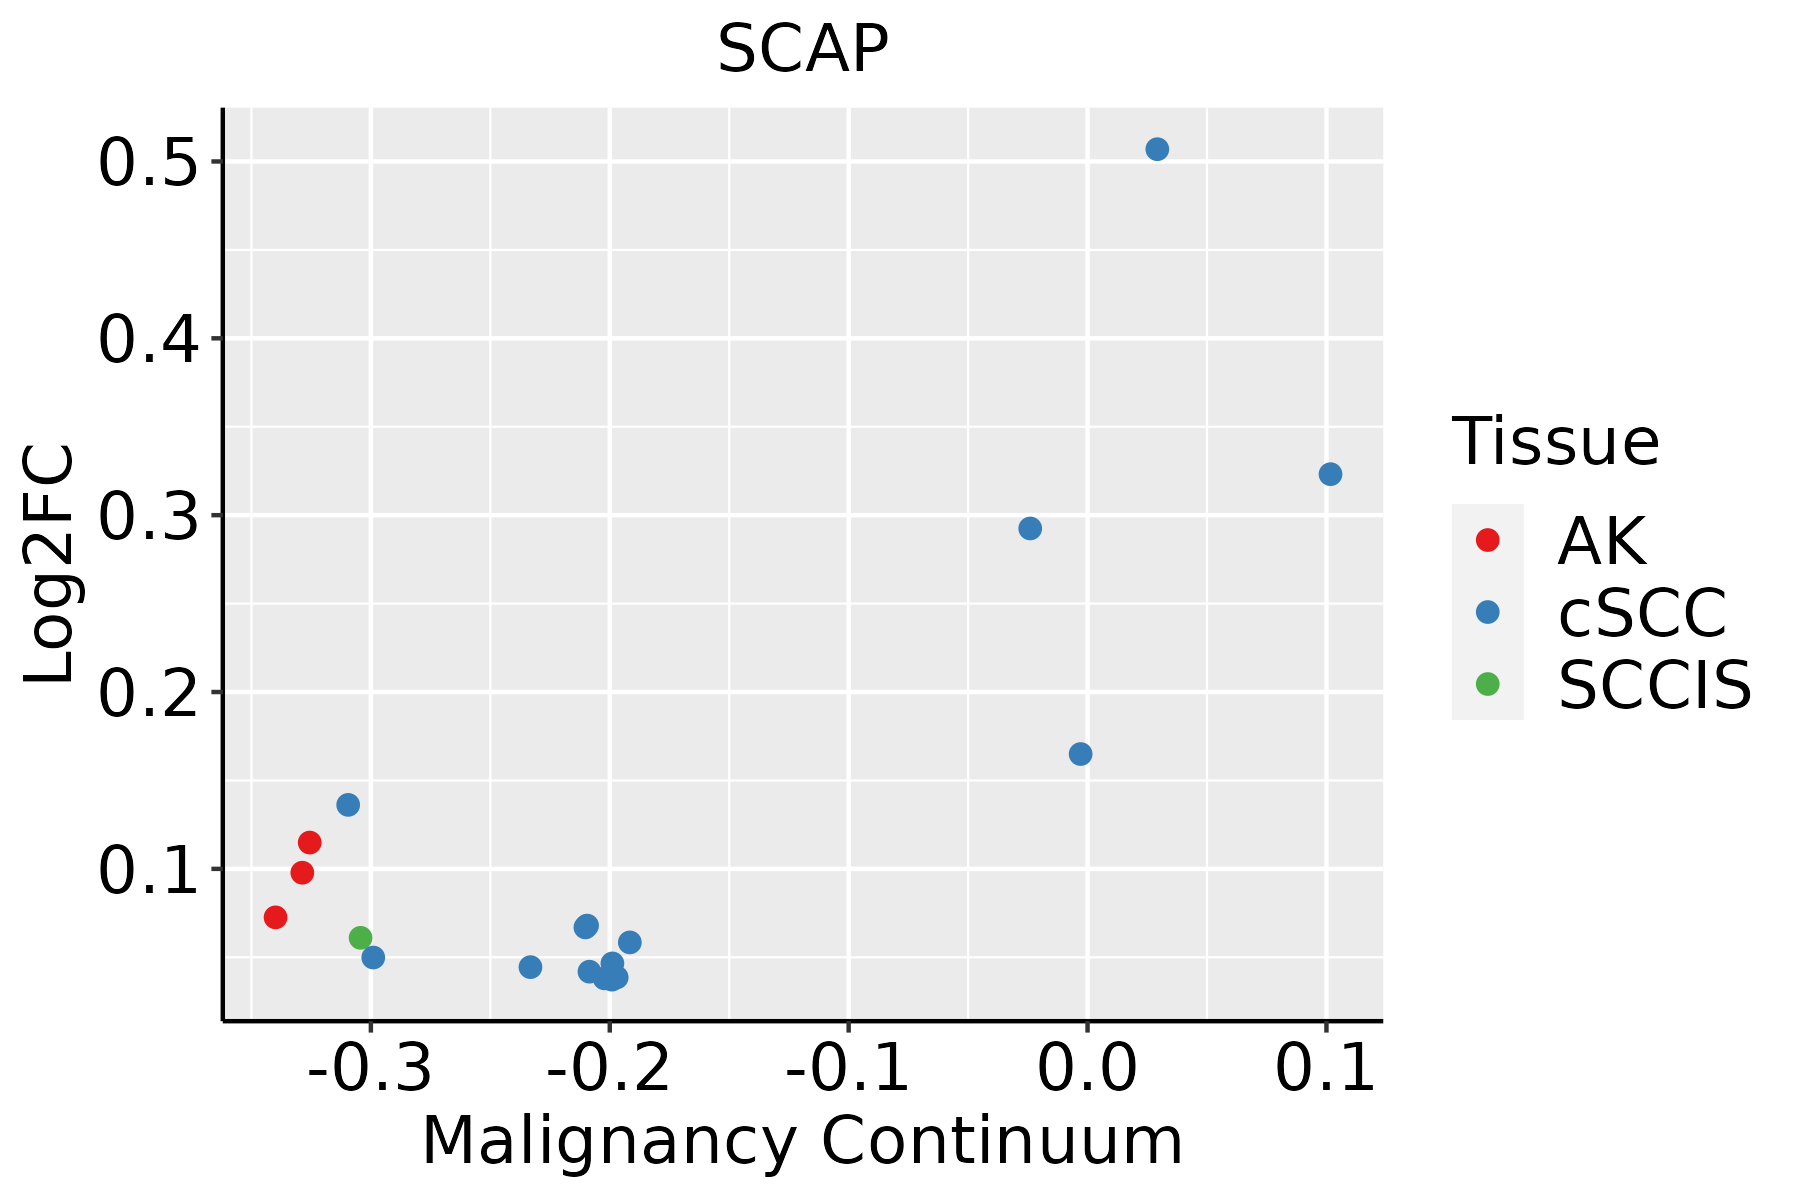 | AK: Actinic keratosis |
| cSCC: Cutaneous squamous cell carcinoma | ||
| SCCIS:squamous cell carcinoma in situ | ||
| Thyroid | 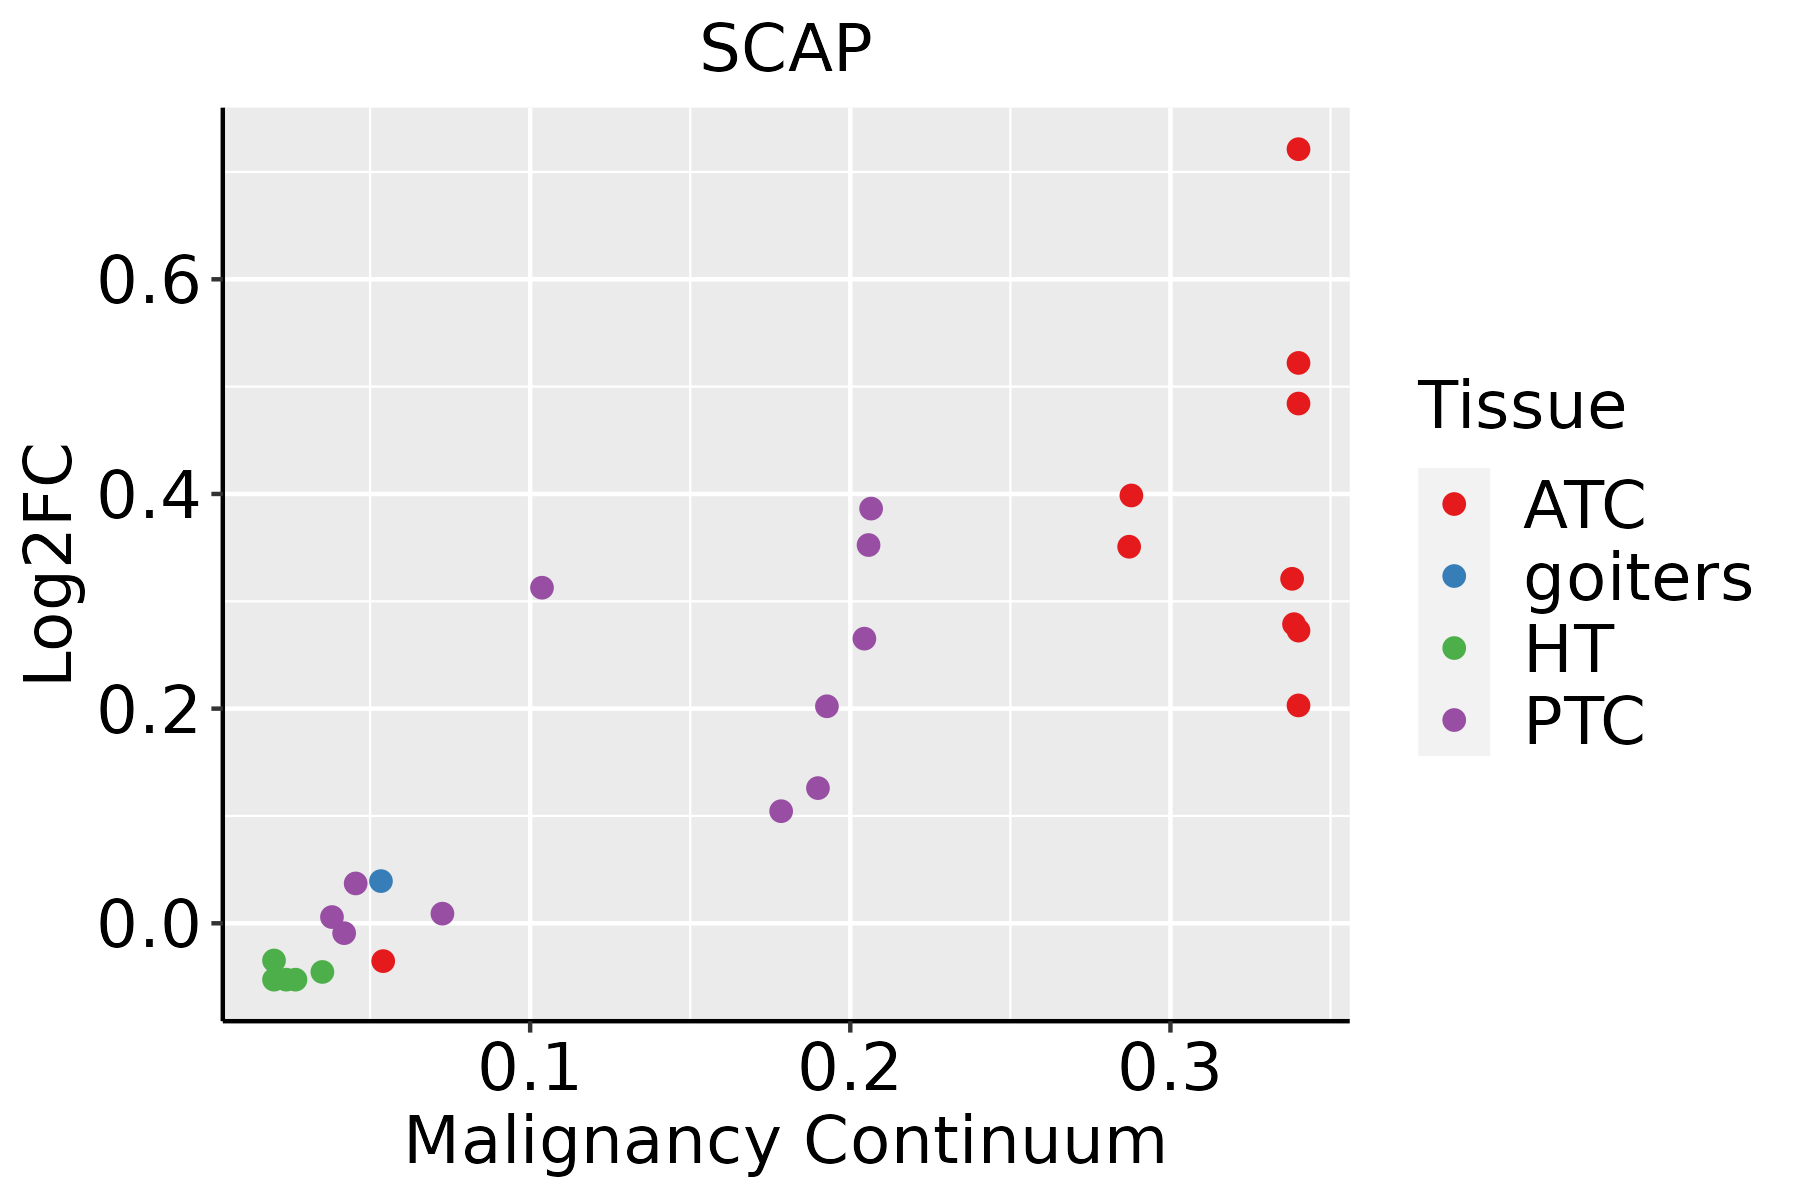 | ATC: Anaplastic thyroid cancer |
| HT: Hashimoto's thyroiditis | ||
| PTC: Papillary thyroid cancer |
| ∗log2FC in expression of this searched gene in stem-like cells from each diseased tissue sample relative to stem-like cells in normal samples in each tissue plotted against the malignancy continuum. Samples are colored based on if they are from different disease stage. |
Top |
Malignant transformation related pathway analysis |
| Find out the enriched GO biological processes and KEGG pathways involved in transition from healthy to precancer to cancer |
| Tissue | Disease Stage | Enriched GO biological Processes |
| Colorectum | AD |  |
| Colorectum | SER |  |
| Colorectum | MSS |  |
| Colorectum | MSI-H |  |
| Colorectum | FAP |  |
| ∗Top 15 enriched GO BP terms are showed in the bar plot of each disease state in each tissue. Each row represents a significant GO biological process which is colored according to the -log10(p.adjust). |
| Page: 1 2 3 4 5 6 7 8 9 |
| GO ID | Tissue | Disease Stage | Description | Gene Ratio | Bg Ratio | pvalue | p.adjust | Count |
| GO:00069004 | Colorectum | FAP | vesicle budding from membrane | 26/2622 | 61/18723 | 4.65e-08 | 3.86e-06 | 26 |
| GO:00328683 | Colorectum | FAP | response to insulin | 68/2622 | 264/18723 | 2.71e-07 | 1.55e-05 | 68 |
| GO:00160503 | Colorectum | FAP | vesicle organization | 74/2622 | 300/18723 | 5.16e-07 | 2.66e-05 | 74 |
| GO:00704823 | Colorectum | FAP | response to oxygen levels | 77/2622 | 347/18723 | 2.08e-05 | 5.05e-04 | 77 |
| GO:00620122 | Colorectum | FAP | regulation of small molecule metabolic process | 74/2622 | 334/18723 | 3.15e-05 | 7.13e-04 | 74 |
| GO:00016663 | Colorectum | FAP | response to hypoxia | 68/2622 | 307/18723 | 6.53e-05 | 1.25e-03 | 68 |
| GO:00069843 | Colorectum | FAP | ER-nucleus signaling pathway | 17/2622 | 46/18723 | 8.85e-05 | 1.57e-03 | 17 |
| GO:00362932 | Colorectum | FAP | response to decreased oxygen levels | 70/2622 | 322/18723 | 9.49e-05 | 1.61e-03 | 70 |
| GO:00066313 | Colorectum | FAP | fatty acid metabolic process | 81/2622 | 390/18723 | 1.43e-04 | 2.24e-03 | 81 |
| GO:00075682 | Colorectum | FAP | aging | 69/2622 | 339/18723 | 7.66e-04 | 8.12e-03 | 69 |
| GO:00620131 | Colorectum | FAP | positive regulation of small molecule metabolic process | 34/2622 | 143/18723 | 1.15e-03 | 1.10e-02 | 34 |
| GO:00901141 | Colorectum | FAP | COPII-coated vesicle budding | 11/2622 | 29/18723 | 1.20e-03 | 1.14e-02 | 11 |
| GO:00060663 | Colorectum | FAP | alcohol metabolic process | 69/2622 | 353/18723 | 2.29e-03 | 1.85e-02 | 69 |
| GO:00354591 | Colorectum | FAP | vesicle cargo loading | 10/2622 | 27/18723 | 2.46e-03 | 1.95e-02 | 10 |
| GO:00068884 | Colorectum | FAP | endoplasmic reticulum to Golgi vesicle-mediated transport | 30/2622 | 130/18723 | 3.51e-03 | 2.53e-02 | 30 |
| GO:00481935 | Colorectum | CRC | Golgi vesicle transport | 59/2078 | 296/18723 | 5.47e-06 | 2.17e-04 | 59 |
| GO:00434344 | Colorectum | CRC | response to peptide hormone | 76/2078 | 414/18723 | 6.67e-06 | 2.56e-04 | 76 |
| GO:00328684 | Colorectum | CRC | response to insulin | 53/2078 | 264/18723 | 1.30e-05 | 4.17e-04 | 53 |
| GO:00069005 | Colorectum | CRC | vesicle budding from membrane | 19/2078 | 61/18723 | 1.99e-05 | 5.90e-04 | 19 |
| GO:00160504 | Colorectum | CRC | vesicle organization | 57/2078 | 300/18723 | 3.36e-05 | 8.57e-04 | 57 |
| Page: 1 2 3 4 5 6 7 8 9 10 11 12 |
| Pathway ID | Tissue | Disease Stage | Description | Gene Ratio | Bg Ratio | pvalue | p.adjust | qvalue | Count |
| Page: 1 |
Top |
Cell-cell communication analysis |
| Identification of potential cell-cell interactions between two cell types and their ligand-receptor pairs for different disease states |
| Ligand | Receptor | LRpair | Pathway | Tissue | Disease Stage |
| Page: 1 |
Top |
Single-cell gene regulatory network inference analysis |
| Find out the significant the regulons (TFs) and the target genes of each regulon across cell types for different disease states |
| TF | Cell Type | Tissue | Disease Stage | Target Gene | RSS | Regulon Activity |
| ∗The dot plots of a searched regulon are shown for all cell subpopulations in each disease state of each tissue based on the regulon specific score inferred using pySCENIC and by calculating the average expression. |
| Page: 1 |
Top |
Somatic mutation of malignant transformation related genes |
| Annotation of somatic variants for genes involved in malignant transformation |
| Hugo Symbol | Variant Class | Variant Classification | dbSNP RS | HGVSc | HGVSp | HGVSp Short | SWISSPROT | BIOTYPE | SIFT | PolyPhen | Tumor Sample Barcode | Tissue | Histology | Sex | Age | Stage | Therapy Types | Drugs | Outcome |
| SCAP | SNV | Missense_Mutation | novel | c.3458T>G | p.Val1153Gly | p.V1153G | Q12770 | protein_coding | deleterious(0) | probably_damaging(0.972) | TCGA-AR-A1AP-01 | Breast | breast invasive carcinoma | Female | >=65 | I/II | Hormone Therapy | anastrozole | SD |
| SCAP | SNV | Missense_Mutation | c.3496N>T | p.Leu1166Phe | p.L1166F | Q12770 | protein_coding | deleterious(0.01) | probably_damaging(0.988) | TCGA-BH-A0BS-01 | Breast | breast invasive carcinoma | Female | <65 | III/IV | Chemotherapy | adriamycin | CR | |
| SCAP | SNV | Missense_Mutation | c.947C>T | p.Ala316Val | p.A316V | Q12770 | protein_coding | deleterious(0) | probably_damaging(0.999) | TCGA-BH-A0C1-01 | Breast | breast invasive carcinoma | Female | <65 | III/IV | Chemotherapy | adriamycin | PD | |
| SCAP | SNV | Missense_Mutation | novel | c.3560N>A | p.Arg1187His | p.R1187H | Q12770 | protein_coding | deleterious(0) | probably_damaging(0.999) | TCGA-BH-A0HA-01 | Breast | breast invasive carcinoma | Female | <65 | I/II | Unknown | Unknown | SD |
| SCAP | insertion | Nonsense_Mutation | novel | c.2990_2991insAGATCGAGACCATCCCGGCTAAAAC | p.Val998AspfsTer7 | p.V998Dfs*7 | Q12770 | protein_coding | TCGA-A8-A07R-01 | Breast | breast invasive carcinoma | Female | >=65 | III/IV | Ancillary | zoledronic | SD | ||
| SCAP | insertion | In_Frame_Ins | novel | c.3538_3539insTGTCTCTTGGAATTGTTTGTGCAC | p.Asp1180delinsValSerLeuGlyIleValCysAlaHis | p.D1180delinsVSLGIVCAH | Q12770 | protein_coding | TCGA-AO-A0J9-01 | Breast | breast invasive carcinoma | Female | <65 | III/IV | Chemotherapy | cyclophosphamide | PD | ||
| SCAP | SNV | Missense_Mutation | rs748447667 | c.1979G>A | p.Arg660His | p.R660H | Q12770 | protein_coding | tolerated(0.54) | benign(0) | TCGA-2W-A8YY-01 | Cervix | cervical & endocervical cancer | Female | <65 | I/II | Chemotherapy | cisplatin | CR |
| SCAP | SNV | Missense_Mutation | c.728A>G | p.Tyr243Cys | p.Y243C | Q12770 | protein_coding | deleterious(0) | probably_damaging(0.987) | TCGA-A6-5661-01 | Colorectum | colon adenocarcinoma | Female | >=65 | I/II | Unknown | Unknown | SD | |
| SCAP | SNV | Missense_Mutation | rs760342147 | c.3379N>G | p.Ile1127Val | p.I1127V | Q12770 | protein_coding | tolerated(0.17) | benign(0.059) | TCGA-A6-6780-01 | Colorectum | colon adenocarcinoma | Male | >=65 | I/II | Unknown | Unknown | SD |
| SCAP | SNV | Missense_Mutation | c.1388N>T | p.Pro463Leu | p.P463L | Q12770 | protein_coding | tolerated(0.09) | benign(0.003) | TCGA-AA-3492-01 | Colorectum | colon adenocarcinoma | Female | >=65 | I/II | Unknown | Unknown | SD |
| Page: 1 2 3 4 5 6 7 8 9 10 |
Top |
Related drugs of malignant transformation related genes |
| Identification of chemicals and drugs interact with genes involved in malignant transfromation |
| (DGIdb 4.0) |
| Entrez ID | Symbol | Category | Interaction Types | Drug Claim Name | Drug Name | PMIDs |
| 22937 | SCAP | TRANSCRIPTION FACTOR | simvastatin | SIMVASTATIN | 16158080 | |
| 22937 | SCAP | TRANSCRIPTION FACTOR | atorvastatin | ATORVASTATIN | 18435918 |
| Page: 1 |

Copyright 2023-Present -The University of Texas Health Science Center at Houston |