Schematic overview of the cellular and molecular mechanisms involved in the cancer progression, including the proposed cellular and molecular mechanisms in cancer cells trajectory. AT1: alveolar type 1 cells; AT2: alveolar type 2 cells; AAH: atypical adenomatous hyperplasia; AIS: adenocarcinoma in situ; MIA: minimally invasive adenocarcinoma; IA: invasive adenocarcinoma; EMT: epithelial-mesenchymal transition

Home

Download

Statistics

Help

Contact

Center for Computational Systems Medicine
leaf

Gene summary

leaf

Malignant transformation analysis

leaf

Malignant transformation related pathway analysis

leaf

Cell-cell communication analysis

leaf

Single-cell gene regulatory network inference analysis

leaf

Somatic mutation of malignant transformation related genes

leaf

Related drugs of malignant transformation related genes

Gene: SBNO2

Gene summary for SBNO2

check button Gene summary.

Gene informationSpeciesHuman
Gene symbol

SBNO2

Gene ID

22904

Gene namestrawberry notch homolog 2
Gene AliasKIAA0963
Cytomap19p13.3
Gene Typeprotein-coding
GO ID

GO:0000768

UniProtAcc

Q9Y2G9


Top

Malignant transformation analysis

check button Identification of the aberrant gene expression in precancerous and cancerous lesions by comparing the gene expression of stem-like cells in diseased tissues with normal stem cells
check button Malignant transformation involving gene list.
Entrez IDSymbolReplicatesSpeciesOrganTissueAdj P-valueLog2FCMalignancy
22904SBNO2LZE5THumanEsophagusESCC1.06e-031.55e-010.0514
22904SBNO2LZE8THumanEsophagusESCC1.82e-041.72e-010.067
22904SBNO2LZE24THumanEsophagusESCC1.53e-042.48e-020.0596
22904SBNO2LZE21THumanEsophagusESCC5.08e-041.75e-010.0655
22904SBNO2P2T-EHumanEsophagusESCC1.45e-102.33e-020.1177
22904SBNO2P4T-EHumanEsophagusESCC4.95e-083.84e-020.1323
22904SBNO2P5T-EHumanEsophagusESCC4.99e-044.39e-020.1327
22904SBNO2P8T-EHumanEsophagusESCC4.37e-092.31e-010.0889
22904SBNO2P9T-EHumanEsophagusESCC5.57e-051.09e-010.1131
22904SBNO2P10T-EHumanEsophagusESCC5.24e-099.91e-020.116
22904SBNO2P11T-EHumanEsophagusESCC1.93e-042.64e-010.1426
22904SBNO2P15T-EHumanEsophagusESCC2.13e-035.01e-020.1149
22904SBNO2P16T-EHumanEsophagusESCC5.78e-054.03e-020.1153
22904SBNO2P17T-EHumanEsophagusESCC1.25e-032.05e-010.1278
22904SBNO2P20T-EHumanEsophagusESCC3.24e-096.52e-020.1124
22904SBNO2P21T-EHumanEsophagusESCC1.63e-151.77e-010.1617
22904SBNO2P22T-EHumanEsophagusESCC2.71e-09-2.68e-020.1236
22904SBNO2P23T-EHumanEsophagusESCC2.15e-063.13e-010.108
22904SBNO2P24T-EHumanEsophagusESCC5.75e-081.66e-010.1287
22904SBNO2P26T-EHumanEsophagusESCC1.80e-05-1.49e-020.1276
Page: 1 2 3 4 5 

check button Transcriptomic changes along malignancy continuum.
TissueExpression DynamicsAbbreviation
EsophagusThe image shows the transcriptomic changes along malignancy continuum.log2FC in expression of this searched gene in stem-like cells from each diseased tissue sample relative to stem-like cells in normal samples in each tissue plotted against the malignancy continuum. Samples are colored based on if they are from different disease stage.ESCC: Esophageal squamous cell carcinoma
HGIN: High-grade intraepithelial neoplasias
LGIN: Low-grade intraepithelial neoplasias
LiverThe image shows the transcriptomic changes along malignancy continuum.log2FC in expression of this searched gene in stem-like cells from each diseased tissue sample relative to stem-like cells in normal samples in each tissue plotted against the malignancy continuum. Samples are colored based on if they are from different disease stage.HCC: Hepatocellular carcinoma
NAFLD: Non-alcoholic fatty liver disease
Oral CavityThe image shows the transcriptomic changes along malignancy continuum.log2FC in expression of this searched gene in stem-like cells from each diseased tissue sample relative to stem-like cells in normal samples in each tissue plotted against the malignancy continuum. Samples are colored based on if they are from different disease stage.EOLP: Erosive Oral lichen planus
LP: leukoplakia
NEOLP: Non-erosive oral lichen planus
OSCC: Oral squamous cell carcinoma
SkinThe image shows the transcriptomic changes along malignancy continuum.log2FC in expression of this searched gene in stem-like cells from each diseased tissue sample relative to stem-like cells in normal samples in each tissue plotted against the malignancy continuum. Samples are colored based on if they are from different disease stage.
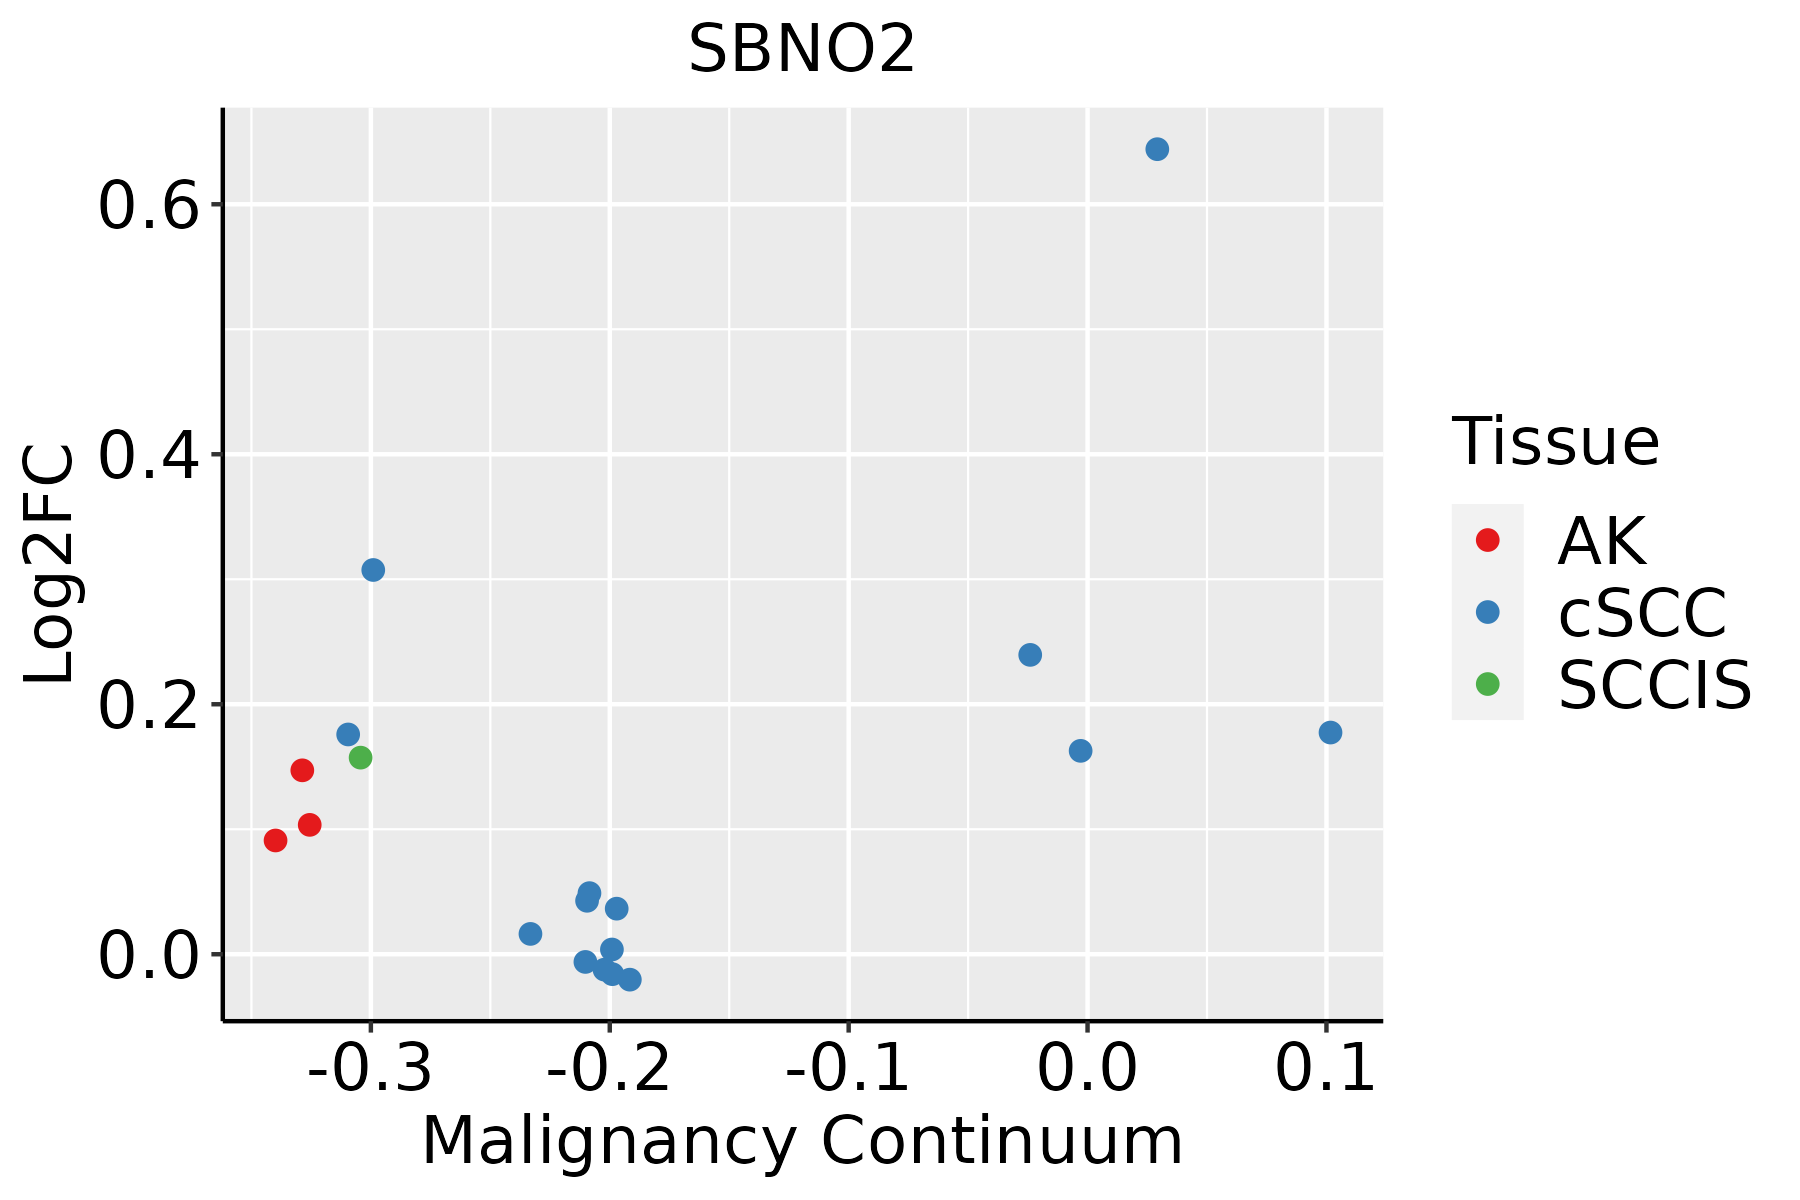
AK: Actinic keratosis
cSCC: Cutaneous squamous cell carcinoma
SCCIS:squamous cell carcinoma in situ
ThyroidThe image shows the transcriptomic changes along malignancy continuum.log2FC in expression of this searched gene in stem-like cells from each diseased tissue sample relative to stem-like cells in normal samples in each tissue plotted against the malignancy continuum. Samples are colored based on if they are from different disease stage.ATC: Anaplastic thyroid cancer
HT: Hashimoto's thyroiditis
PTC: Papillary thyroid cancer
∗log2FC in expression of this searched gene in stem-like cells from each diseased tissue sample relative to stem-like cells in normal samples in each tissue plotted against the malignancy continuum. Samples are colored based on if they are from different disease stage.

Top

Malignant transformation related pathway analysis

check buttonFind out the enriched GO biological processes and KEGG pathways involved in transition from healthy to precancer to cancer
check button Figure of enriched GO biological processes.
TissueDisease StageEnriched GO biological Processes
ColorectumADGO analysis - Figure of enriched GO biological processes: Top 15 enriched GO BP terms are showed in the bar plot of each disease state in each tissue. Each row represents a significant GO biological process which is colored according to the -log10(p.adjust).
ColorectumSERGO analysis - Figure of enriched GO biological processes: Top 15 enriched GO BP terms are showed in the bar plot of each disease state in each tissue. Each row represents a significant GO biological process which is colored according to the -log10(p.adjust).
ColorectumMSSGO analysis - Figure of enriched GO biological processes: Top 15 enriched GO BP terms are showed in the bar plot of each disease state in each tissue. Each row represents a significant GO biological process which is colored according to the -log10(p.adjust).
ColorectumMSI-HGO analysis - Figure of enriched GO biological processes: Top 15 enriched GO BP terms are showed in the bar plot of each disease state in each tissue. Each row represents a significant GO biological process which is colored according to the -log10(p.adjust).
ColorectumFAPGO analysis - Figure of enriched GO biological processes: Top 15 enriched GO BP terms are showed in the bar plot of each disease state in each tissue. Each row represents a significant GO biological process which is colored according to the -log10(p.adjust).
∗Top 15 enriched GO BP terms are showed in the bar plot of each disease state in each tissue. Each row represents a significant GO biological process which is colored according to the -log10(p.adjust).
Page: 1 2 3 4 5 6 7 8 9 

check button Enriched GO biological processes.
GO IDTissueDisease StageDescriptionGene RatioBg Ratiopvaluep.adjustCount
GO:000257331Oral cavityNEOLPmyeloid leukocyte differentiation41/2005208/187238.21e-051.03e-0341
GO:000076811Oral cavityNEOLPsyncytium formation by plasma membrane fusion16/200555/187231.43e-041.64e-0316
GO:014025311Oral cavityNEOLPcell-cell fusion16/200555/187231.43e-041.64e-0316
GO:000694911Oral cavityNEOLPsyncytium formation16/200557/187232.26e-042.37e-0316
GO:007122231Oral cavityNEOLPcellular response to lipopolysaccharide38/2005209/187237.74e-046.23e-0338
GO:0061383Oral cavityNEOLPtrabecula morphogenesis12/200543/187231.42e-031.01e-0212
GO:007121631Oral cavityNEOLPcellular response to biotic stimulus42/2005246/187231.55e-031.09e-0242
GO:005072712Oral cavityNEOLPregulation of inflammatory response60/2005386/187231.99e-031.33e-0260
GO:007121922Oral cavityNEOLPcellular response to molecule of bacterial origin38/2005221/187232.22e-031.44e-0238
GO:003009929SkincSCCmyeloid cell differentiation146/4864381/187236.38e-081.61e-06146
GO:199082317SkincSCCresponse to leukemia inhibitory factor42/486495/187238.79e-058.27e-0442
GO:199083016SkincSCCcellular response to leukemia inhibitory factor41/486494/187231.53e-041.35e-0341
GO:000150323SkincSCCossification137/4864408/187233.39e-042.68e-03137
GO:000257324SkincSCCmyeloid leukocyte differentiation76/4864208/187234.75e-043.60e-0376
GO:0001503110ThyroidPTCossification176/5968408/187239.26e-071.40e-05176
GO:0030099113ThyroidPTCmyeloid cell differentiation160/5968381/187231.75e-051.82e-04160
GO:199082310ThyroidPTCresponse to leukemia inhibitory factor42/596895/187237.69e-033.27e-0242
GO:199083010ThyroidPTCcellular response to leukemia inhibitory factor41/596894/187231.10e-024.38e-0241
GO:000150332ThyroidATCossification206/6293408/187239.23e-133.95e-11206
GO:003009933ThyroidATCmyeloid cell differentiation170/6293381/187234.26e-064.68e-05170
Page: 1 2 3 4 

check button Enriched KEGG pathways.
Pathway IDTissueDisease StageDescriptionGene RatioBg Ratiopvaluep.adjustqvalueCount
Page: 1 

Top

Cell-cell communication analysis

check buttonIdentification of potential cell-cell interactions between two cell types and their ligand-receptor pairs for different disease states
LigandReceptorLRpairPathwayTissueDisease Stage
Page: 1 

Top

Single-cell gene regulatory network inference analysis

check buttonFind out the significant the regulons (TFs) and the target genes of each regulon across cell types for different disease states
TFCell TypeTissueDisease StageTarget GeneRSSRegulon Activity
∗The dot plots of a searched regulon are shown for all cell subpopulations in each disease state of each tissue based on the regulon specific score inferred using pySCENIC and by calculating the average expression.
Page: 1 

Top

Somatic mutation of malignant transformation related genes

check buttonAnnotation of somatic variants for genes involved in malignant transformation
Hugo SymbolVariant ClassVariant ClassificationdbSNP RSHGVScHGVSpHGVSp ShortSWISSPROTBIOTYPESIFTPolyPhenTumor Sample BarcodeTissueHistologySexAgeStageTherapy TypesDrugsOutcome
SBNO2SNVMissense_Mutationnovelc.753G>Tp.Gln251Hisp.Q251HQ9Y2G9protein_codingdeleterious(0)probably_damaging(0.999)TCGA-A7-A3J0-01Breastbreast invasive carcinomaFemale<65I/IIHormone TherapyanastrazoleSD
SBNO2SNVMissense_Mutationnovelc.570N>Tp.Glu190Aspp.E190DQ9Y2G9protein_codingtolerated(0.18)benign(0.006)TCGA-BH-A18G-01Breastbreast invasive carcinomaFemale>=65I/IIUnknownUnknownSD
SBNO2SNVMissense_Mutationc.1345G>Cp.Glu449Glnp.E449QQ9Y2G9protein_codingtolerated(0.3)possibly_damaging(0.816)TCGA-GM-A2D9-01Breastbreast invasive carcinomaFemale>=65I/IIHormone TherapyarimidexSD
SBNO2SNVMissense_Mutationnovelc.2581N>Cp.Gly861Argp.G861RQ9Y2G9protein_codingdeleterious(0)probably_damaging(1)TCGA-OL-A5D7-01Breastbreast invasive carcinomaFemale>=65I/IIChemotherapycytoxanCR
SBNO2SNVMissense_Mutationnovelc.1190N>Gp.Ser397Cysp.S397CQ9Y2G9protein_codingdeleterious(0.01)probably_damaging(0.954)TCGA-PE-A5DE-01Breastbreast invasive carcinomaFemale<65I/IIChemotherapytaxotereCR
SBNO2SNVMissense_Mutationnovelc.2613N>Cp.Lys871Asnp.K871NQ9Y2G9protein_codingdeleterious(0)probably_damaging(0.999)TCGA-UU-A93S-01Breastbreast invasive carcinomaFemale<65III/IVUnknownUnknownPD
SBNO2deletionFrame_Shift_Delnovelc.1320delNp.Glu441ArgfsTer30p.E441Rfs*30Q9Y2G9protein_codingTCGA-EW-A2FV-01Breastbreast invasive carcinomaFemale<65III/IVChemotherapydocetaxelSD
SBNO2SNVMissense_Mutationrs767111147c.2605N>Ap.Val869Metp.V869MQ9Y2G9protein_codingdeleterious(0)probably_damaging(0.995)TCGA-2W-A8YY-01Cervixcervical & endocervical cancerFemale<65I/IIChemotherapycisplatinCR
SBNO2SNVMissense_Mutationrs759888117c.2170N>Tp.Arg724Trpp.R724WQ9Y2G9protein_codingdeleterious(0.01)benign(0.326)TCGA-2W-A8YY-01Cervixcervical & endocervical cancerFemale<65I/IIChemotherapycisplatinCR
SBNO2SNVMissense_Mutationrs200890802c.736N>Ap.Ala246Thrp.A246TQ9Y2G9protein_codingtolerated(0.36)benign(0.015)TCGA-2W-A8YY-01Cervixcervical & endocervical cancerFemale<65I/IIChemotherapycisplatinCR
Page: 1 2 3 4 5 6 7 8 9 10 11 

Top

Related drugs of malignant transformation related genes

check buttonIdentification of chemicals and drugs interact with genes involved in malignant transfromation
(DGIdb 4.0)
Entrez IDSymbolCategoryInteraction TypesDrug Claim NameDrug NamePMIDs
Page: 1