
|
|||||
|
 | |
| |
| |
| |
| |
| |
|
Gene: RPP30 |
Gene summary for RPP30 |
| Gene information | Species | Human | Gene symbol | RPP30 | Gene ID | 10556 |
| Gene name | ribonuclease P/MRP subunit p30 | |
| Gene Alias | TSG15 | |
| Cytomap | 10q23.31 | |
| Gene Type | protein-coding | GO ID | GO:0000966 | UniProtAcc | P78346 |
Top |
Malignant transformation analysis |
| Identification of the aberrant gene expression in precancerous and cancerous lesions by comparing the gene expression of stem-like cells in diseased tissues with normal stem cells |
| Entrez ID | Symbol | Replicates | Species | Organ | Tissue | Adj P-value | Log2FC | Malignancy |
| 10556 | RPP30 | LZE4T | Human | Esophagus | ESCC | 7.16e-08 | 2.58e-01 | 0.0811 |
| 10556 | RPP30 | LZE7T | Human | Esophagus | ESCC | 4.31e-02 | 1.53e-01 | 0.0667 |
| 10556 | RPP30 | LZE8T | Human | Esophagus | ESCC | 1.76e-04 | 2.31e-01 | 0.067 |
| 10556 | RPP30 | LZE20T | Human | Esophagus | ESCC | 1.60e-02 | 6.87e-02 | 0.0662 |
| 10556 | RPP30 | LZE22T | Human | Esophagus | ESCC | 3.76e-02 | 3.70e-01 | 0.068 |
| 10556 | RPP30 | LZE24T | Human | Esophagus | ESCC | 1.19e-15 | 4.11e-01 | 0.0596 |
| 10556 | RPP30 | LZE6T | Human | Esophagus | ESCC | 1.49e-06 | 3.28e-01 | 0.0845 |
| 10556 | RPP30 | P2T-E | Human | Esophagus | ESCC | 3.61e-20 | 3.84e-01 | 0.1177 |
| 10556 | RPP30 | P4T-E | Human | Esophagus | ESCC | 4.61e-28 | 7.46e-01 | 0.1323 |
| 10556 | RPP30 | P5T-E | Human | Esophagus | ESCC | 1.26e-26 | 5.98e-01 | 0.1327 |
| 10556 | RPP30 | P8T-E | Human | Esophagus | ESCC | 3.91e-16 | 3.42e-01 | 0.0889 |
| 10556 | RPP30 | P9T-E | Human | Esophagus | ESCC | 2.55e-09 | 2.01e-01 | 0.1131 |
| 10556 | RPP30 | P10T-E | Human | Esophagus | ESCC | 1.07e-09 | 1.51e-01 | 0.116 |
| 10556 | RPP30 | P11T-E | Human | Esophagus | ESCC | 5.54e-11 | 4.78e-01 | 0.1426 |
| 10556 | RPP30 | P12T-E | Human | Esophagus | ESCC | 1.45e-27 | 5.85e-01 | 0.1122 |
| 10556 | RPP30 | P15T-E | Human | Esophagus | ESCC | 3.14e-20 | 4.87e-01 | 0.1149 |
| 10556 | RPP30 | P16T-E | Human | Esophagus | ESCC | 8.58e-30 | 5.00e-01 | 0.1153 |
| 10556 | RPP30 | P17T-E | Human | Esophagus | ESCC | 1.62e-06 | 4.39e-01 | 0.1278 |
| 10556 | RPP30 | P19T-E | Human | Esophagus | ESCC | 9.93e-06 | 5.53e-01 | 0.1662 |
| 10556 | RPP30 | P20T-E | Human | Esophagus | ESCC | 3.02e-08 | 5.71e-02 | 0.1124 |
| Page: 1 2 3 4 5 6 |
| Tissue | Expression Dynamics | Abbreviation |
| Esophagus | 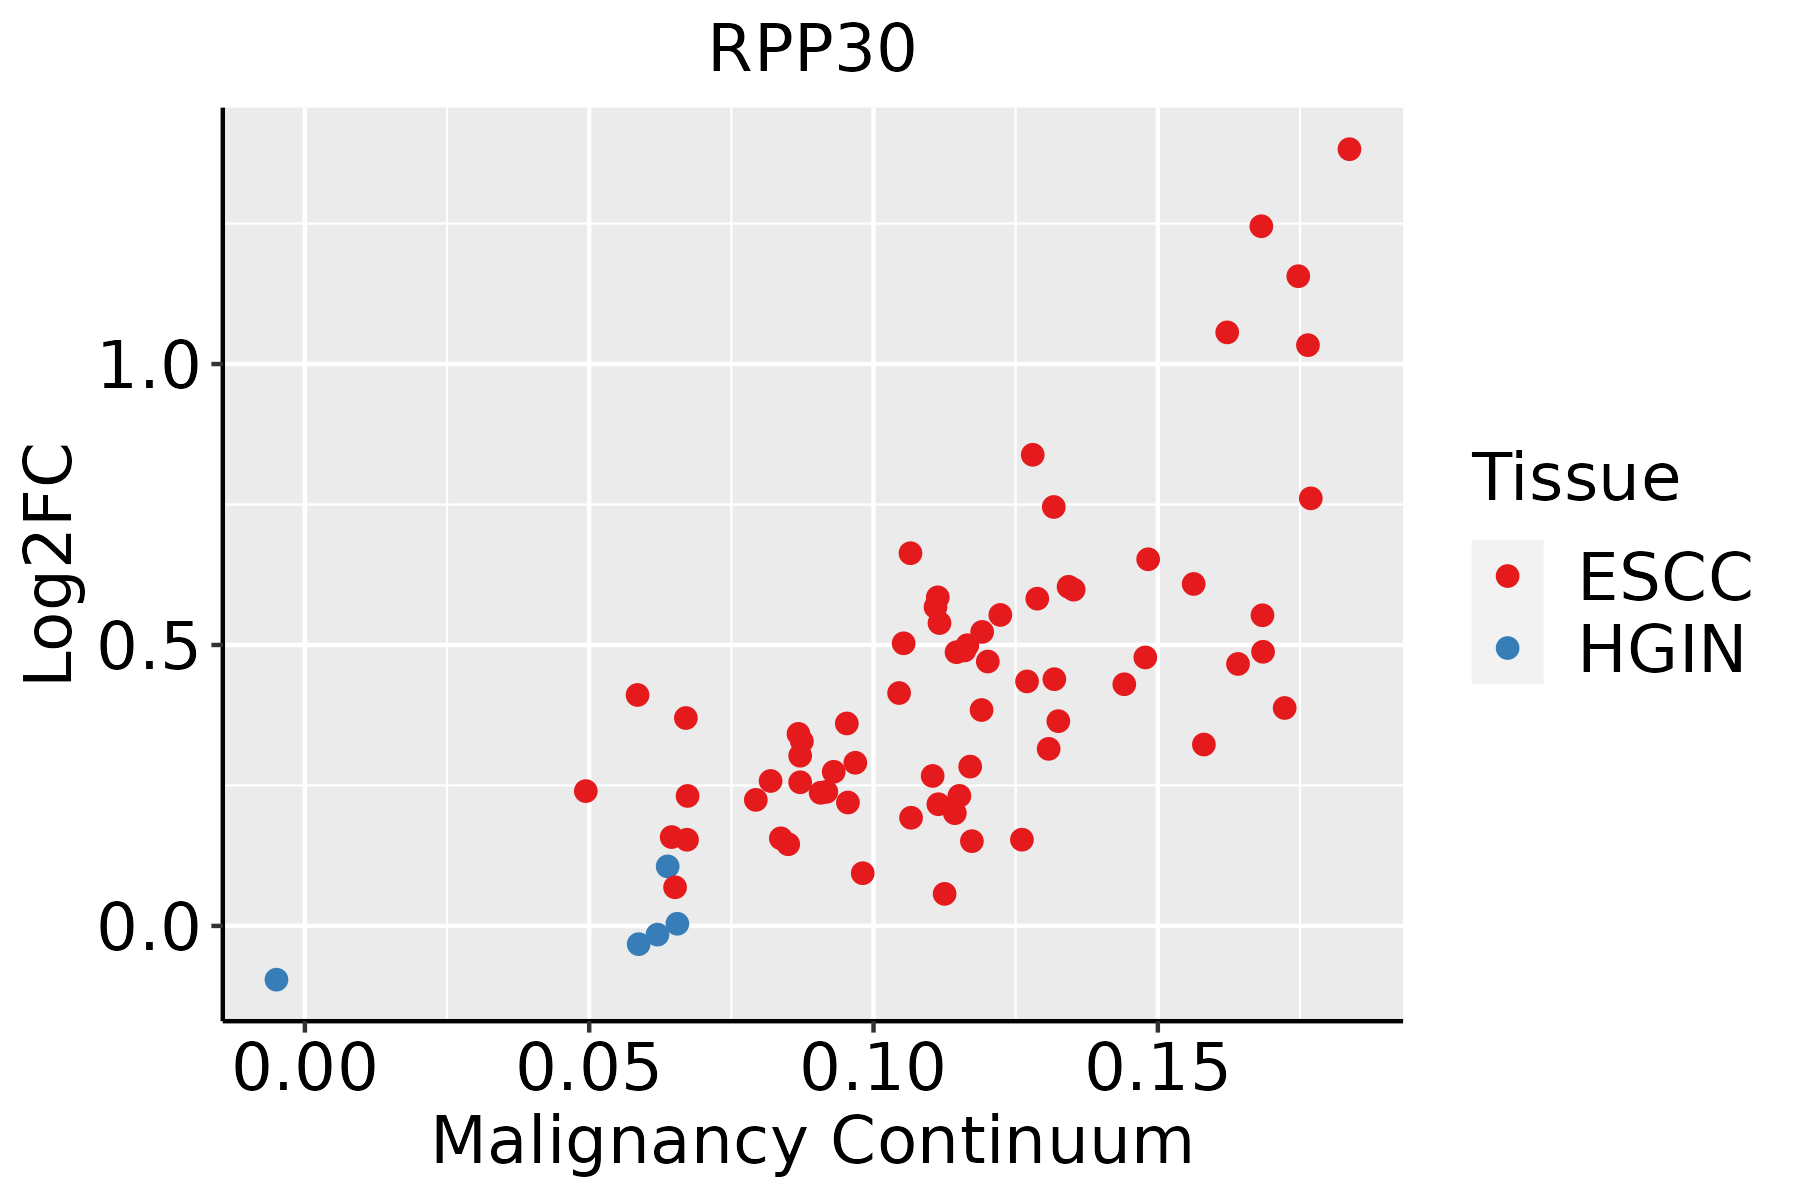 | ESCC: Esophageal squamous cell carcinoma |
| HGIN: High-grade intraepithelial neoplasias | ||
| LGIN: Low-grade intraepithelial neoplasias | ||
| Liver | 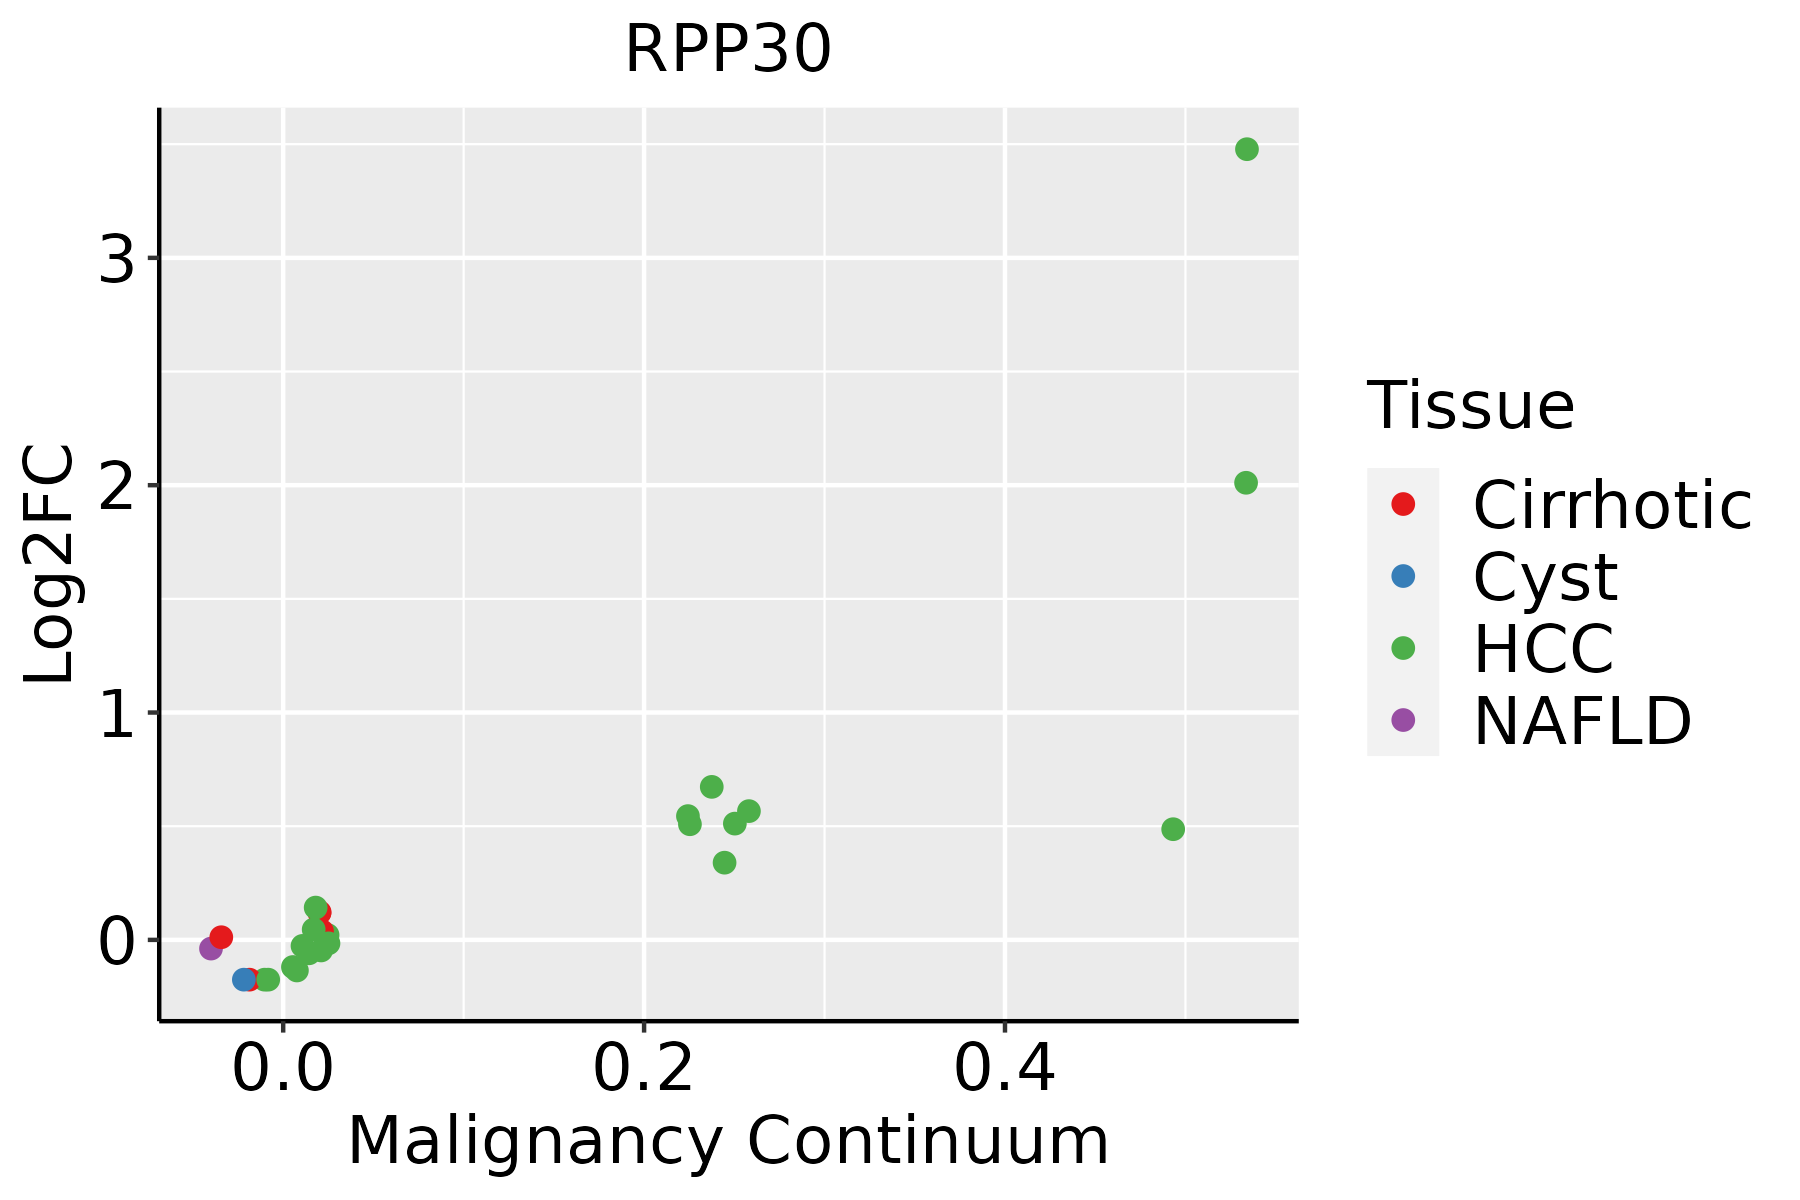 | HCC: Hepatocellular carcinoma |
| NAFLD: Non-alcoholic fatty liver disease | ||
| Oral Cavity | 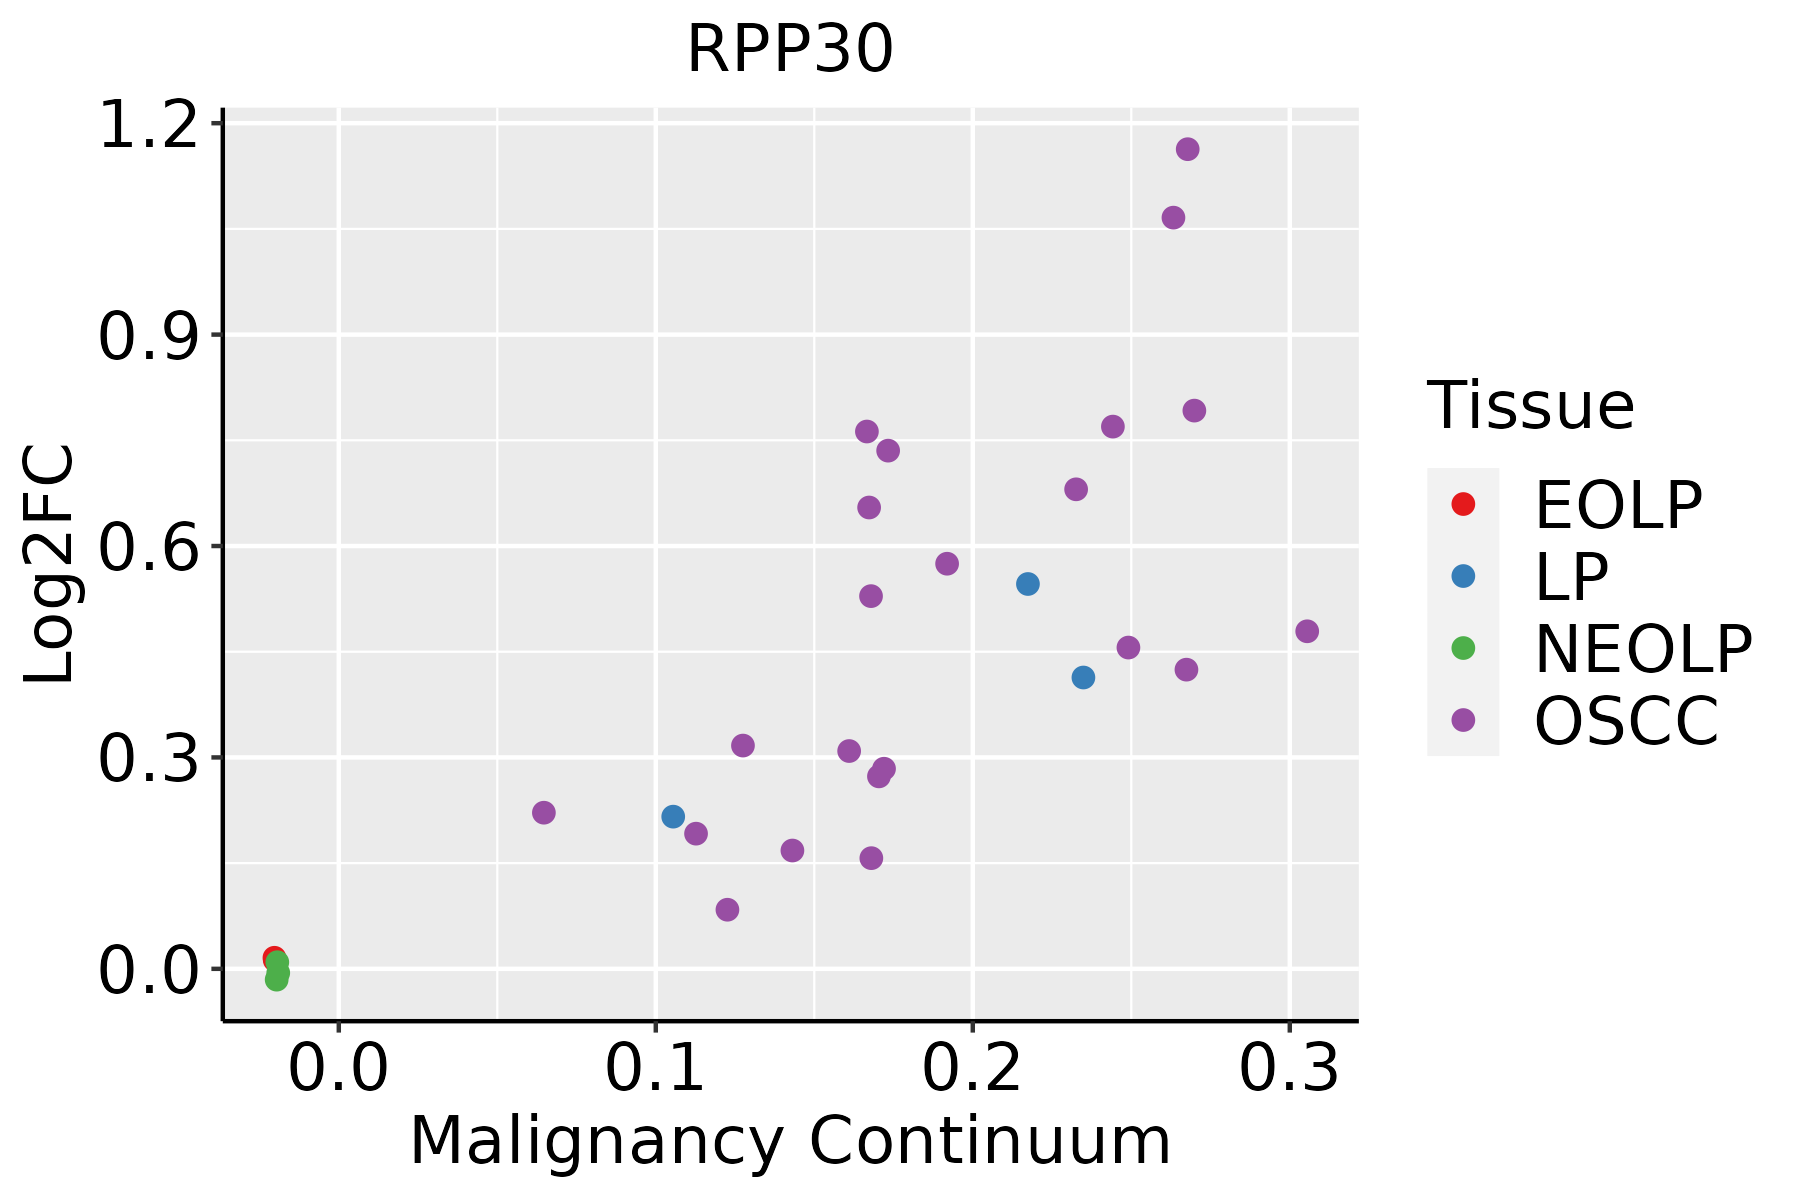 | EOLP: Erosive Oral lichen planus |
| LP: leukoplakia | ||
| NEOLP: Non-erosive oral lichen planus | ||
| OSCC: Oral squamous cell carcinoma | ||
| Skin | 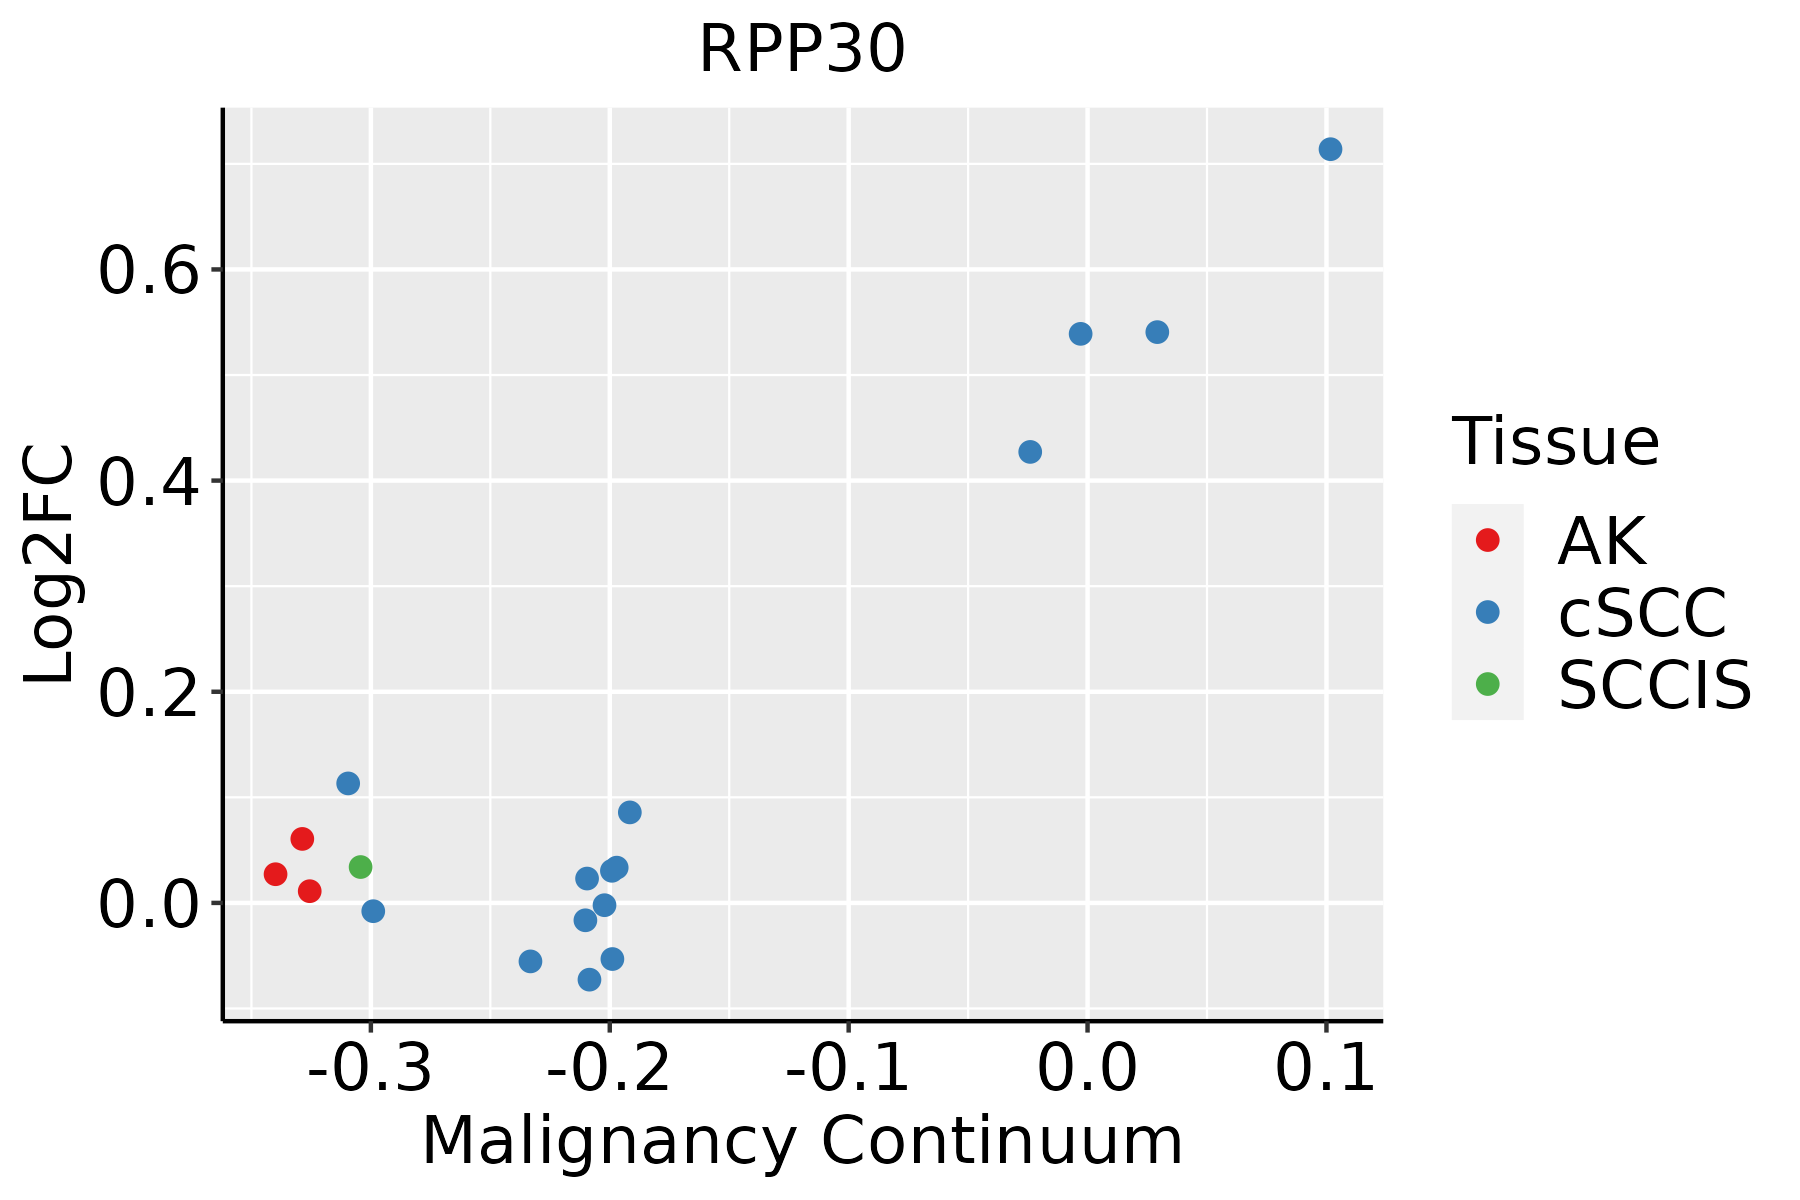 | AK: Actinic keratosis |
| cSCC: Cutaneous squamous cell carcinoma | ||
| SCCIS:squamous cell carcinoma in situ | ||
| Thyroid | 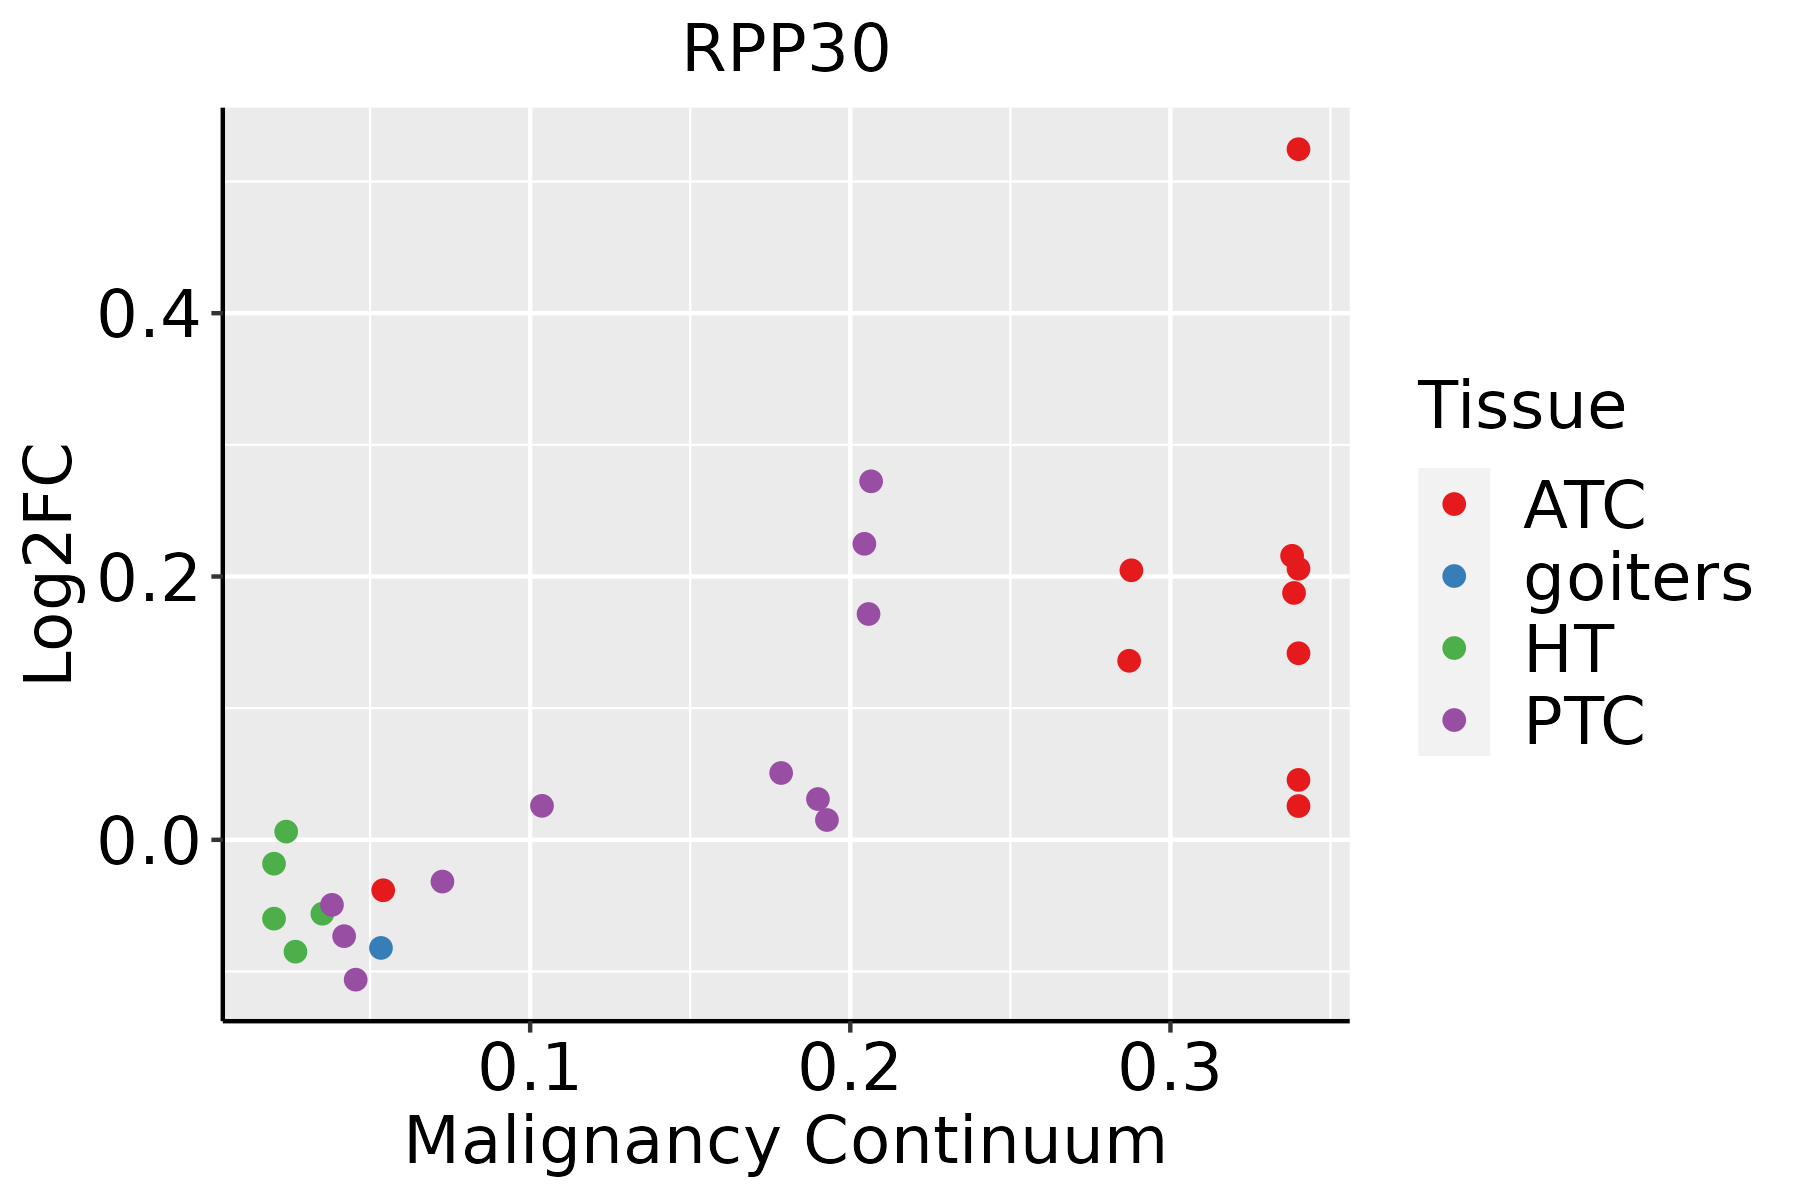 | ATC: Anaplastic thyroid cancer |
| HT: Hashimoto's thyroiditis | ||
| PTC: Papillary thyroid cancer |
| ∗log2FC in expression of this searched gene in stem-like cells from each diseased tissue sample relative to stem-like cells in normal samples in each tissue plotted against the malignancy continuum. Samples are colored based on if they are from different disease stage. |
Top |
Malignant transformation related pathway analysis |
| Find out the enriched GO biological processes and KEGG pathways involved in transition from healthy to precancer to cancer |
| Tissue | Disease Stage | Enriched GO biological Processes |
| Colorectum | AD |  |
| Colorectum | SER |  |
| Colorectum | MSS |  |
| Colorectum | MSI-H |  |
| Colorectum | FAP |  |
| ∗Top 15 enriched GO BP terms are showed in the bar plot of each disease state in each tissue. Each row represents a significant GO biological process which is colored according to the -log10(p.adjust). |
| Page: 1 2 3 4 5 6 7 8 9 |
| GO ID | Tissue | Disease Stage | Description | Gene Ratio | Bg Ratio | pvalue | p.adjust | Count |
| GO:00344709 | Oral cavity | OSCC | ncRNA processing | 263/7305 | 395/18723 | 4.38e-29 | 2.78e-26 | 263 |
| GO:001607210 | Oral cavity | OSCC | rRNA metabolic process | 176/7305 | 236/18723 | 6.51e-29 | 3.24e-26 | 176 |
| GO:00346605 | Oral cavity | OSCC | ncRNA metabolic process | 296/7305 | 485/18723 | 2.94e-23 | 6.65e-21 | 296 |
| GO:00905012 | Oral cavity | OSCC | RNA phosphodiester bond hydrolysis | 95/7305 | 152/18723 | 3.65e-09 | 8.22e-08 | 95 |
| GO:00080332 | Oral cavity | OSCC | tRNA processing | 78/7305 | 127/18723 | 2.56e-07 | 4.00e-06 | 78 |
| GO:00903052 | Oral cavity | OSCC | nucleic acid phosphodiester bond hydrolysis | 142/7305 | 261/18723 | 2.90e-07 | 4.43e-06 | 142 |
| GO:00063991 | Oral cavity | OSCC | tRNA metabolic process | 101/7305 | 179/18723 | 1.65e-06 | 2.15e-05 | 101 |
| GO:00991162 | Oral cavity | OSCC | tRNA 5'-end processing | 14/7305 | 16/18723 | 9.15e-05 | 6.93e-04 | 14 |
| GO:00344712 | Oral cavity | OSCC | ncRNA 5'-end processing | 17/7305 | 21/18723 | 1.07e-04 | 7.89e-04 | 17 |
| GO:00009662 | Oral cavity | OSCC | RNA 5'-end processing | 18/7305 | 23/18723 | 1.47e-04 | 1.04e-03 | 18 |
| GO:00016822 | Oral cavity | OSCC | tRNA 5'-leader removal | 11/7305 | 13/18723 | 1.02e-03 | 5.29e-03 | 11 |
| GO:00905022 | Oral cavity | OSCC | RNA phosphodiester bond hydrolysis, endonucleolytic | 44/7305 | 82/18723 | 4.95e-03 | 1.94e-02 | 44 |
| GO:002261329 | Skin | cSCC | ribonucleoprotein complex biogenesis | 302/4864 | 463/18723 | 5.13e-72 | 3.22e-68 | 302 |
| GO:004225428 | Skin | cSCC | ribosome biogenesis | 206/4864 | 299/18723 | 3.33e-55 | 1.04e-51 | 206 |
| GO:000636424 | Skin | cSCC | rRNA processing | 156/4864 | 225/18723 | 1.42e-42 | 1.48e-39 | 156 |
| GO:001607224 | Skin | cSCC | rRNA metabolic process | 158/4864 | 236/18723 | 4.06e-40 | 2.83e-37 | 158 |
| GO:003447017 | Skin | cSCC | ncRNA processing | 215/4864 | 395/18723 | 6.83e-34 | 4.28e-31 | 215 |
| GO:003466013 | Skin | cSCC | ncRNA metabolic process | 234/4864 | 485/18723 | 1.37e-26 | 4.77e-24 | 234 |
| GO:00905014 | Skin | cSCC | RNA phosphodiester bond hydrolysis | 71/4864 | 152/18723 | 2.72e-08 | 7.41e-07 | 71 |
| GO:00903054 | Skin | cSCC | nucleic acid phosphodiester bond hydrolysis | 97/4864 | 261/18723 | 4.08e-05 | 4.34e-04 | 97 |
| Page: 1 2 3 4 5 |
| Pathway ID | Tissue | Disease Stage | Description | Gene Ratio | Bg Ratio | pvalue | p.adjust | qvalue | Count |
| Page: 1 |
Top |
Cell-cell communication analysis |
| Identification of potential cell-cell interactions between two cell types and their ligand-receptor pairs for different disease states |
| Ligand | Receptor | LRpair | Pathway | Tissue | Disease Stage |
| Page: 1 |
Top |
Single-cell gene regulatory network inference analysis |
| Find out the significant the regulons (TFs) and the target genes of each regulon across cell types for different disease states |
| TF | Cell Type | Tissue | Disease Stage | Target Gene | RSS | Regulon Activity |
| ∗The dot plots of a searched regulon are shown for all cell subpopulations in each disease state of each tissue based on the regulon specific score inferred using pySCENIC and by calculating the average expression. |
| Page: 1 |
Top |
Somatic mutation of malignant transformation related genes |
| Annotation of somatic variants for genes involved in malignant transformation |
| Hugo Symbol | Variant Class | Variant Classification | dbSNP RS | HGVSc | HGVSp | HGVSp Short | SWISSPROT | BIOTYPE | SIFT | PolyPhen | Tumor Sample Barcode | Tissue | Histology | Sex | Age | Stage | Therapy Types | Drugs | Outcome |
| RPP30 | SNV | Missense_Mutation | rs376621947 | c.436A>G | p.Ile146Val | p.I146V | P78346 | protein_coding | deleterious(0.05) | benign(0.022) | TCGA-A8-A08X-01 | Breast | breast invasive carcinoma | Female | <65 | III/IV | Chemotherapy | doxorubicin | PD |
| RPP30 | SNV | Missense_Mutation | c.607N>T | p.Val203Leu | p.V203L | P78346 | protein_coding | deleterious(0.03) | benign(0.433) | TCGA-AC-A3YI-01 | Breast | breast invasive carcinoma | Female | >=65 | III/IV | Chemotherapy | cytoxan | CR | |
| RPP30 | SNV | Missense_Mutation | c.273A>T | p.Arg91Ser | p.R91S | P78346 | protein_coding | tolerated(0.21) | probably_damaging(0.993) | TCGA-E2-A15M-01 | Breast | breast invasive carcinoma | Female | >=65 | I/II | Hormone Therapy | arimidex | SD | |
| RPP30 | insertion | Frame_Shift_Ins | novel | c.963_964insA | p.Leu322ThrfsTer? | p.L322Tfs*? | P78346 | protein_coding | TCGA-AN-A0FN-01 | Breast | breast invasive carcinoma | Female | <65 | I/II | Unknown | Unknown | SD | ||
| RPP30 | SNV | Missense_Mutation | novel | c.758N>T | p.Gly253Val | p.G253V | P78346 | protein_coding | tolerated(0.36) | benign(0) | TCGA-VS-A9UP-01 | Cervix | cervical & endocervical cancer | Female | <65 | I/II | Chemotherapy | cisplatin | PD |
| RPP30 | SNV | Missense_Mutation | rs768419490 | c.434N>T | p.Ala145Val | p.A145V | P78346 | protein_coding | deleterious(0.01) | benign(0.341) | TCGA-AD-A5EJ-01 | Colorectum | colon adenocarcinoma | Female | >=65 | I/II | Unknown | Unknown | SD |
| RPP30 | SNV | Missense_Mutation | rs764936639 | c.607N>A | p.Val203Met | p.V203M | P78346 | protein_coding | deleterious(0) | possibly_damaging(0.883) | TCGA-A5-A0VP-01 | Endometrium | uterine corpus endometrioid carcinoma | Female | >=65 | I/II | Unknown | Unknown | SD |
| RPP30 | SNV | Missense_Mutation | c.22G>A | p.Asp8Asn | p.D8N | P78346 | protein_coding | tolerated(1) | benign(0) | TCGA-AP-A056-01 | Endometrium | uterine corpus endometrioid carcinoma | Female | <65 | I/II | Unknown | Unknown | SD | |
| RPP30 | SNV | Missense_Mutation | novel | c.563N>A | p.Ser188Tyr | p.S188Y | P78346 | protein_coding | deleterious(0) | benign(0.194) | TCGA-AP-A0LM-01 | Endometrium | uterine corpus endometrioid carcinoma | Female | <65 | III/IV | Chemotherapy | cisplatin | SD |
| RPP30 | SNV | Missense_Mutation | novel | c.290N>T | p.Ala97Val | p.A97V | P78346 | protein_coding | tolerated(0.91) | benign(0.003) | TCGA-AX-A0IZ-01 | Endometrium | uterine corpus endometrioid carcinoma | Female | <65 | I/II | Unknown | Unknown | SD |
| Page: 1 2 3 |
Top |
Related drugs of malignant transformation related genes |
| Identification of chemicals and drugs interact with genes involved in malignant transfromation |
| (DGIdb 4.0) |
| Entrez ID | Symbol | Category | Interaction Types | Drug Claim Name | Drug Name | PMIDs |
| Page: 1 |

Copyright 2023-Present -The University of Texas Health Science Center at Houston |