| Tissue | Expression Dynamics | Abbreviation |
| Cervix | 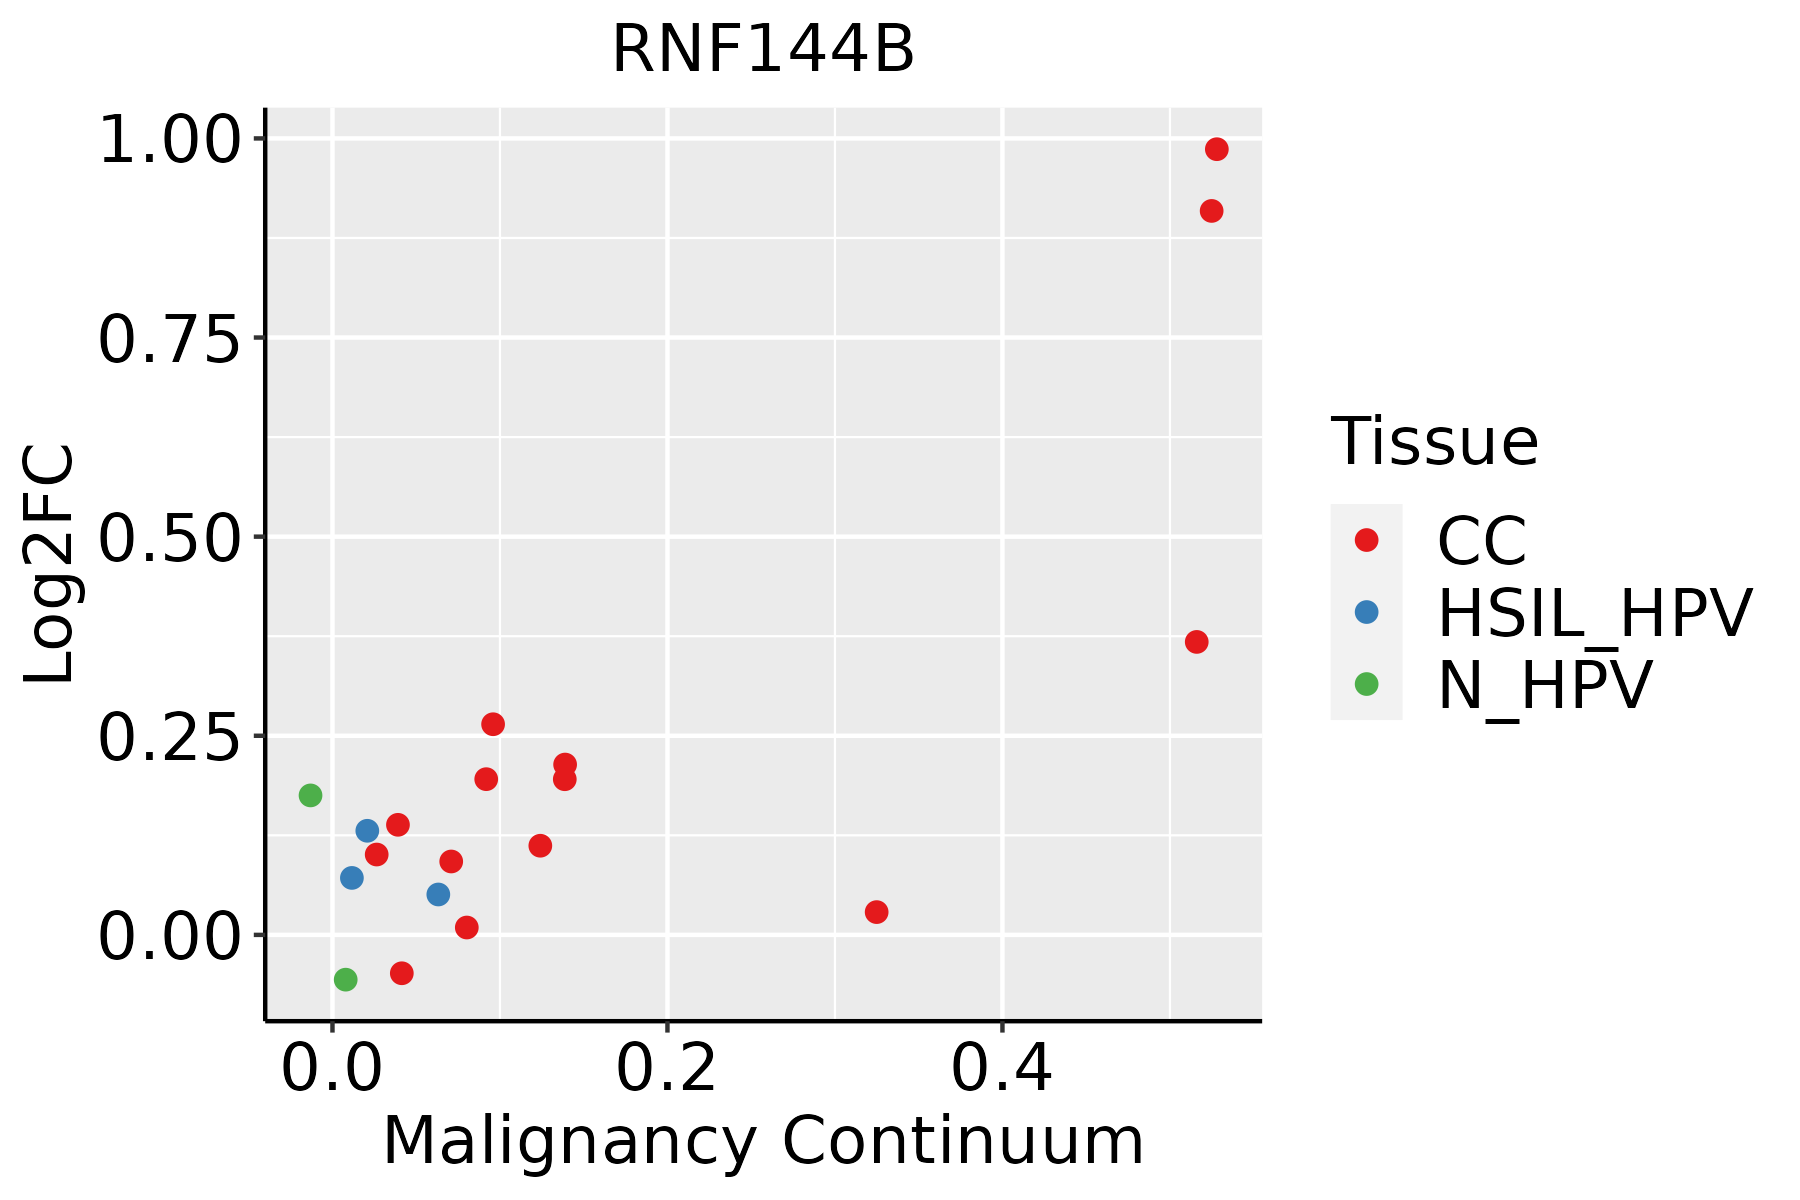 | CC: Cervix cancer |
| HSIL_HPV: HPV-infected high-grade squamous intraepithelial lesions |
| N_HPV: HPV-infected normal cervix |
| Esophagus | 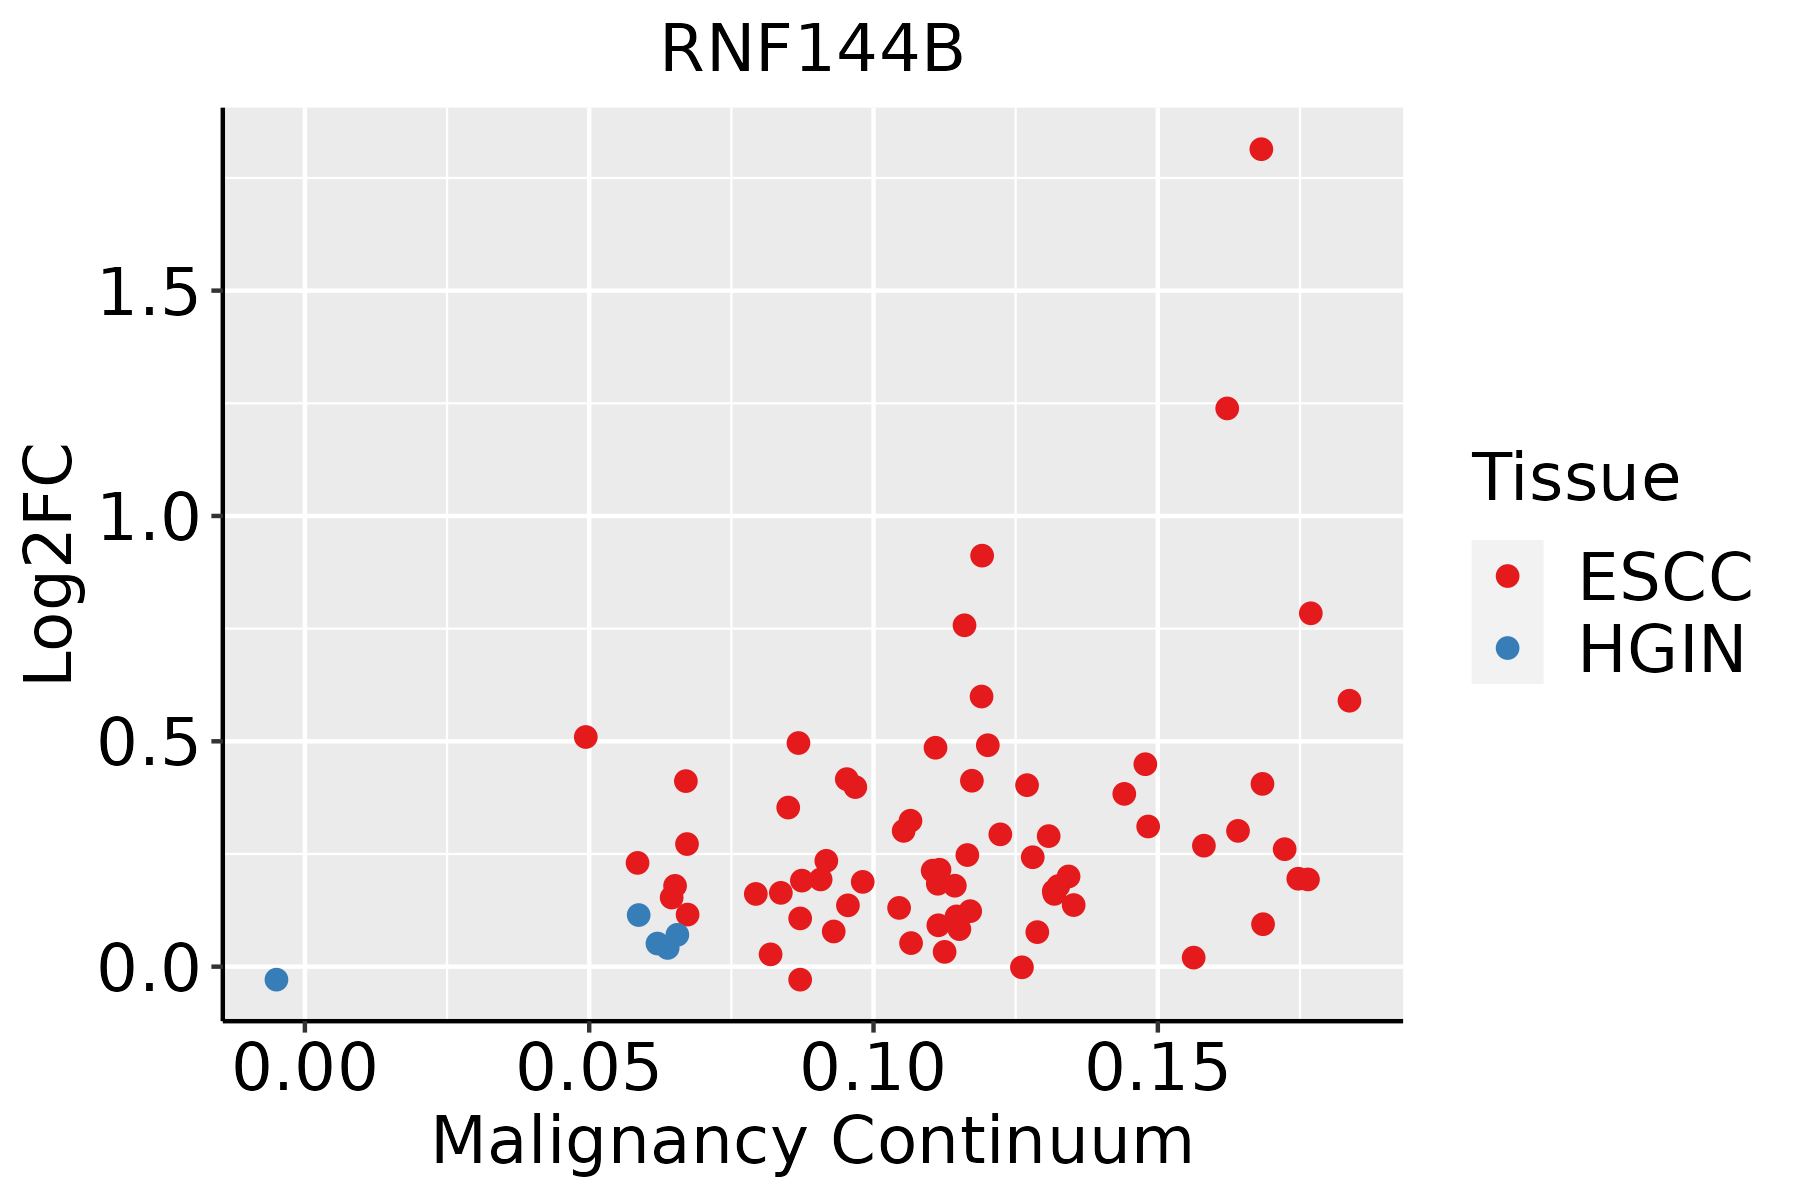 | ESCC: Esophageal squamous cell carcinoma |
| HGIN: High-grade intraepithelial neoplasias |
| LGIN: Low-grade intraepithelial neoplasias |
| Oral Cavity | 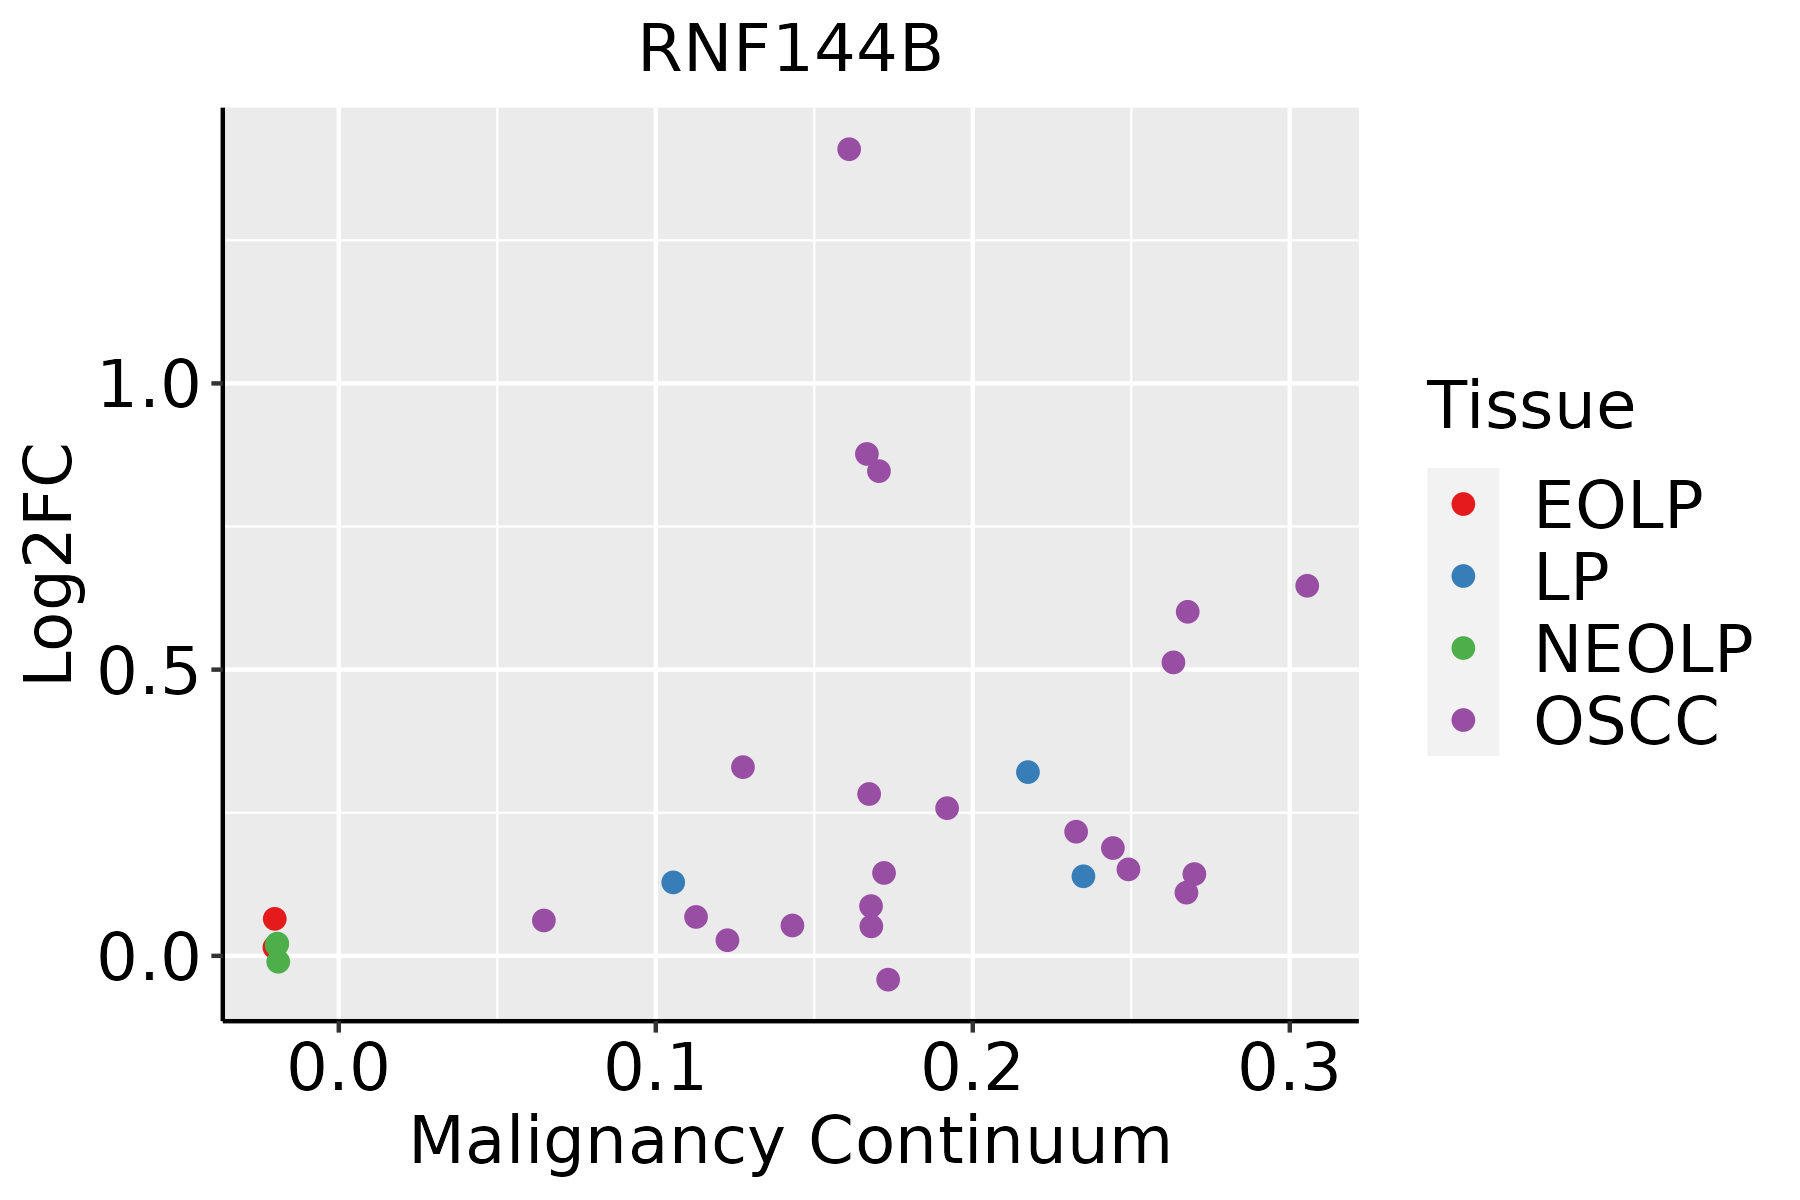 | EOLP: Erosive Oral lichen planus |
| LP: leukoplakia |
| NEOLP: Non-erosive oral lichen planus |
| OSCC: Oral squamous cell carcinoma |
| Thyroid |  | ATC: Anaplastic thyroid cancer |
| HT: Hashimoto's thyroiditis |
| PTC: Papillary thyroid cancer |
| GO ID | Tissue | Disease Stage | Description | Gene Ratio | Bg Ratio | pvalue | p.adjust | Count |
| GO:1903362111 | Esophagus | ESCC | regulation of cellular protein catabolic process | 188/8552 | 255/18723 | 5.12e-20 | 6.62e-18 | 188 |
| GO:0045862111 | Esophagus | ESCC | positive regulation of proteolysis | 256/8552 | 372/18723 | 7.88e-20 | 9.43e-18 | 256 |
| GO:1903050111 | Esophagus | ESCC | regulation of proteolysis involved in cellular protein catabolic process | 163/8552 | 221/18723 | 1.44e-17 | 1.27e-15 | 163 |
| GO:0061136111 | Esophagus | ESCC | regulation of proteasomal protein catabolic process | 142/8552 | 187/18723 | 2.40e-17 | 2.00e-15 | 142 |
| GO:000020917 | Esophagus | ESCC | protein polyubiquitination | 170/8552 | 236/18723 | 1.40e-16 | 1.09e-14 | 170 |
| GO:0045732111 | Esophagus | ESCC | positive regulation of protein catabolic process | 167/8552 | 231/18723 | 1.47e-16 | 1.14e-14 | 167 |
| GO:0032434111 | Esophagus | ESCC | regulation of proteasomal ubiquitin-dependent protein catabolic process | 107/8552 | 134/18723 | 4.06e-16 | 2.93e-14 | 107 |
| GO:2000058111 | Esophagus | ESCC | regulation of ubiquitin-dependent protein catabolic process | 125/8552 | 164/18723 | 1.17e-15 | 7.76e-14 | 125 |
| GO:1903364111 | Esophagus | ESCC | positive regulation of cellular protein catabolic process | 117/8552 | 155/18723 | 3.25e-14 | 1.66e-12 | 117 |
| GO:1901800110 | Esophagus | ESCC | positive regulation of proteasomal protein catabolic process | 91/8552 | 114/18723 | 6.74e-14 | 3.34e-12 | 91 |
| GO:1903052110 | Esophagus | ESCC | positive regulation of proteolysis involved in cellular protein catabolic process | 101/8552 | 133/18723 | 9.58e-13 | 4.19e-11 | 101 |
| GO:0032436111 | Esophagus | ESCC | positive regulation of proteasomal ubiquitin-dependent protein catabolic process | 72/8552 | 90/18723 | 2.30e-11 | 7.87e-10 | 72 |
| GO:2000060111 | Esophagus | ESCC | positive regulation of ubiquitin-dependent protein catabolic process | 81/8552 | 107/18723 | 2.23e-10 | 6.34e-09 | 81 |
| GO:001049820 | Oral cavity | OSCC | proteasomal protein catabolic process | 336/7305 | 490/18723 | 5.45e-41 | 8.63e-38 | 336 |
| GO:004316120 | Oral cavity | OSCC | proteasome-mediated ubiquitin-dependent protein catabolic process | 285/7305 | 412/18723 | 5.68e-36 | 5.99e-33 | 285 |
| GO:000989620 | Oral cavity | OSCC | positive regulation of catabolic process | 307/7305 | 492/18723 | 2.29e-26 | 7.64e-24 | 307 |
| GO:003133120 | Oral cavity | OSCC | positive regulation of cellular catabolic process | 273/7305 | 427/18723 | 6.39e-26 | 2.02e-23 | 273 |
| GO:004217620 | Oral cavity | OSCC | regulation of protein catabolic process | 254/7305 | 391/18723 | 1.07e-25 | 3.22e-23 | 254 |
| GO:004586220 | Oral cavity | OSCC | positive regulation of proteolysis | 236/7305 | 372/18723 | 6.53e-22 | 1.38e-19 | 236 |
| GO:190336220 | Oral cavity | OSCC | regulation of cellular protein catabolic process | 174/7305 | 255/18723 | 2.04e-21 | 3.70e-19 | 174 |
| Hugo Symbol | Variant Class | Variant Classification | dbSNP RS | HGVSc | HGVSp | HGVSp Short | SWISSPROT | BIOTYPE | SIFT | PolyPhen | Tumor Sample Barcode | Tissue | Histology | Sex | Age | Stage | Therapy Types | Drugs | Outcome |
| RNF144B | SNV | Missense_Mutation | | c.730N>G | p.Leu244Val | p.L244V | Q7Z419 | protein_coding | deleterious(0) | probably_damaging(0.999) | TCGA-A7-A0DA-01 | Breast | breast invasive carcinoma | Female | <65 | I/II | Chemotherapy | adriamycin | SD |
| RNF144B | SNV | Missense_Mutation | | c.461N>G | p.Ser154Trp | p.S154W | Q7Z419 | protein_coding | deleterious(0) | probably_damaging(0.984) | TCGA-AR-A250-01 | Breast | breast invasive carcinoma | Female | <65 | I/II | Chemotherapy | doxorubicin | SD |
| RNF144B | deletion | Frame_Shift_Del | | c.44delN | p.Asn16IlefsTer27 | p.N16Ifs*27 | Q7Z419 | protein_coding | | | TCGA-A8-A09Z-01 | Breast | breast invasive carcinoma | Female | >=65 | I/II | Unknown | Unknown | SD |
| RNF144B | deletion | Frame_Shift_Del | | c.74delN | p.Leu27SerfsTer16 | p.L27Sfs*16 | Q7Z419 | protein_coding | | | TCGA-D8-A27V-01 | Breast | breast invasive carcinoma | Female | <65 | I/II | Hormone Therapy | tamoxiphen | SD |
| RNF144B | SNV | Missense_Mutation | novel | c.901T>C | p.Ser301Pro | p.S301P | Q7Z419 | protein_coding | tolerated_low_confidence(0.43) | benign(0) | TCGA-EA-A410-01 | Cervix | cervical & endocervical cancer | Female | <65 | I/II | Unknown | Unknown | SD |
| RNF144B | SNV | Missense_Mutation | novel | c.236N>A | p.Val79Glu | p.V79E | Q7Z419 | protein_coding | tolerated(0.44) | benign(0.065) | TCGA-VS-A9UB-01 | Cervix | cervical & endocervical cancer | Female | <65 | I/II | Chemotherapy | cisplatin | CR |
| RNF144B | SNV | Missense_Mutation | rs767789668 | c.233N>C | p.Met78Thr | p.M78T | Q7Z419 | protein_coding | tolerated(0.17) | benign(0.003) | TCGA-A6-A565-01 | Colorectum | colon adenocarcinoma | Female | <65 | III/IV | Unspecific | 5FU | PD |
| RNF144B | SNV | Missense_Mutation | novel | c.17N>T | p.Arg6Met | p.R6M | Q7Z419 | protein_coding | deleterious_low_confidence(0.05) | benign(0.133) | TCGA-AG-A00Y-01 | Colorectum | rectum adenocarcinoma | Male | >=65 | I/II | Unknown | Unknown | PD |
| RNF144B | SNV | Missense_Mutation | novel | c.775N>A | p.Val259Met | p.V259M | Q7Z419 | protein_coding | deleterious(0.01) | probably_damaging(0.985) | TCGA-A5-A0G2-01 | Endometrium | uterine corpus endometrioid carcinoma | Female | <65 | III/IV | Unknown | Unknown | SD |
| RNF144B | SNV | Missense_Mutation | rs755843328 | c.31G>A | p.Ala11Thr | p.A11T | Q7Z419 | protein_coding | tolerated(1) | benign(0) | TCGA-AJ-A8CT-01 | Endometrium | uterine corpus endometrioid carcinoma | Female | <65 | I/II | Unknown | Unknown | SD |


