
|
|||||
|
 | |
| |
| |
| |
| |
| |
|
Gene: RIOK2 |
Gene summary for RIOK2 |
| Gene information | Species | Human | Gene symbol | RIOK2 | Gene ID | 55781 |
| Gene name | RIO kinase 2 | |
| Gene Alias | RIO2 | |
| Cytomap | 5q15 | |
| Gene Type | protein-coding | GO ID | GO:0000054 | UniProtAcc | Q9BVS4 |
Top |
Malignant transformation analysis |
| Identification of the aberrant gene expression in precancerous and cancerous lesions by comparing the gene expression of stem-like cells in diseased tissues with normal stem cells |
| Entrez ID | Symbol | Replicates | Species | Organ | Tissue | Adj P-value | Log2FC | Malignancy |
| 55781 | RIOK2 | LZE4T | Human | Esophagus | ESCC | 3.71e-06 | 1.76e-01 | 0.0811 |
| 55781 | RIOK2 | LZE24T | Human | Esophagus | ESCC | 1.20e-07 | 1.90e-01 | 0.0596 |
| 55781 | RIOK2 | P2T-E | Human | Esophagus | ESCC | 1.89e-11 | 2.28e-01 | 0.1177 |
| 55781 | RIOK2 | P4T-E | Human | Esophagus | ESCC | 2.86e-09 | 2.48e-01 | 0.1323 |
| 55781 | RIOK2 | P5T-E | Human | Esophagus | ESCC | 3.03e-10 | 2.26e-01 | 0.1327 |
| 55781 | RIOK2 | P8T-E | Human | Esophagus | ESCC | 8.57e-03 | 6.39e-02 | 0.0889 |
| 55781 | RIOK2 | P9T-E | Human | Esophagus | ESCC | 1.45e-02 | 5.92e-02 | 0.1131 |
| 55781 | RIOK2 | P10T-E | Human | Esophagus | ESCC | 1.10e-03 | 1.05e-01 | 0.116 |
| 55781 | RIOK2 | P12T-E | Human | Esophagus | ESCC | 5.70e-15 | 3.59e-01 | 0.1122 |
| 55781 | RIOK2 | P15T-E | Human | Esophagus | ESCC | 2.28e-13 | 2.65e-01 | 0.1149 |
| 55781 | RIOK2 | P16T-E | Human | Esophagus | ESCC | 2.55e-10 | 7.55e-02 | 0.1153 |
| 55781 | RIOK2 | P20T-E | Human | Esophagus | ESCC | 4.41e-14 | 2.91e-01 | 0.1124 |
| 55781 | RIOK2 | P21T-E | Human | Esophagus | ESCC | 1.73e-06 | 1.96e-01 | 0.1617 |
| 55781 | RIOK2 | P22T-E | Human | Esophagus | ESCC | 5.07e-17 | 2.95e-01 | 0.1236 |
| 55781 | RIOK2 | P23T-E | Human | Esophagus | ESCC | 1.39e-14 | 3.00e-01 | 0.108 |
| 55781 | RIOK2 | P24T-E | Human | Esophagus | ESCC | 4.08e-12 | 2.38e-01 | 0.1287 |
| 55781 | RIOK2 | P26T-E | Human | Esophagus | ESCC | 1.13e-19 | 3.33e-01 | 0.1276 |
| 55781 | RIOK2 | P27T-E | Human | Esophagus | ESCC | 9.08e-09 | 1.53e-01 | 0.1055 |
| 55781 | RIOK2 | P30T-E | Human | Esophagus | ESCC | 3.43e-05 | 2.00e-01 | 0.137 |
| 55781 | RIOK2 | P31T-E | Human | Esophagus | ESCC | 3.39e-08 | 1.13e-01 | 0.1251 |
| Page: 1 2 3 4 |
| Tissue | Expression Dynamics | Abbreviation |
| Esophagus | 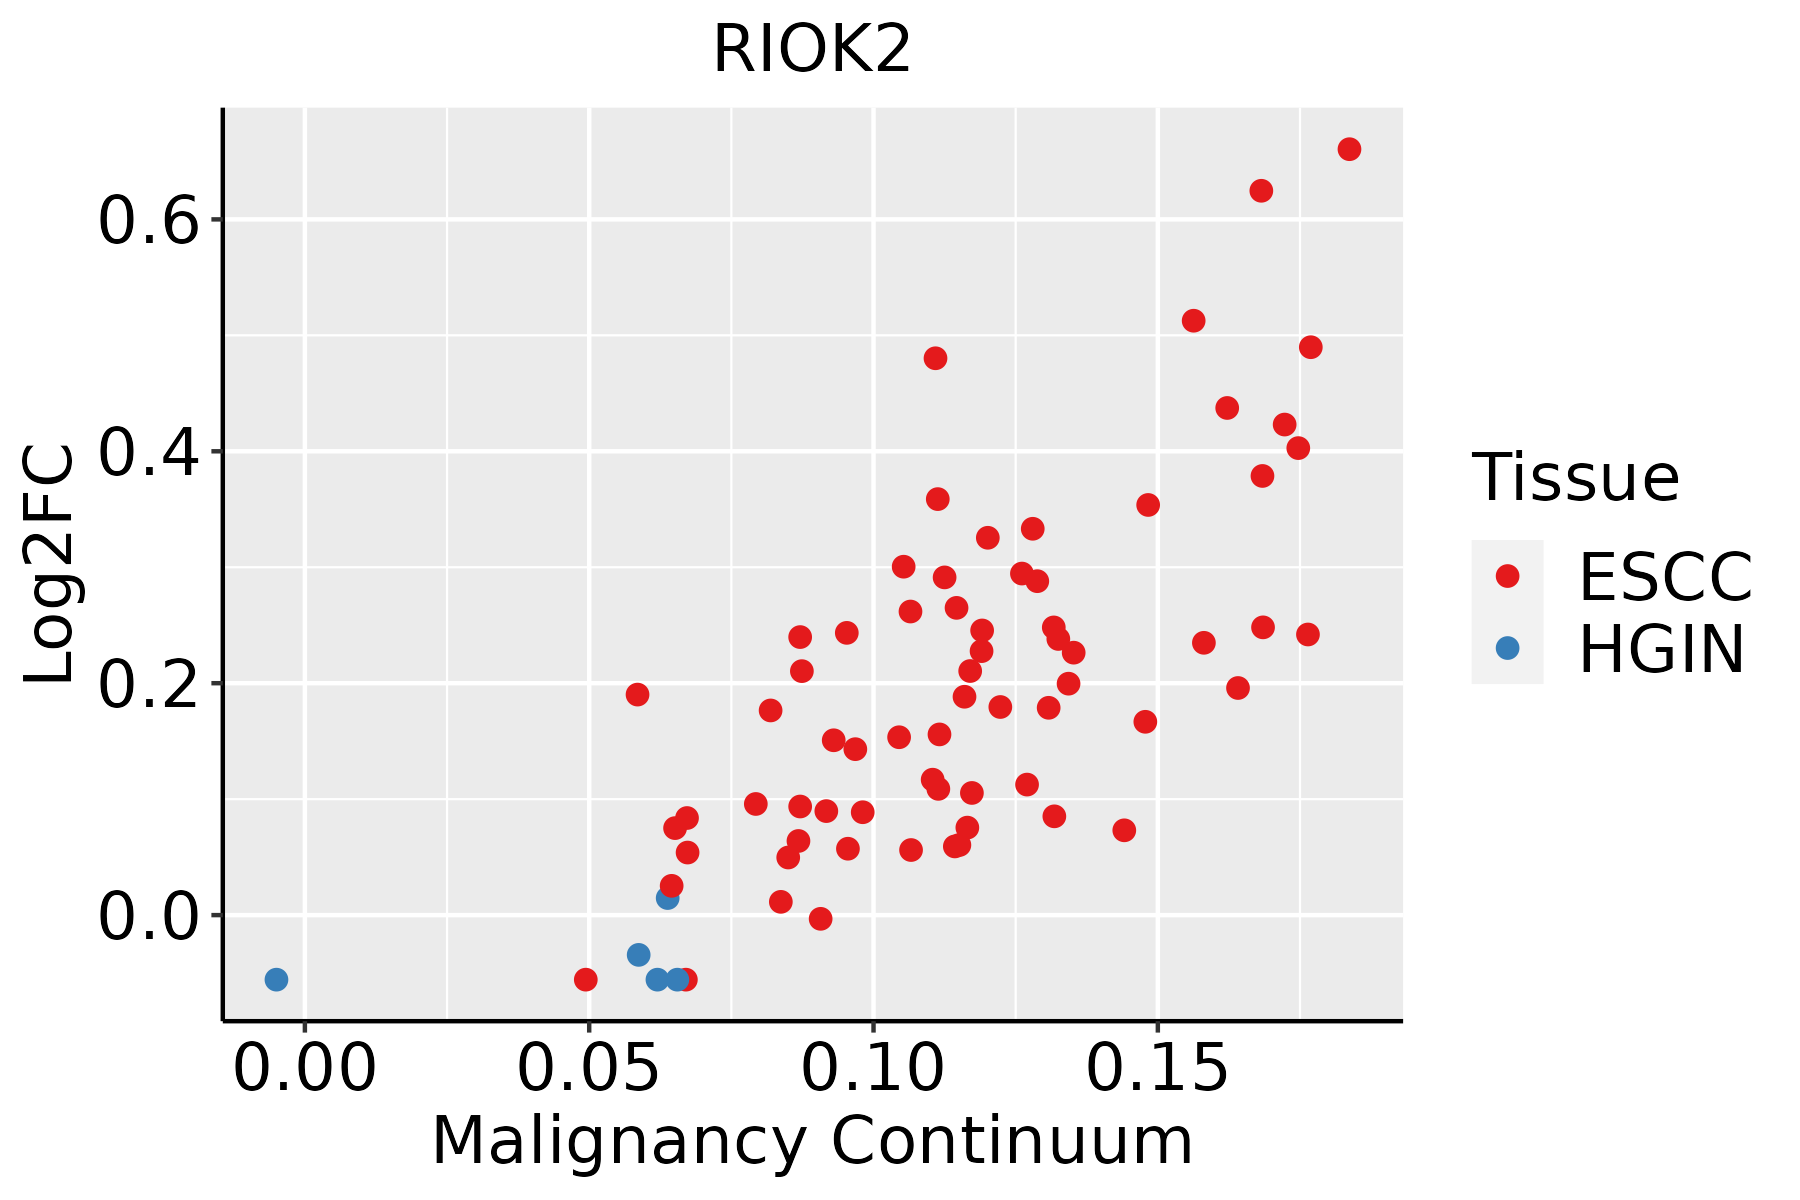 | ESCC: Esophageal squamous cell carcinoma |
| HGIN: High-grade intraepithelial neoplasias | ||
| LGIN: Low-grade intraepithelial neoplasias | ||
| Liver |  | HCC: Hepatocellular carcinoma |
| NAFLD: Non-alcoholic fatty liver disease | ||
| Skin | 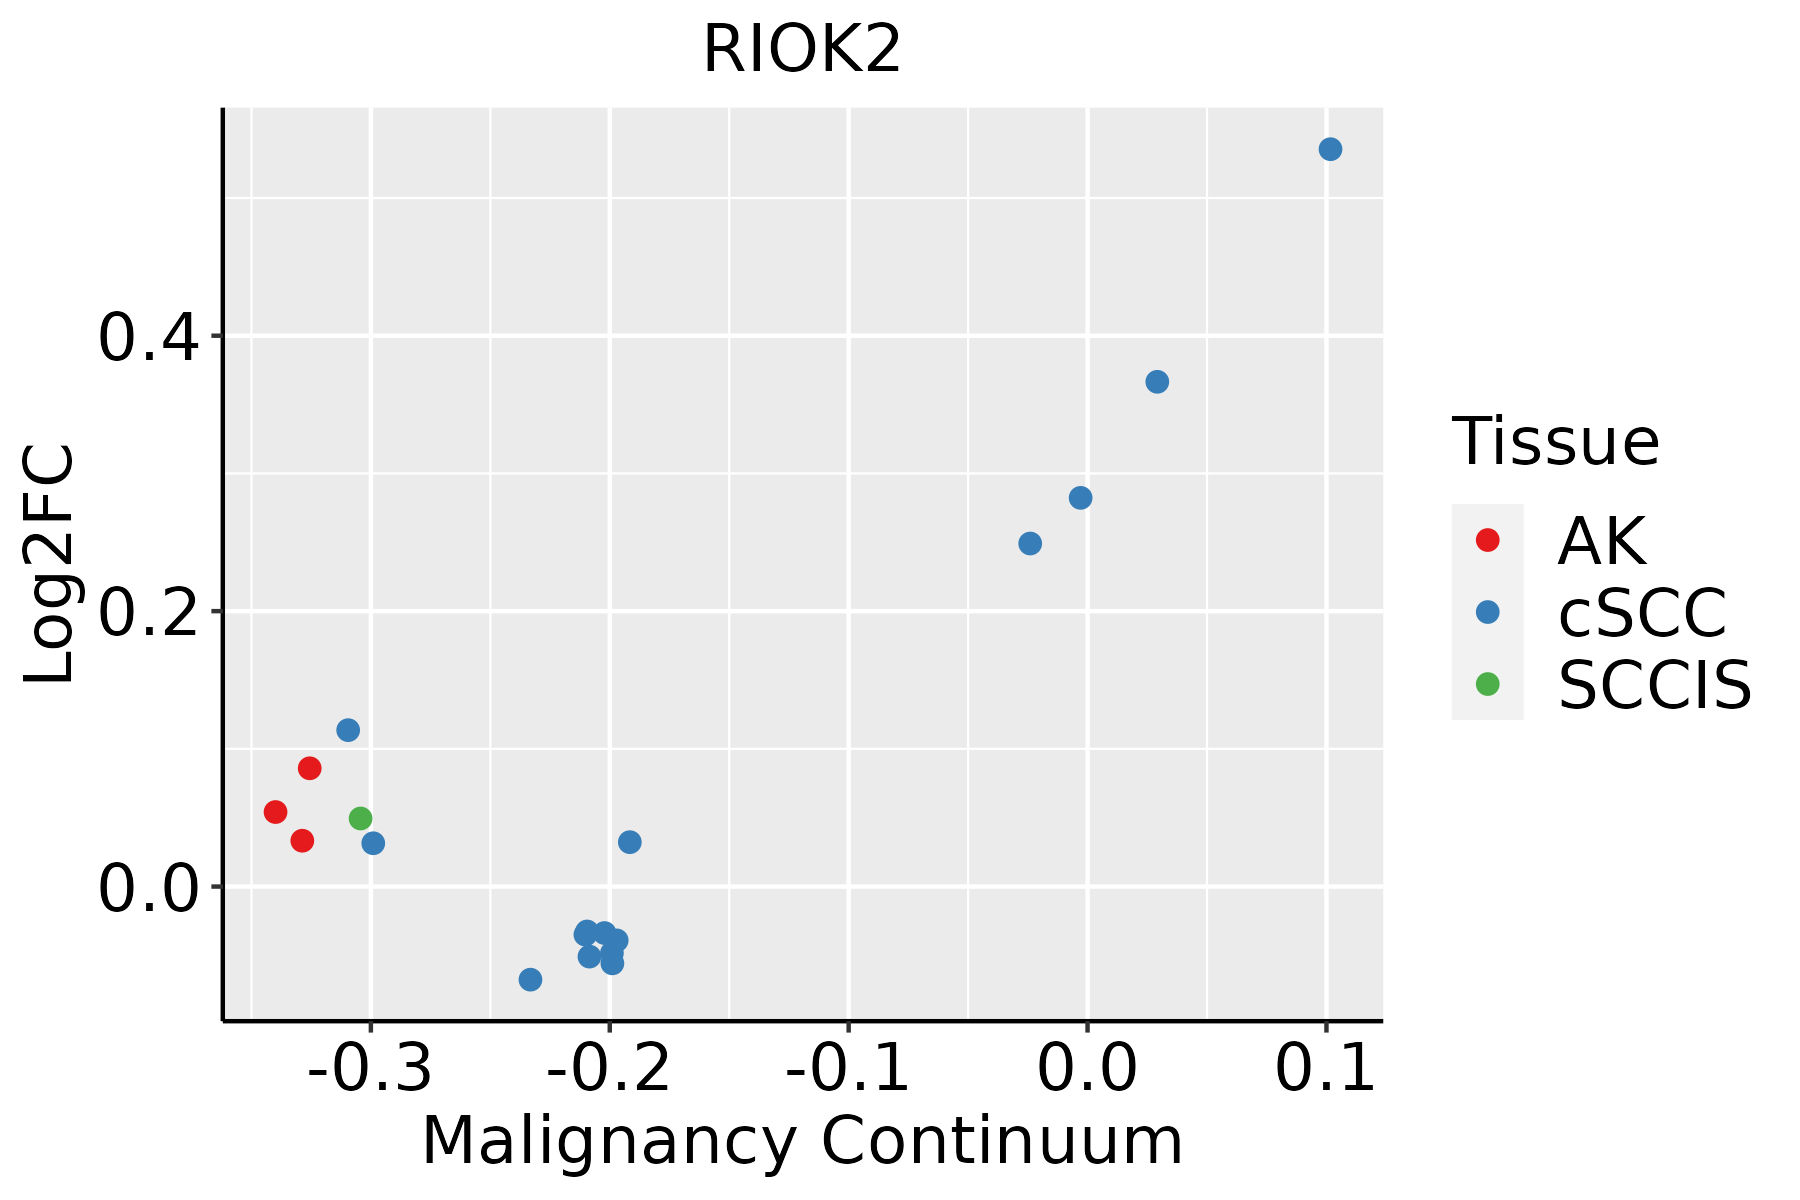 | AK: Actinic keratosis |
| cSCC: Cutaneous squamous cell carcinoma | ||
| SCCIS:squamous cell carcinoma in situ | ||
| Thyroid | 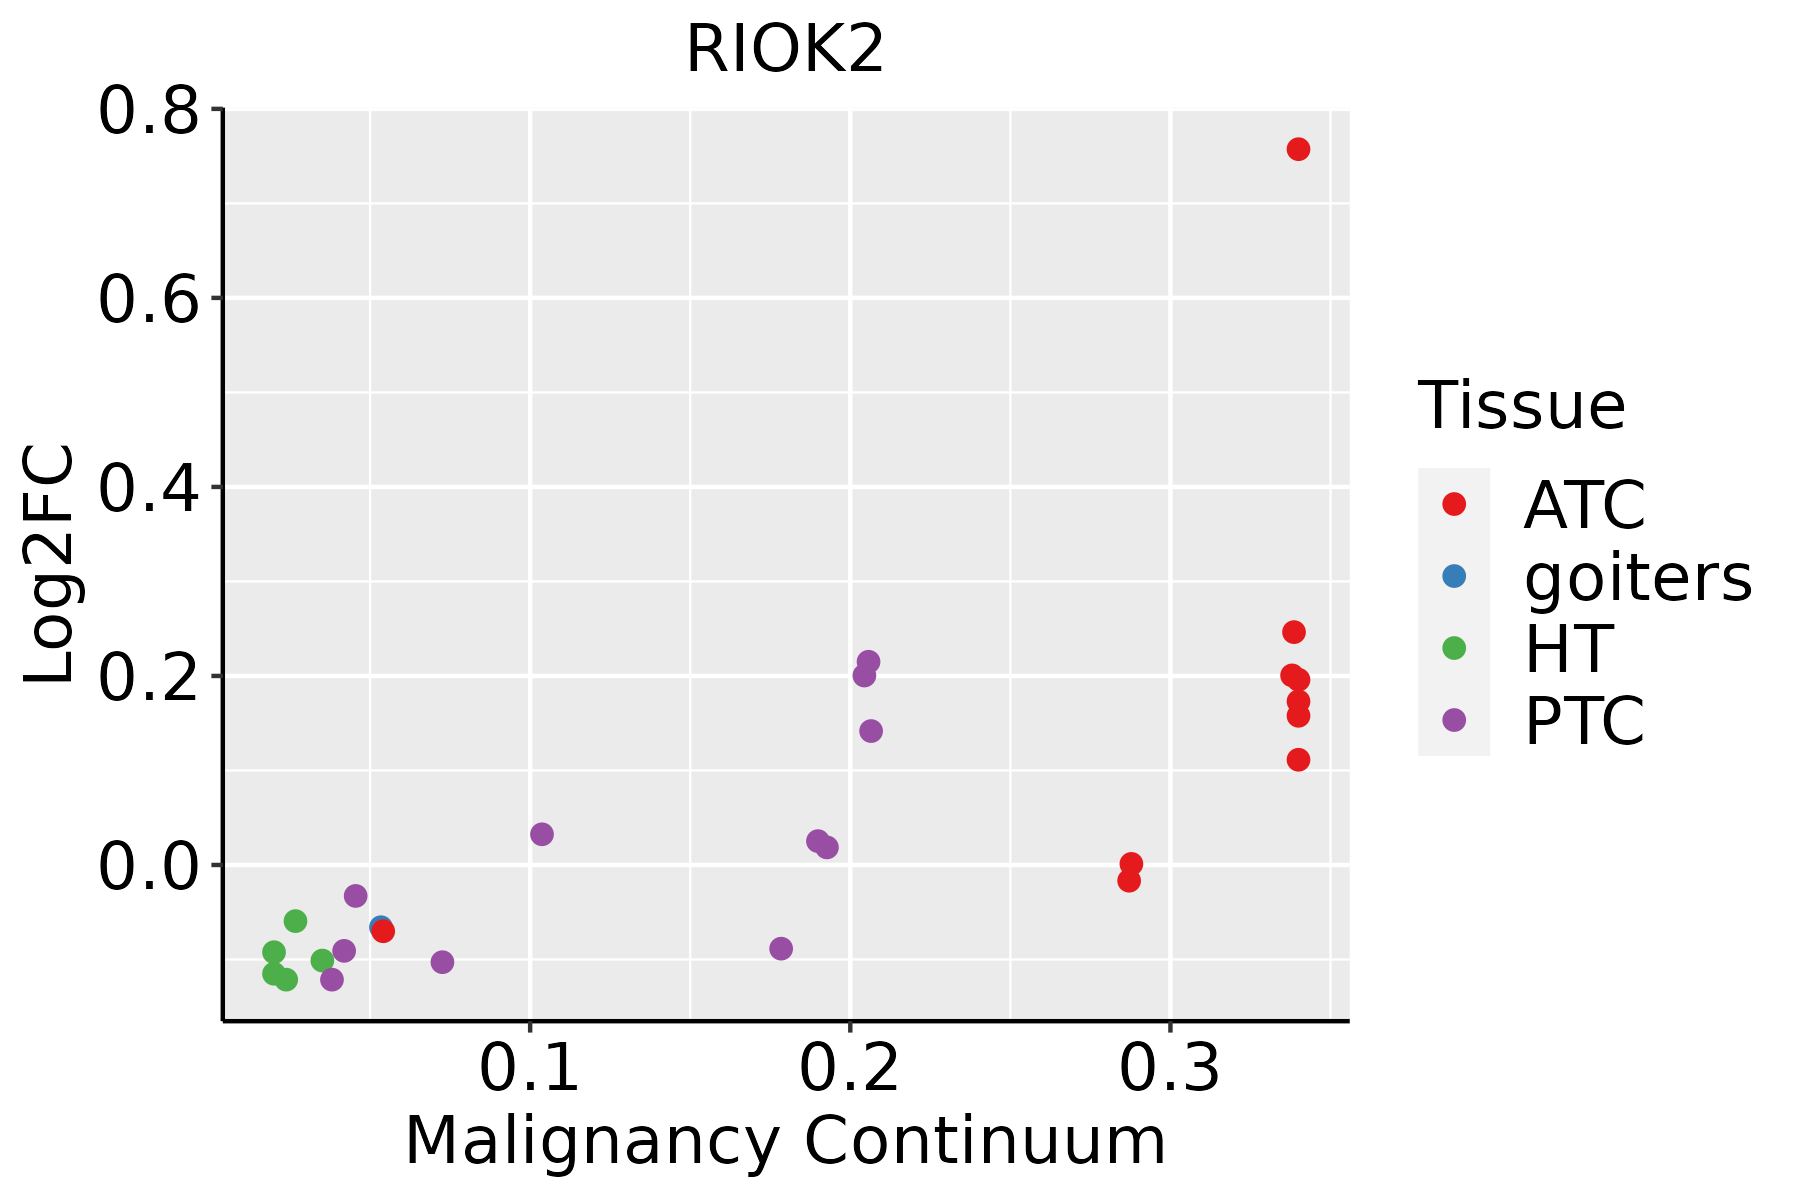 | ATC: Anaplastic thyroid cancer |
| HT: Hashimoto's thyroiditis | ||
| PTC: Papillary thyroid cancer |
| ∗log2FC in expression of this searched gene in stem-like cells from each diseased tissue sample relative to stem-like cells in normal samples in each tissue plotted against the malignancy continuum. Samples are colored based on if they are from different disease stage. |
Top |
Malignant transformation related pathway analysis |
| Find out the enriched GO biological processes and KEGG pathways involved in transition from healthy to precancer to cancer |
| Tissue | Disease Stage | Enriched GO biological Processes |
| Colorectum | AD |  |
| Colorectum | SER |  |
| Colorectum | MSS |  |
| Colorectum | MSI-H |  |
| Colorectum | FAP |  |
| ∗Top 15 enriched GO BP terms are showed in the bar plot of each disease state in each tissue. Each row represents a significant GO biological process which is colored according to the -log10(p.adjust). |
| Page: 1 2 3 4 5 6 7 8 9 |
| GO ID | Tissue | Disease Stage | Description | Gene Ratio | Bg Ratio | pvalue | p.adjust | Count |
| GO:004677710 | Esophagus | ESCC | protein autophosphorylation | 138/8552 | 227/18723 | 2.98e-06 | 3.38e-05 | 138 |
| GO:00513042 | Esophagus | ESCC | chromosome separation | 64/8552 | 96/18723 | 2.61e-05 | 2.20e-04 | 64 |
| GO:000005411 | Esophagus | ESCC | ribosomal subunit export from nucleus | 13/8552 | 14/18723 | 3.02e-04 | 1.81e-03 | 13 |
| GO:003375011 | Esophagus | ESCC | ribosome localization | 13/8552 | 14/18723 | 3.02e-04 | 1.81e-03 | 13 |
| GO:007142811 | Esophagus | ESCC | rRNA-containing ribonucleoprotein complex export from nucleus | 13/8552 | 15/18723 | 1.31e-03 | 6.26e-03 | 13 |
| GO:2000234 | Esophagus | ESCC | positive regulation of rRNA processing | 9/8552 | 10/18723 | 5.09e-03 | 1.92e-02 | 9 |
| GO:002261312 | Liver | Cirrhotic | ribonucleoprotein complex biogenesis | 231/4634 | 463/18723 | 3.28e-32 | 6.86e-29 | 231 |
| GO:004225412 | Liver | Cirrhotic | ribosome biogenesis | 154/4634 | 299/18723 | 1.18e-23 | 6.72e-21 | 154 |
| GO:000636412 | Liver | Cirrhotic | rRNA processing | 115/4634 | 225/18723 | 1.12e-17 | 1.64e-15 | 115 |
| GO:00160724 | Liver | Cirrhotic | rRNA metabolic process | 119/4634 | 236/18723 | 1.19e-17 | 1.70e-15 | 119 |
| GO:003238611 | Liver | Cirrhotic | regulation of intracellular transport | 147/4634 | 337/18723 | 1.84e-14 | 1.72e-12 | 147 |
| GO:00344701 | Liver | Cirrhotic | ncRNA processing | 158/4634 | 395/18723 | 1.09e-11 | 6.96e-10 | 158 |
| GO:003238811 | Liver | Cirrhotic | positive regulation of intracellular transport | 92/4634 | 202/18723 | 8.60e-11 | 4.66e-09 | 92 |
| GO:004227412 | Liver | Cirrhotic | ribosomal small subunit biogenesis | 42/4634 | 73/18723 | 2.34e-09 | 9.73e-08 | 42 |
| GO:000691312 | Liver | Cirrhotic | nucleocytoplasmic transport | 118/4634 | 301/18723 | 1.71e-08 | 6.27e-07 | 118 |
| GO:005116912 | Liver | Cirrhotic | nuclear transport | 118/4634 | 301/18723 | 1.71e-08 | 6.27e-07 | 118 |
| GO:00346603 | Liver | Cirrhotic | ncRNA metabolic process | 173/4634 | 485/18723 | 3.64e-08 | 1.21e-06 | 173 |
| GO:004682211 | Liver | Cirrhotic | regulation of nucleocytoplasmic transport | 51/4634 | 106/18723 | 1.54e-07 | 4.12e-06 | 51 |
| GO:005116812 | Liver | Cirrhotic | nuclear export | 67/4634 | 154/18723 | 2.57e-07 | 6.41e-06 | 67 |
| GO:003304411 | Liver | Cirrhotic | regulation of chromosome organization | 74/4634 | 187/18723 | 5.00e-06 | 8.18e-05 | 74 |
| Page: 1 2 3 4 5 6 7 8 9 10 11 12 13 |
| Pathway ID | Tissue | Disease Stage | Description | Gene Ratio | Bg Ratio | pvalue | p.adjust | qvalue | Count |
| Page: 1 |
Top |
Cell-cell communication analysis |
| Identification of potential cell-cell interactions between two cell types and their ligand-receptor pairs for different disease states |
| Ligand | Receptor | LRpair | Pathway | Tissue | Disease Stage |
| Page: 1 |
Top |
Single-cell gene regulatory network inference analysis |
| Find out the significant the regulons (TFs) and the target genes of each regulon across cell types for different disease states |
| TF | Cell Type | Tissue | Disease Stage | Target Gene | RSS | Regulon Activity |
| ∗The dot plots of a searched regulon are shown for all cell subpopulations in each disease state of each tissue based on the regulon specific score inferred using pySCENIC and by calculating the average expression. |
| Page: 1 |
Top |
Somatic mutation of malignant transformation related genes |
| Annotation of somatic variants for genes involved in malignant transformation |
| Hugo Symbol | Variant Class | Variant Classification | dbSNP RS | HGVSc | HGVSp | HGVSp Short | SWISSPROT | BIOTYPE | SIFT | PolyPhen | Tumor Sample Barcode | Tissue | Histology | Sex | Age | Stage | Therapy Types | Drugs | Outcome |
| RIOK2 | SNV | Missense_Mutation | c.703N>G | p.Ile235Val | p.I235V | Q9BVS4 | protein_coding | deleterious(0) | benign(0.314) | TCGA-A2-A0YF-01 | Breast | breast invasive carcinoma | Female | >=65 | I/II | Unspecific | Arimidex | SD | |
| RIOK2 | SNV | Missense_Mutation | c.377G>A | p.Arg126Lys | p.R126K | Q9BVS4 | protein_coding | deleterious(0) | probably_damaging(0.998) | TCGA-BH-A2L8-01 | Breast | breast invasive carcinoma | Female | <65 | I/II | Chemotherapy | cytoxan | CR | |
| RIOK2 | SNV | Missense_Mutation | c.1556N>A | p.Arg519His | p.R519H | Q9BVS4 | protein_coding | deleterious(0.03) | possibly_damaging(0.874) | TCGA-C5-A1BK-01 | Cervix | cervical & endocervical cancer | Female | <65 | I/II | Unknown | Unknown | SD | |
| RIOK2 | SNV | Missense_Mutation | novel | c.682G>T | p.Asp228Tyr | p.D228Y | Q9BVS4 | protein_coding | deleterious(0) | probably_damaging(1) | TCGA-IR-A3LA-01 | Cervix | cervical & endocervical cancer | Female | <65 | I/II | Chemotherapy | cisplatin | CR |
| RIOK2 | SNV | Missense_Mutation | c.775N>C | p.Glu259Gln | p.E259Q | Q9BVS4 | protein_coding | tolerated(0.15) | possibly_damaging(0.74) | TCGA-IR-A3LK-01 | Cervix | cervical & endocervical cancer | Female | >=65 | I/II | Chemotherapy | cisplatin | PD | |
| RIOK2 | SNV | Missense_Mutation | novel | c.46N>A | p.Asp16Asn | p.D16N | Q9BVS4 | protein_coding | deleterious(0.01) | probably_damaging(0.952) | TCGA-VS-A958-01 | Cervix | cervical & endocervical cancer | Female | <65 | I/II | Chemotherapy | cisplatin | CR |
| RIOK2 | SNV | Missense_Mutation | rs373094809 | c.1352N>G | p.His451Arg | p.H451R | Q9BVS4 | protein_coding | tolerated(0.16) | benign(0.021) | TCGA-A6-2686-01 | Colorectum | colon adenocarcinoma | Female | >=65 | I/II | Unknown | Unknown | SD |
| RIOK2 | SNV | Missense_Mutation | c.742C>T | p.Pro248Ser | p.P248S | Q9BVS4 | protein_coding | deleterious(0) | probably_damaging(0.999) | TCGA-AA-3492-01 | Colorectum | colon adenocarcinoma | Female | >=65 | I/II | Unknown | Unknown | SD | |
| RIOK2 | SNV | Missense_Mutation | c.1066C>T | p.Arg356Trp | p.R356W | Q9BVS4 | protein_coding | deleterious(0.03) | benign(0) | TCGA-AA-3845-01 | Colorectum | colon adenocarcinoma | Female | >=65 | I/II | Unknown | Unknown | PD | |
| RIOK2 | SNV | Missense_Mutation | novel | c.1064N>G | p.Glu355Gly | p.E355G | Q9BVS4 | protein_coding | tolerated(0.13) | benign(0.001) | TCGA-AA-3947-01 | Colorectum | colon adenocarcinoma | Female | <65 | I/II | Unknown | Unknown | SD |
| Page: 1 2 3 4 5 6 |
Top |
Related drugs of malignant transformation related genes |
| Identification of chemicals and drugs interact with genes involved in malignant transfromation |
| (DGIdb 4.0) |
| Entrez ID | Symbol | Category | Interaction Types | Drug Claim Name | Drug Name | PMIDs |
| Page: 1 |

Copyright 2023-Present -The University of Texas Health Science Center at Houston |