
|
|||||
|
 | |
| |
| |
| |
| |
| |
|
Gene: RHEX |
Gene summary for RHEX |
| Gene information | Species | Human | Gene symbol | RHEX | Gene ID | 440712 |
| Gene name | regulator of hemoglobinization and erythroid cell expansion | |
| Gene Alias | C1orf186 | |
| Cytomap | 1q32.1 | |
| Gene Type | protein-coding | GO ID | GO:0002262 | UniProtAcc | Q6ZWK4 |
Top |
Malignant transformation analysis |
| Identification of the aberrant gene expression in precancerous and cancerous lesions by comparing the gene expression of stem-like cells in diseased tissues with normal stem cells |
| Entrez ID | Symbol | Replicates | Species | Organ | Tissue | Adj P-value | Log2FC | Malignancy |
| 440712 | RHEX | CA_HPV_1 | Human | Cervix | CC | 9.60e-24 | -5.54e-01 | 0.0264 |
| 440712 | RHEX | CA_HPV_3 | Human | Cervix | CC | 2.49e-03 | -2.91e-01 | 0.0414 |
| 440712 | RHEX | N_HPV_2 | Human | Cervix | N_HPV | 1.41e-07 | -4.10e-01 | -0.0131 |
| 440712 | RHEX | CCII_1 | Human | Cervix | CC | 5.19e-11 | -6.11e-01 | 0.3249 |
| 440712 | RHEX | Tumor | Human | Cervix | CC | 1.05e-26 | -6.11e-01 | 0.1241 |
| 440712 | RHEX | sample1 | Human | Cervix | CC | 8.75e-07 | -6.00e-01 | 0.0959 |
| 440712 | RHEX | sample3 | Human | Cervix | CC | 1.36e-12 | -4.01e-01 | 0.1387 |
| 440712 | RHEX | H2 | Human | Cervix | HSIL_HPV | 5.94e-05 | -1.95e-01 | 0.0632 |
| 440712 | RHEX | L1 | Human | Cervix | CC | 3.29e-12 | -6.11e-01 | 0.0802 |
| 440712 | RHEX | T1 | Human | Cervix | CC | 3.09e-16 | -5.95e-01 | 0.0918 |
| 440712 | RHEX | T3 | Human | Cervix | CC | 3.68e-15 | -3.48e-01 | 0.1389 |
| 440712 | RHEX | AEH-subject1 | Human | Endometrium | AEH | 1.17e-141 | 1.99e+00 | -0.3059 |
| 440712 | RHEX | AEH-subject2 | Human | Endometrium | AEH | 4.49e-97 | 1.78e+00 | -0.2525 |
| 440712 | RHEX | AEH-subject3 | Human | Endometrium | AEH | 5.61e-129 | 1.90e+00 | -0.2576 |
| 440712 | RHEX | AEH-subject4 | Human | Endometrium | AEH | 1.16e-90 | 1.79e+00 | -0.2657 |
| 440712 | RHEX | AEH-subject5 | Human | Endometrium | AEH | 2.16e-146 | 2.15e+00 | -0.2953 |
| 440712 | RHEX | EEC-subject1 | Human | Endometrium | EEC | 5.60e-157 | 2.29e+00 | -0.2682 |
| 440712 | RHEX | EEC-subject2 | Human | Endometrium | EEC | 1.93e-158 | 2.10e+00 | -0.2607 |
| 440712 | RHEX | EEC-subject3 | Human | Endometrium | EEC | 1.03e-53 | 1.37e+00 | -0.2525 |
| 440712 | RHEX | EEC-subject4 | Human | Endometrium | EEC | 8.11e-109 | 1.82e+00 | -0.2571 |
| Page: 1 2 |
| Tissue | Expression Dynamics | Abbreviation |
| Cervix | 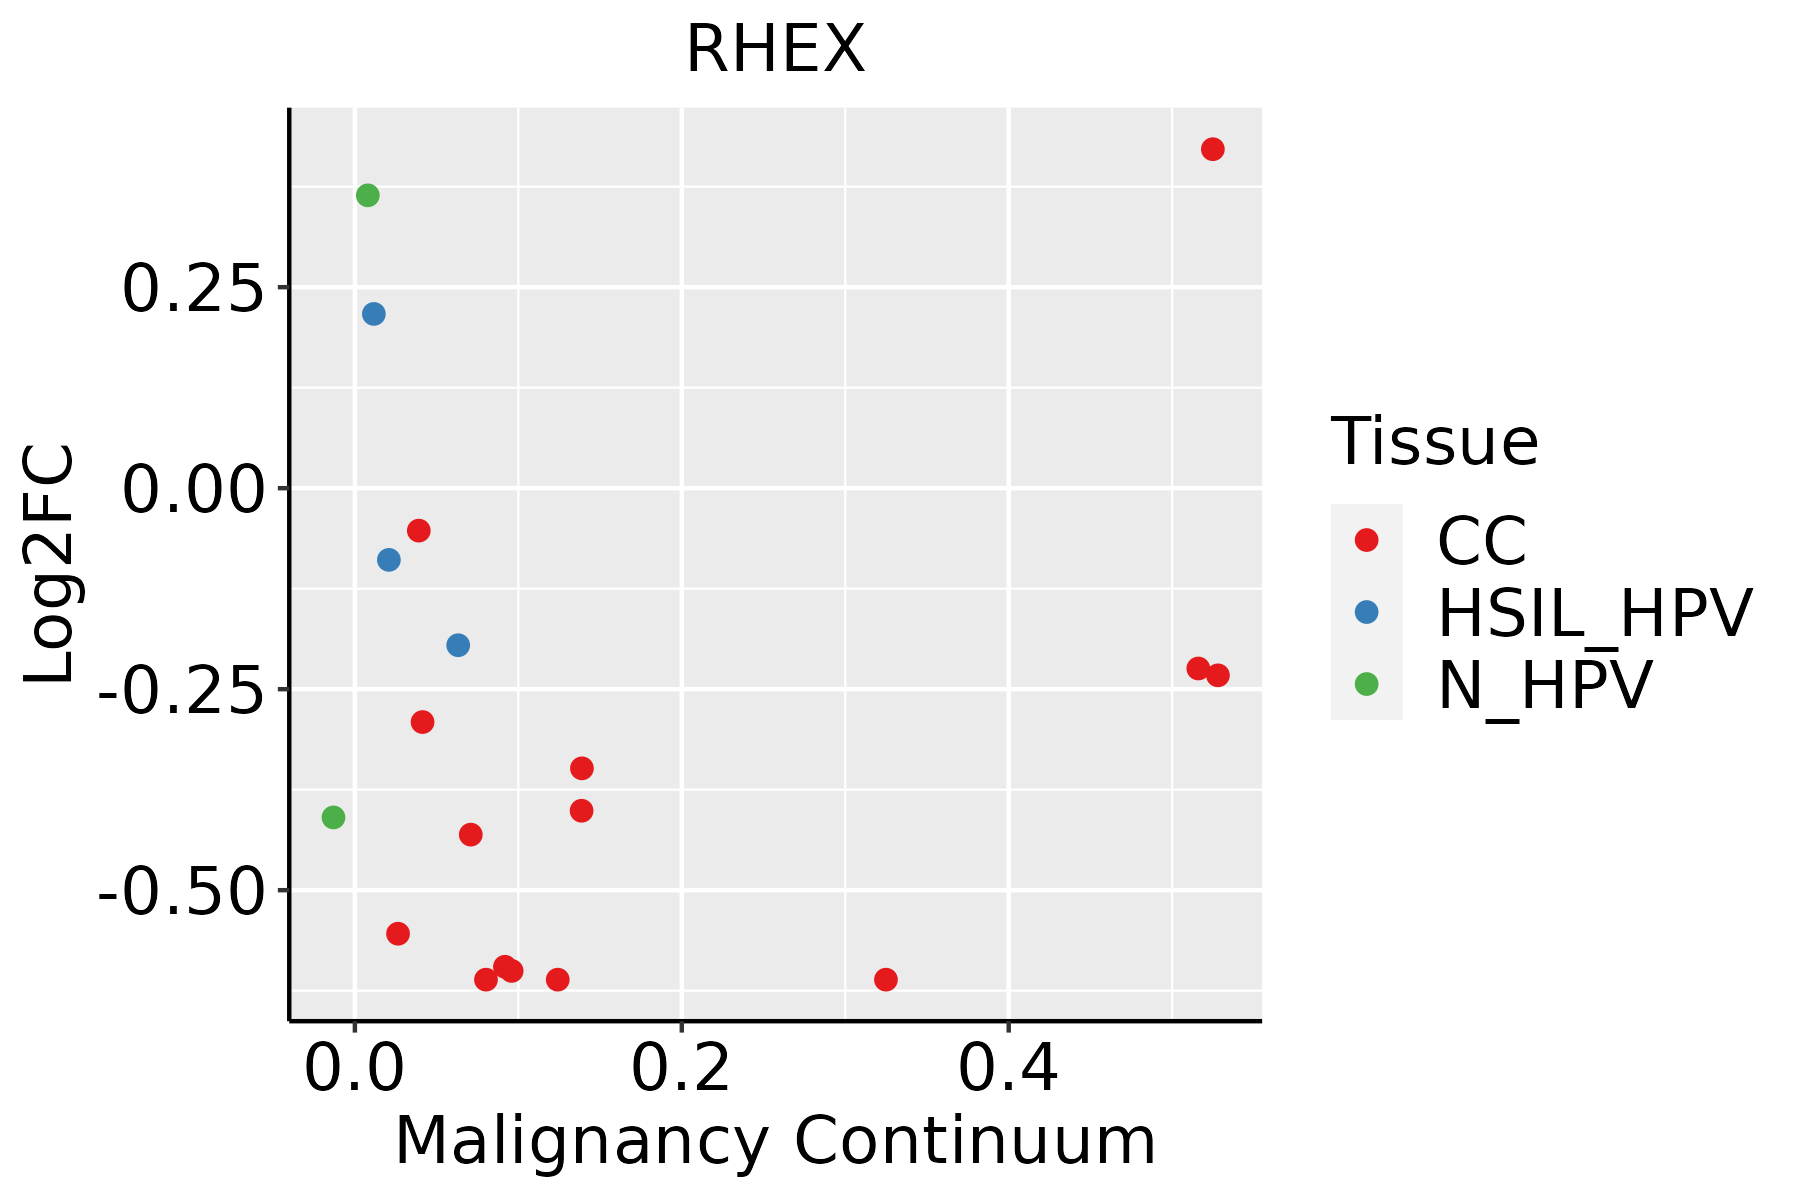 | CC: Cervix cancer |
| HSIL_HPV: HPV-infected high-grade squamous intraepithelial lesions | ||
| N_HPV: HPV-infected normal cervix | ||
| Endometrium |  | AEH: Atypical endometrial hyperplasia |
| EEC: Endometrioid Cancer | ||
| Oral Cavity | 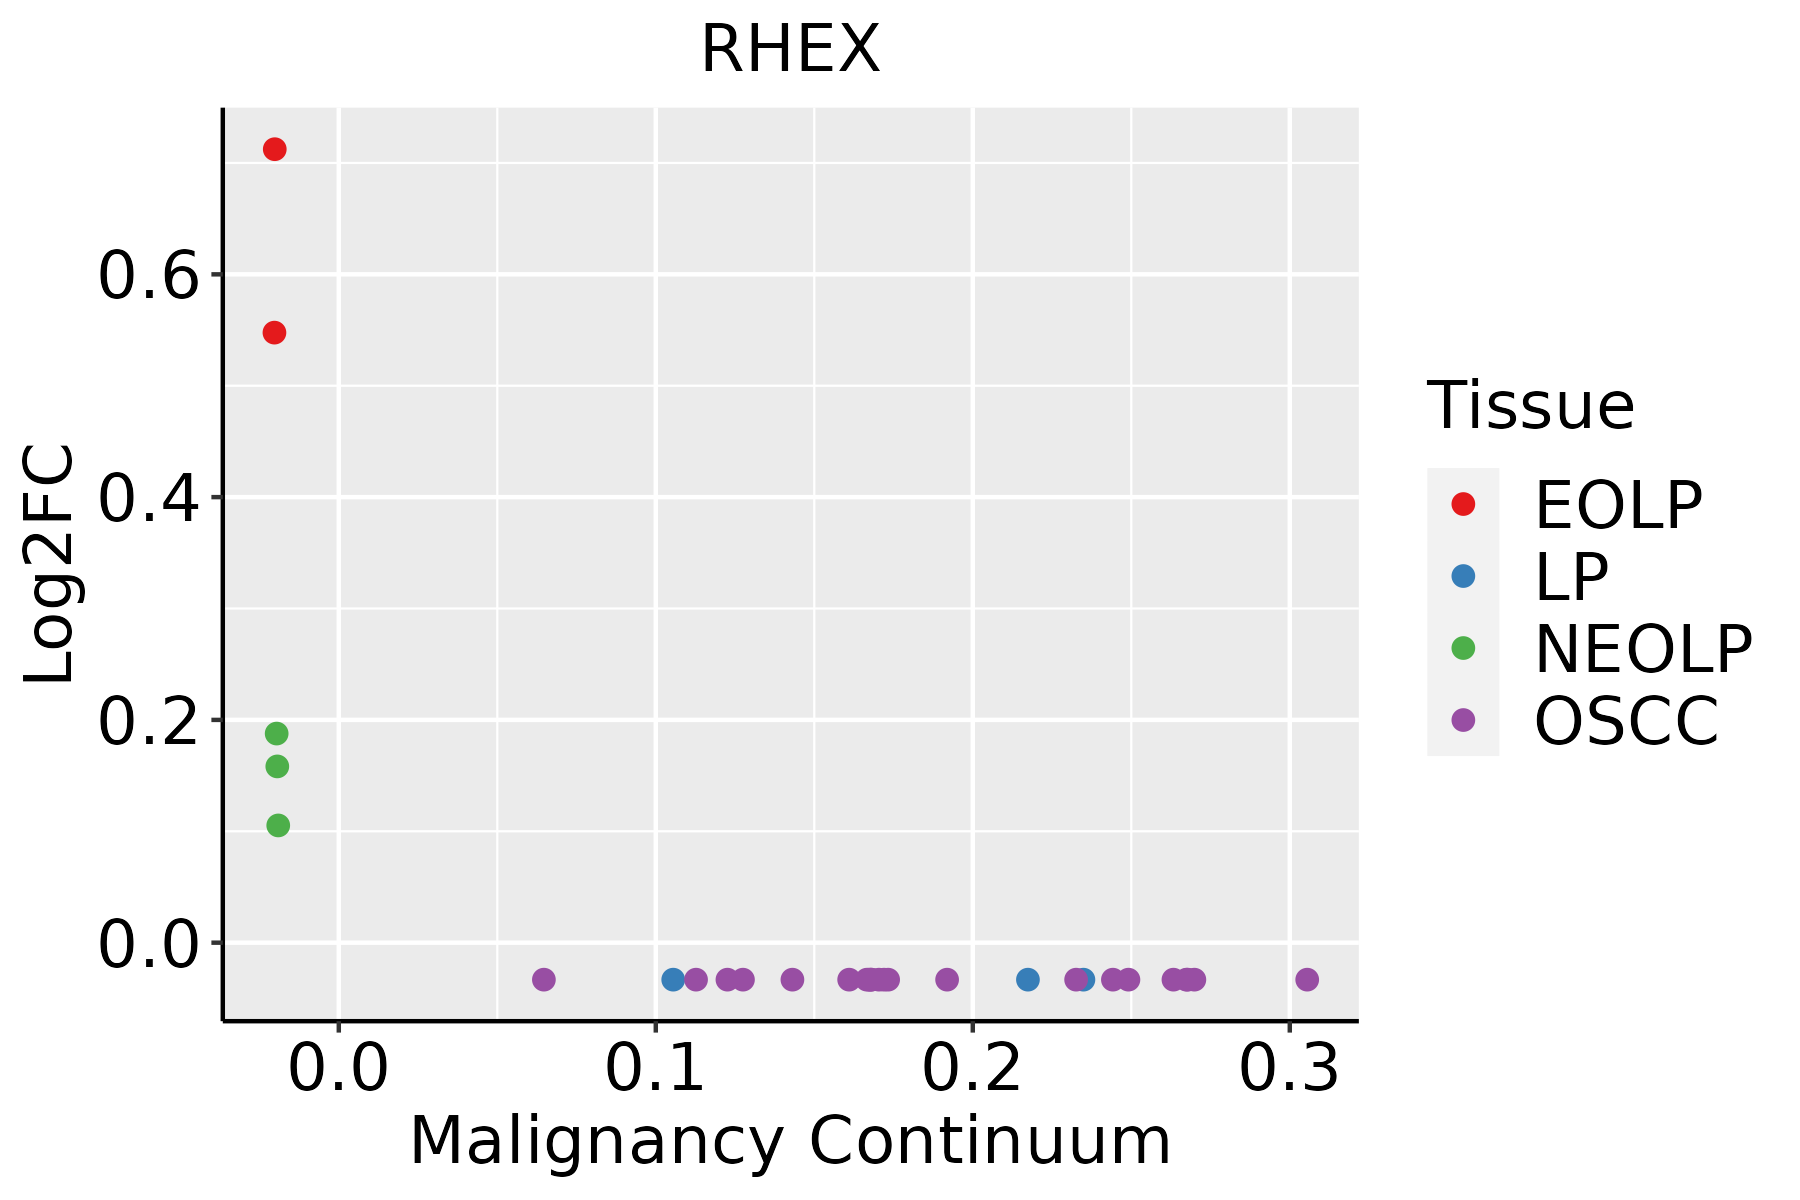 | EOLP: Erosive Oral lichen planus |
| LP: leukoplakia | ||
| NEOLP: Non-erosive oral lichen planus | ||
| OSCC: Oral squamous cell carcinoma |
| ∗log2FC in expression of this searched gene in stem-like cells from each diseased tissue sample relative to stem-like cells in normal samples in each tissue plotted against the malignancy continuum. Samples are colored based on if they are from different disease stage. |
Top |
Malignant transformation related pathway analysis |
| Find out the enriched GO biological processes and KEGG pathways involved in transition from healthy to precancer to cancer |
| Tissue | Disease Stage | Enriched GO biological Processes |
| Colorectum | AD |  |
| Colorectum | SER |  |
| Colorectum | MSS |  |
| Colorectum | MSI-H |  |
| Colorectum | FAP |  |
| ∗Top 15 enriched GO BP terms are showed in the bar plot of each disease state in each tissue. Each row represents a significant GO biological process which is colored according to the -log10(p.adjust). |
| Page: 1 2 3 4 5 6 7 8 9 |
| GO ID | Tissue | Disease Stage | Description | Gene Ratio | Bg Ratio | pvalue | p.adjust | Count |
| GO:004563716 | Endometrium | AEH | regulation of myeloid cell differentiation | 40/2100 | 210/18723 | 5.49e-04 | 5.52e-03 | 40 |
| GO:003009916 | Endometrium | AEH | myeloid cell differentiation | 62/2100 | 381/18723 | 1.67e-03 | 1.36e-02 | 62 |
| GO:00456484 | Endometrium | AEH | positive regulation of erythrocyte differentiation | 10/2100 | 33/18723 | 2.51e-03 | 1.87e-02 | 10 |
| GO:00456398 | Endometrium | AEH | positive regulation of myeloid cell differentiation | 21/2100 | 103/18723 | 4.69e-03 | 2.99e-02 | 21 |
| GO:004564615 | Endometrium | EEC | regulation of erythrocyte differentiation | 16/2168 | 47/18723 | 4.39e-05 | 7.16e-04 | 16 |
| GO:004887217 | Endometrium | EEC | homeostasis of number of cells | 53/2168 | 272/18723 | 9.52e-05 | 1.34e-03 | 53 |
| GO:000226217 | Endometrium | EEC | myeloid cell homeostasis | 35/2168 | 157/18723 | 9.62e-05 | 1.35e-03 | 35 |
| GO:190370615 | Endometrium | EEC | regulation of hemopoiesis | 67/2168 | 367/18723 | 1.01e-04 | 1.40e-03 | 67 |
| GO:003410117 | Endometrium | EEC | erythrocyte homeostasis | 30/2168 | 129/18723 | 1.33e-04 | 1.74e-03 | 30 |
| GO:004563717 | Endometrium | EEC | regulation of myeloid cell differentiation | 42/2168 | 210/18723 | 2.72e-04 | 3.09e-03 | 42 |
| GO:003021817 | Endometrium | EEC | erythrocyte differentiation | 27/2168 | 120/18723 | 4.93e-04 | 5.01e-03 | 27 |
| GO:003009917 | Endometrium | EEC | myeloid cell differentiation | 64/2168 | 381/18723 | 1.40e-03 | 1.14e-02 | 64 |
| GO:004564812 | Endometrium | EEC | positive regulation of erythrocyte differentiation | 10/2168 | 33/18723 | 3.18e-03 | 2.17e-02 | 10 |
| GO:004563914 | Endometrium | EEC | positive regulation of myeloid cell differentiation | 21/2168 | 103/18723 | 6.75e-03 | 3.93e-02 | 21 |
| GO:003009926 | Oral cavity | EOLP | myeloid cell differentiation | 91/2218 | 381/18723 | 2.87e-11 | 4.15e-09 | 91 |
| GO:000226226 | Oral cavity | EOLP | myeloid cell homeostasis | 49/2218 | 157/18723 | 7.93e-11 | 9.51e-09 | 49 |
| GO:190370624 | Oral cavity | EOLP | regulation of hemopoiesis | 85/2218 | 367/18723 | 6.61e-10 | 5.06e-08 | 85 |
| GO:004887226 | Oral cavity | EOLP | homeostasis of number of cells | 68/2218 | 272/18723 | 1.20e-09 | 8.27e-08 | 68 |
| GO:003410126 | Oral cavity | EOLP | erythrocyte homeostasis | 41/2218 | 129/18723 | 1.48e-09 | 9.76e-08 | 41 |
| GO:003021825 | Oral cavity | EOLP | erythrocyte differentiation | 37/2218 | 120/18723 | 2.29e-08 | 9.66e-07 | 37 |
| Page: 1 2 3 4 |
| Pathway ID | Tissue | Disease Stage | Description | Gene Ratio | Bg Ratio | pvalue | p.adjust | qvalue | Count |
| Page: 1 |
Top |
Cell-cell communication analysis |
| Identification of potential cell-cell interactions between two cell types and their ligand-receptor pairs for different disease states |
| Ligand | Receptor | LRpair | Pathway | Tissue | Disease Stage |
| Page: 1 |
Top |
Single-cell gene regulatory network inference analysis |
| Find out the significant the regulons (TFs) and the target genes of each regulon across cell types for different disease states |
| TF | Cell Type | Tissue | Disease Stage | Target Gene | RSS | Regulon Activity |
| ∗The dot plots of a searched regulon are shown for all cell subpopulations in each disease state of each tissue based on the regulon specific score inferred using pySCENIC and by calculating the average expression. |
| Page: 1 |
Top |
Somatic mutation of malignant transformation related genes |
| Annotation of somatic variants for genes involved in malignant transformation |
| Hugo Symbol | Variant Class | Variant Classification | dbSNP RS | HGVSc | HGVSp | HGVSp Short | SWISSPROT | BIOTYPE | SIFT | PolyPhen | Tumor Sample Barcode | Tissue | Histology | Sex | Age | Stage | Therapy Types | Drugs | Outcome |
| Page: 1 |
Top |
Related drugs of malignant transformation related genes |
| Identification of chemicals and drugs interact with genes involved in malignant transfromation |
| (DGIdb 4.0) |
| Entrez ID | Symbol | Category | Interaction Types | Drug Claim Name | Drug Name | PMIDs |
| Page: 1 |

Copyright 2023-Present -The University of Texas Health Science Center at Houston |