
|
|||||
|
 | |
| |
| |
| |
| |
| |
|
Gene: REXO4 |
Gene summary for REXO4 |
| Gene information | Species | Human | Gene symbol | REXO4 | Gene ID | 57109 |
| Gene name | REX4 homolog, 3'-5' exonuclease | |
| Gene Alias | REX4 | |
| Cytomap | 9q34.2 | |
| Gene Type | protein-coding | GO ID | GO:0000737 | UniProtAcc | B4E331 |
Top |
Malignant transformation analysis |
| Identification of the aberrant gene expression in precancerous and cancerous lesions by comparing the gene expression of stem-like cells in diseased tissues with normal stem cells |
| Entrez ID | Symbol | Replicates | Species | Organ | Tissue | Adj P-value | Log2FC | Malignancy |
| 57109 | REXO4 | LZE20T | Human | Esophagus | ESCC | 1.24e-06 | 2.27e-01 | 0.0662 |
| 57109 | REXO4 | LZE24T | Human | Esophagus | ESCC | 6.32e-12 | 3.29e-01 | 0.0596 |
| 57109 | REXO4 | P1T-E | Human | Esophagus | ESCC | 2.37e-02 | 1.78e-01 | 0.0875 |
| 57109 | REXO4 | P2T-E | Human | Esophagus | ESCC | 1.87e-25 | 4.47e-01 | 0.1177 |
| 57109 | REXO4 | P4T-E | Human | Esophagus | ESCC | 2.61e-07 | 2.35e-01 | 0.1323 |
| 57109 | REXO4 | P5T-E | Human | Esophagus | ESCC | 1.65e-07 | 1.75e-01 | 0.1327 |
| 57109 | REXO4 | P8T-E | Human | Esophagus | ESCC | 4.42e-22 | 3.93e-01 | 0.0889 |
| 57109 | REXO4 | P9T-E | Human | Esophagus | ESCC | 1.26e-06 | 1.51e-01 | 0.1131 |
| 57109 | REXO4 | P10T-E | Human | Esophagus | ESCC | 1.34e-17 | 2.57e-01 | 0.116 |
| 57109 | REXO4 | P11T-E | Human | Esophagus | ESCC | 1.26e-08 | 3.96e-01 | 0.1426 |
| 57109 | REXO4 | P12T-E | Human | Esophagus | ESCC | 5.56e-10 | 1.99e-01 | 0.1122 |
| 57109 | REXO4 | P15T-E | Human | Esophagus | ESCC | 1.99e-14 | 2.97e-01 | 0.1149 |
| 57109 | REXO4 | P16T-E | Human | Esophagus | ESCC | 9.12e-07 | 2.21e-01 | 0.1153 |
| 57109 | REXO4 | P17T-E | Human | Esophagus | ESCC | 5.95e-05 | 3.00e-01 | 0.1278 |
| 57109 | REXO4 | P20T-E | Human | Esophagus | ESCC | 3.83e-09 | 2.12e-01 | 0.1124 |
| 57109 | REXO4 | P21T-E | Human | Esophagus | ESCC | 9.86e-22 | 4.95e-01 | 0.1617 |
| 57109 | REXO4 | P22T-E | Human | Esophagus | ESCC | 4.75e-14 | 3.06e-01 | 0.1236 |
| 57109 | REXO4 | P23T-E | Human | Esophagus | ESCC | 1.46e-12 | 3.12e-01 | 0.108 |
| 57109 | REXO4 | P24T-E | Human | Esophagus | ESCC | 1.77e-18 | 3.78e-01 | 0.1287 |
| 57109 | REXO4 | P26T-E | Human | Esophagus | ESCC | 1.20e-14 | 2.58e-01 | 0.1276 |
| Page: 1 2 3 4 5 |
| Tissue | Expression Dynamics | Abbreviation |
| Esophagus | 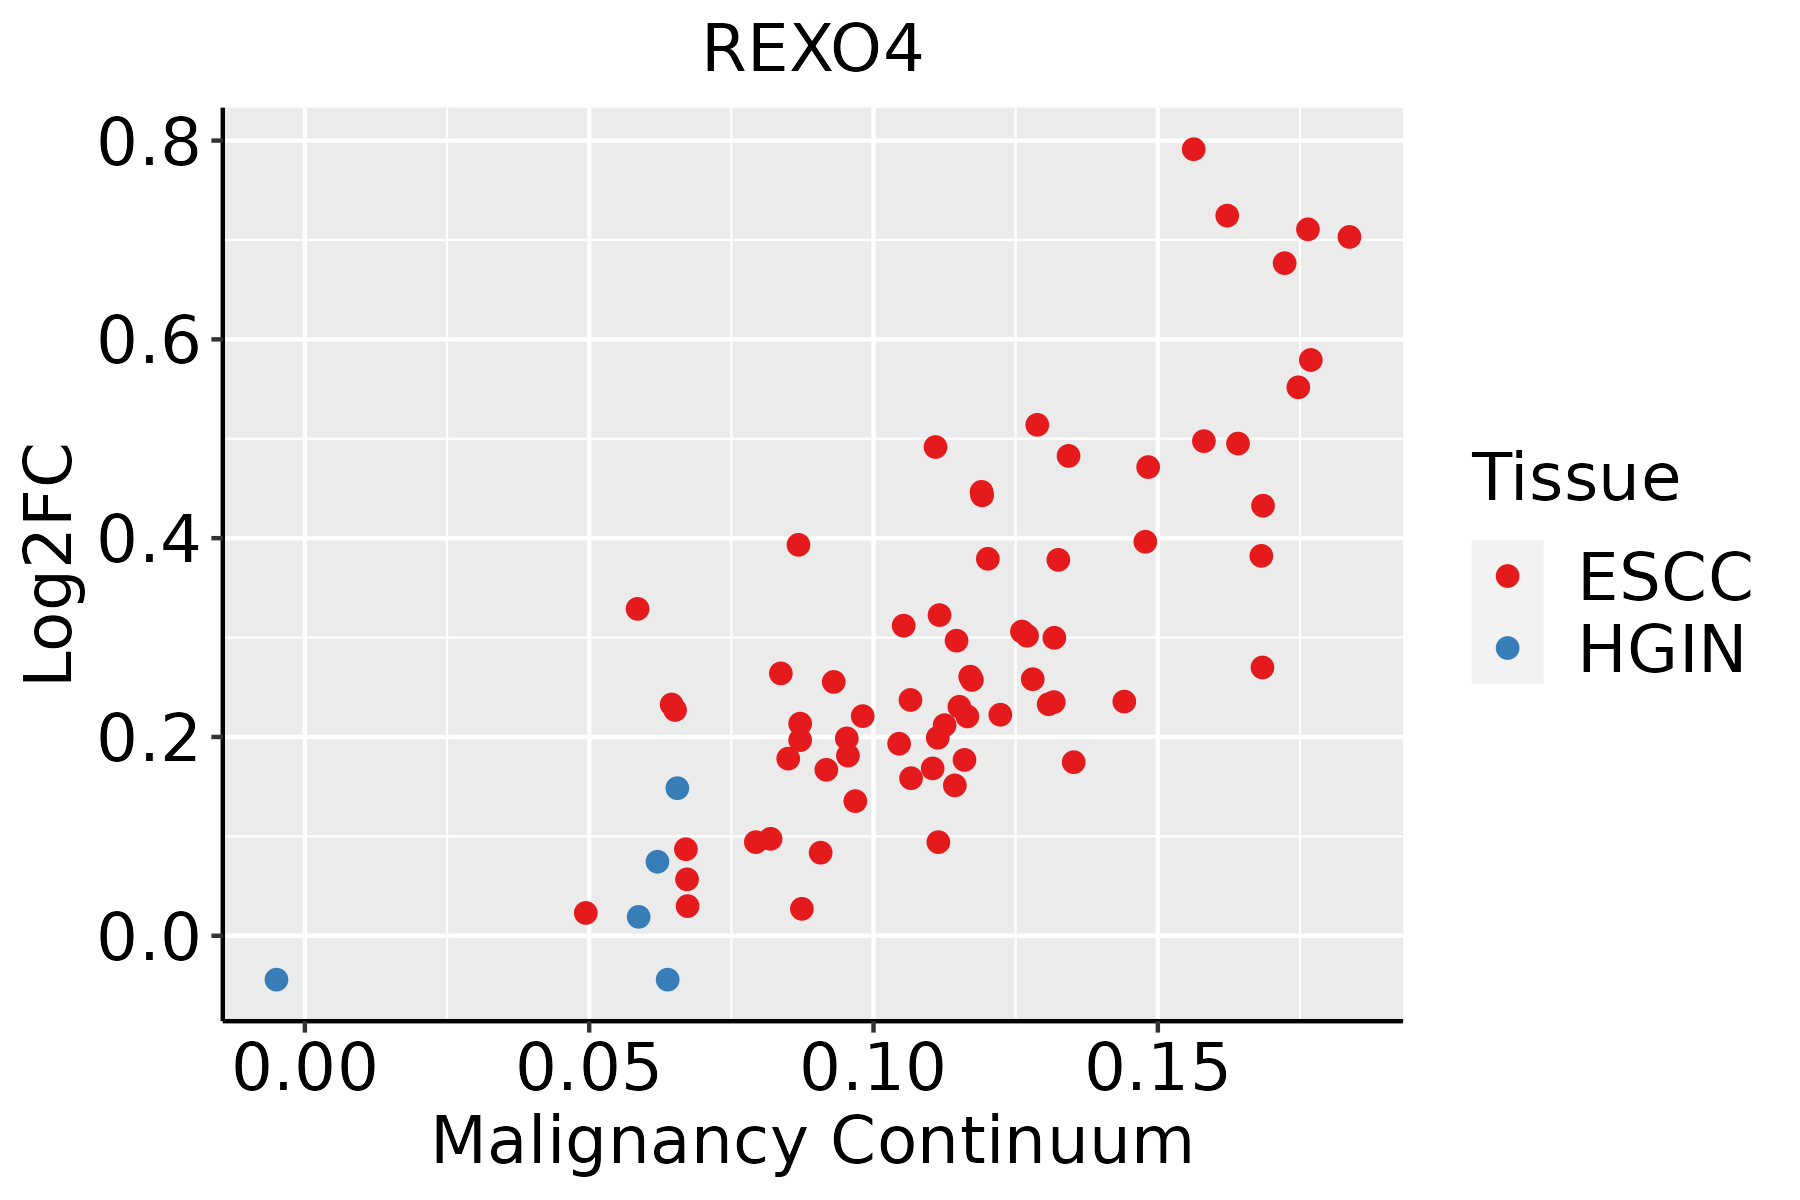 | ESCC: Esophageal squamous cell carcinoma |
| HGIN: High-grade intraepithelial neoplasias | ||
| LGIN: Low-grade intraepithelial neoplasias | ||
| Liver | 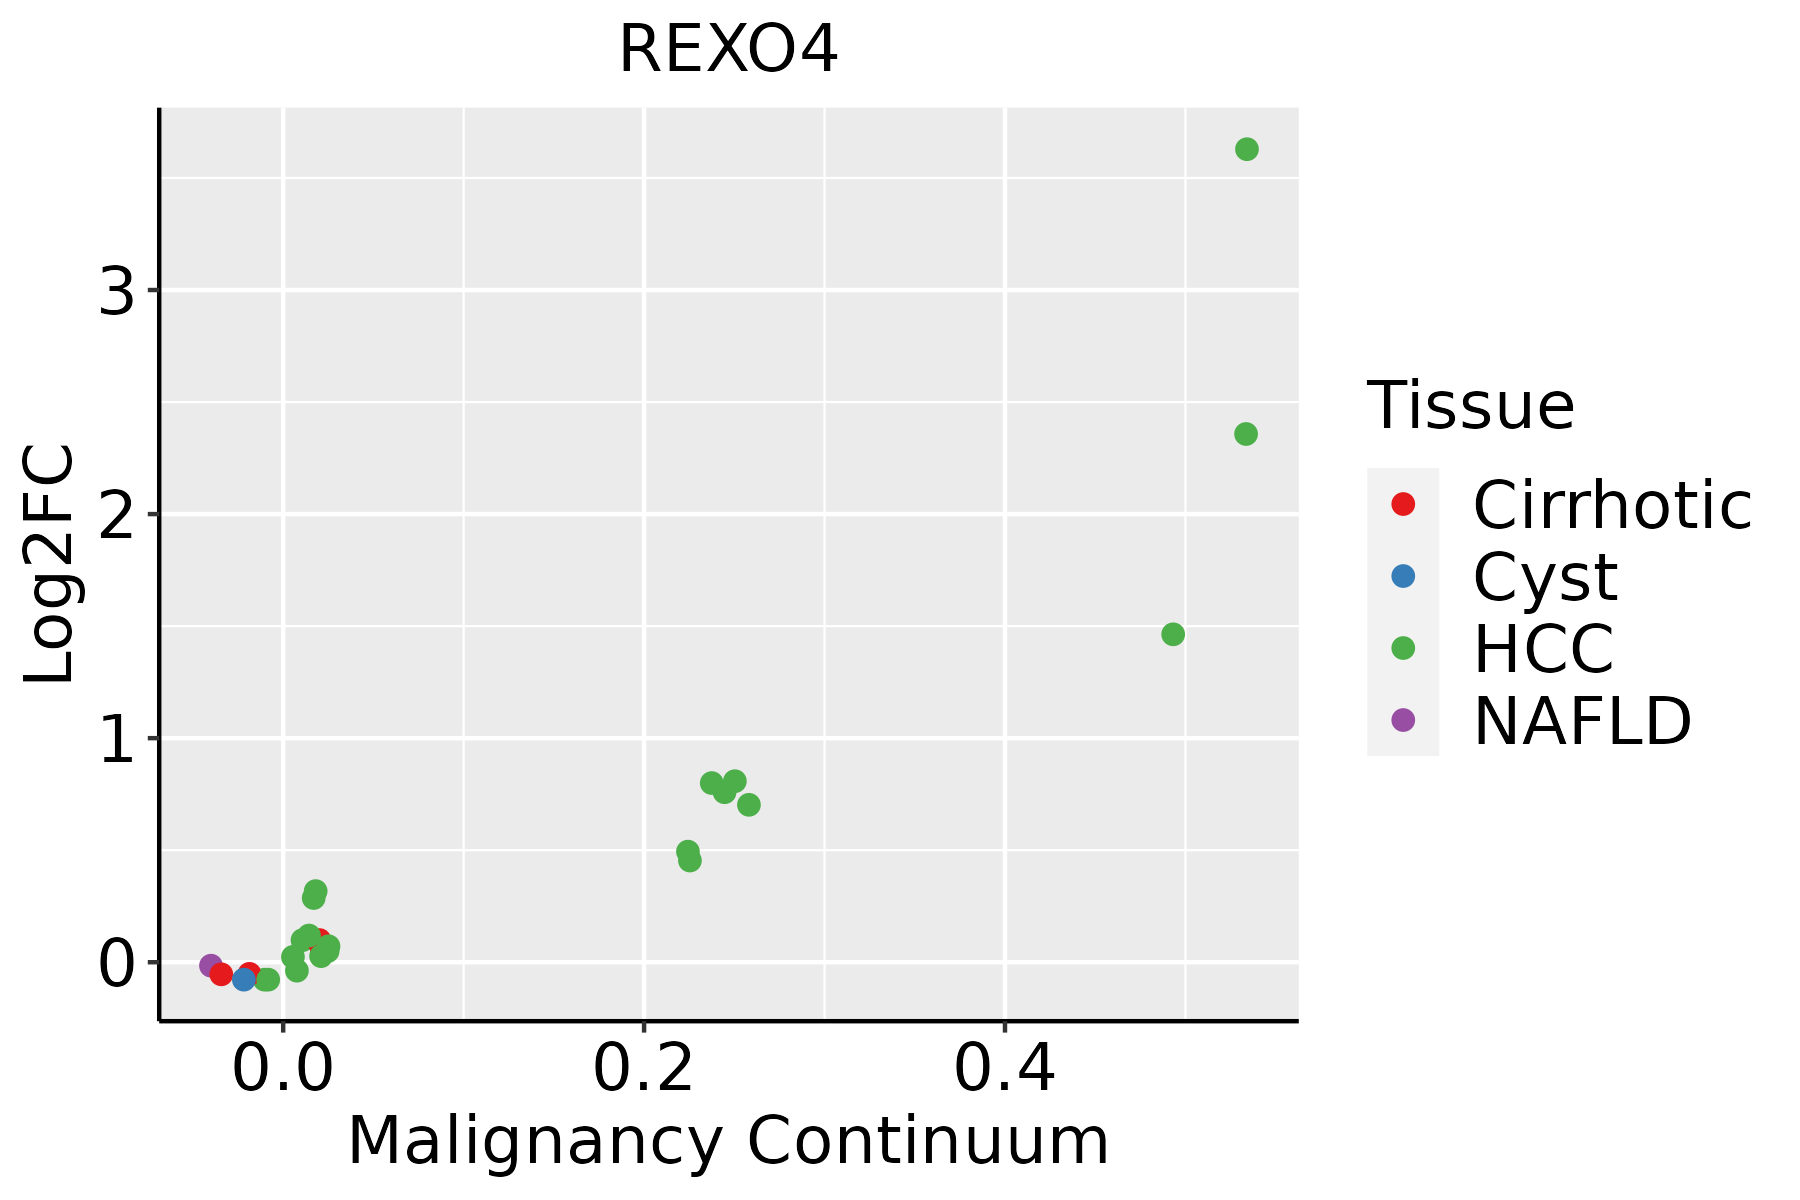 | HCC: Hepatocellular carcinoma |
| NAFLD: Non-alcoholic fatty liver disease | ||
| Oral Cavity |  | EOLP: Erosive Oral lichen planus |
| LP: leukoplakia | ||
| NEOLP: Non-erosive oral lichen planus | ||
| OSCC: Oral squamous cell carcinoma | ||
| Skin | 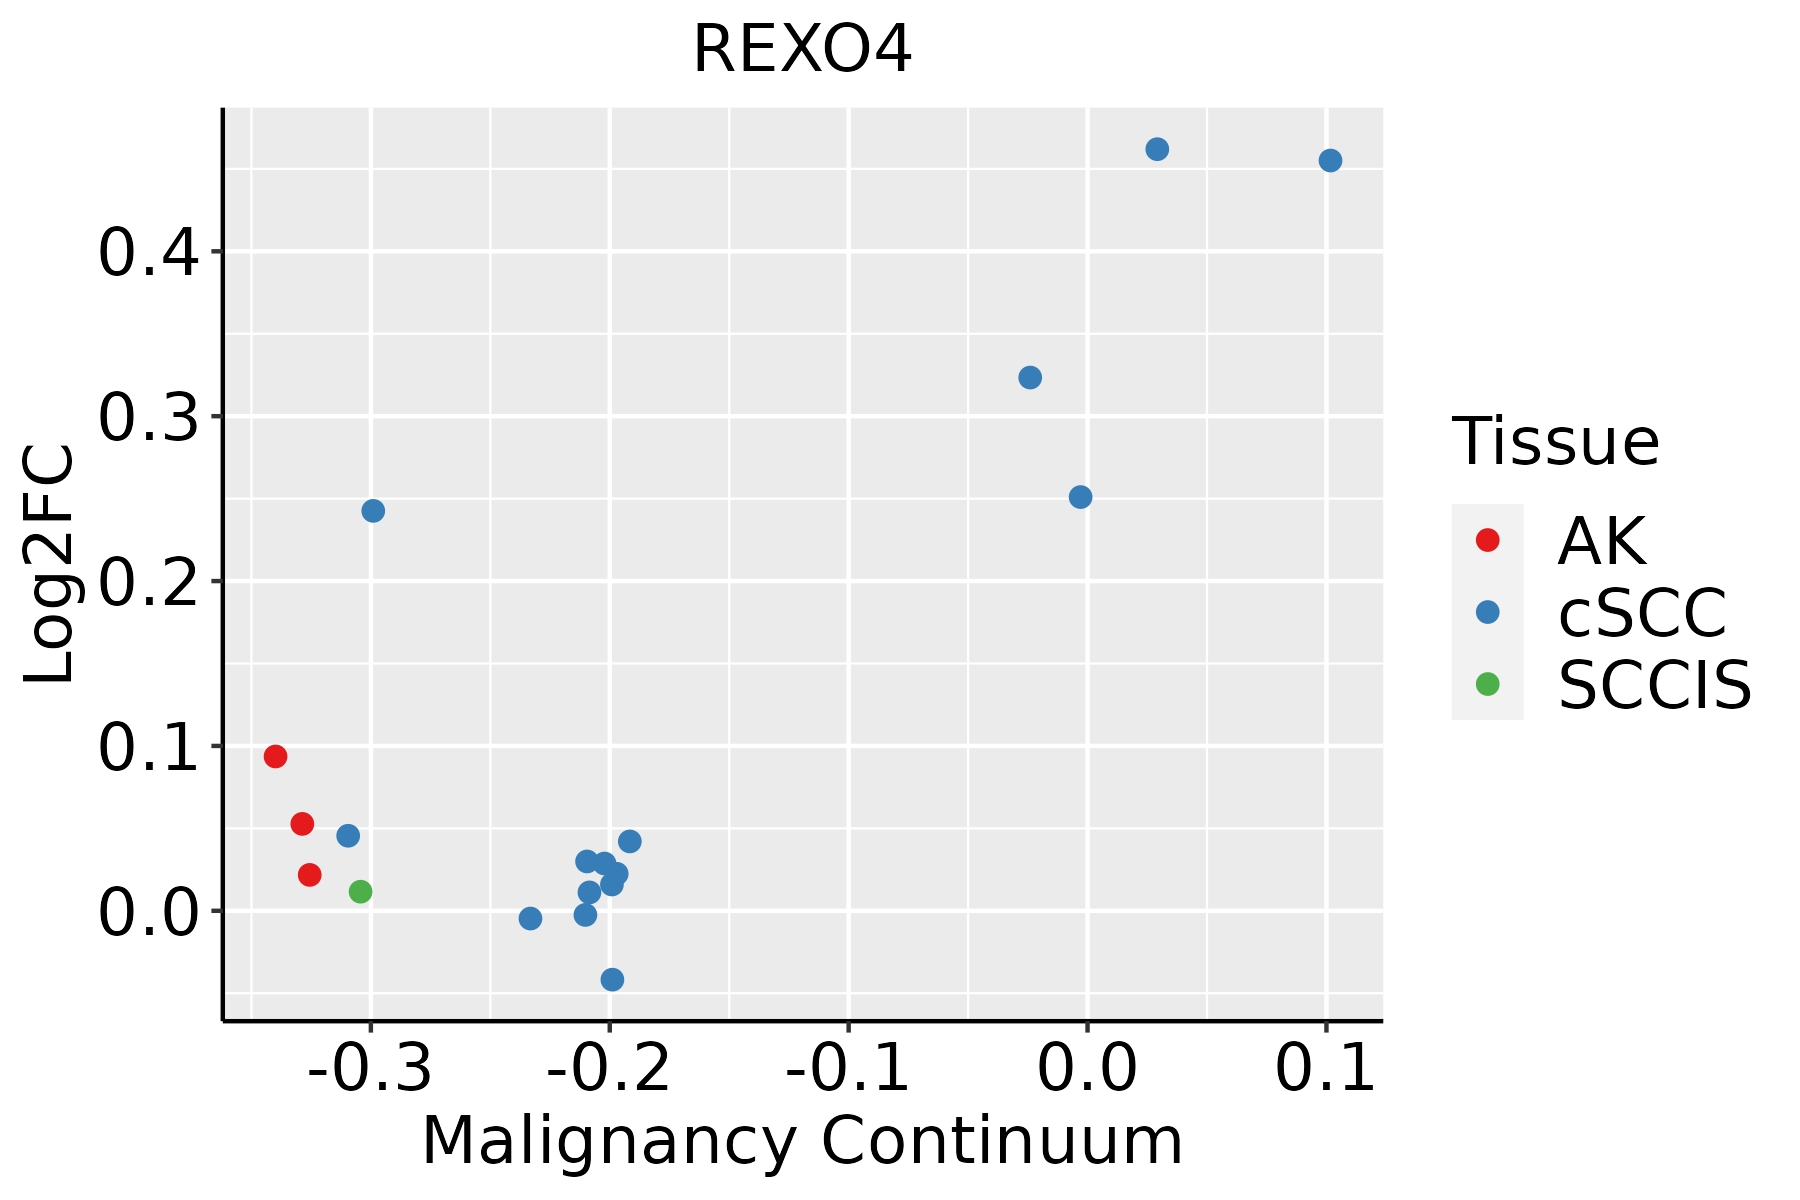 | AK: Actinic keratosis |
| cSCC: Cutaneous squamous cell carcinoma | ||
| SCCIS:squamous cell carcinoma in situ | ||
| Thyroid |  | ATC: Anaplastic thyroid cancer |
| HT: Hashimoto's thyroiditis | ||
| PTC: Papillary thyroid cancer |
| ∗log2FC in expression of this searched gene in stem-like cells from each diseased tissue sample relative to stem-like cells in normal samples in each tissue plotted against the malignancy continuum. Samples are colored based on if they are from different disease stage. |
Top |
Malignant transformation related pathway analysis |
| Find out the enriched GO biological processes and KEGG pathways involved in transition from healthy to precancer to cancer |
| Tissue | Disease Stage | Enriched GO biological Processes |
| Colorectum | AD |  |
| Colorectum | SER |  |
| Colorectum | MSS |  |
| Colorectum | MSI-H |  |
| Colorectum | FAP |  |
| ∗Top 15 enriched GO BP terms are showed in the bar plot of each disease state in each tissue. Each row represents a significant GO biological process which is colored according to the -log10(p.adjust). |
| Page: 1 2 3 4 5 6 7 8 9 |
| GO ID | Tissue | Disease Stage | Description | Gene Ratio | Bg Ratio | pvalue | p.adjust | Count |
| GO:003447017 | Skin | cSCC | ncRNA processing | 215/4864 | 395/18723 | 6.83e-34 | 4.28e-31 | 215 |
| GO:003466013 | Skin | cSCC | ncRNA metabolic process | 234/4864 | 485/18723 | 1.37e-26 | 4.77e-24 | 234 |
| GO:0034655111 | Skin | cSCC | nucleobase-containing compound catabolic process | 172/4864 | 407/18723 | 4.11e-13 | 2.43e-11 | 172 |
| GO:0046700110 | Skin | cSCC | heterocycle catabolic process | 178/4864 | 445/18723 | 4.45e-11 | 2.13e-09 | 178 |
| GO:0044270110 | Skin | cSCC | cellular nitrogen compound catabolic process | 179/4864 | 451/18723 | 8.34e-11 | 3.79e-09 | 179 |
| GO:0019439110 | Skin | cSCC | aromatic compound catabolic process | 183/4864 | 467/18723 | 1.76e-10 | 7.68e-09 | 183 |
| GO:1901361110 | Skin | cSCC | organic cyclic compound catabolic process | 188/4864 | 495/18723 | 1.92e-09 | 7.01e-08 | 188 |
| GO:00903054 | Skin | cSCC | nucleic acid phosphodiester bond hydrolysis | 97/4864 | 261/18723 | 4.08e-05 | 4.34e-04 | 97 |
| GO:0022613113 | Thyroid | PTC | ribonucleoprotein complex biogenesis | 292/5968 | 463/18723 | 3.24e-44 | 2.05e-40 | 292 |
| GO:0042254113 | Thyroid | PTC | ribosome biogenesis | 202/5968 | 299/18723 | 3.47e-37 | 5.47e-34 | 202 |
| GO:0006364112 | Thyroid | PTC | rRNA processing | 156/5968 | 225/18723 | 5.58e-31 | 5.03e-28 | 156 |
| GO:0016072112 | Thyroid | PTC | rRNA metabolic process | 160/5968 | 236/18723 | 5.68e-30 | 3.58e-27 | 160 |
| GO:003447018 | Thyroid | PTC | ncRNA processing | 215/5968 | 395/18723 | 7.14e-21 | 1.22e-18 | 215 |
| GO:0034655112 | Thyroid | PTC | nucleobase-containing compound catabolic process | 211/5968 | 407/18723 | 2.72e-17 | 2.52e-15 | 211 |
| GO:00346608 | Thyroid | PTC | ncRNA metabolic process | 239/5968 | 485/18723 | 5.54e-16 | 4.26e-14 | 239 |
| GO:0046700111 | Thyroid | PTC | heterocycle catabolic process | 221/5968 | 445/18723 | 2.43e-15 | 1.72e-13 | 221 |
| GO:0044270111 | Thyroid | PTC | cellular nitrogen compound catabolic process | 223/5968 | 451/18723 | 3.34e-15 | 2.31e-13 | 223 |
| GO:0019439111 | Thyroid | PTC | aromatic compound catabolic process | 225/5968 | 467/18723 | 8.51e-14 | 4.71e-12 | 225 |
| GO:1901361111 | Thyroid | PTC | organic cyclic compound catabolic process | 231/5968 | 495/18723 | 2.55e-12 | 1.12e-10 | 231 |
| GO:00903055 | Thyroid | PTC | nucleic acid phosphodiester bond hydrolysis | 105/5968 | 261/18723 | 2.53e-03 | 1.31e-02 | 105 |
| Page: 1 2 3 4 |
| Pathway ID | Tissue | Disease Stage | Description | Gene Ratio | Bg Ratio | pvalue | p.adjust | qvalue | Count |
| Page: 1 |
Top |
Cell-cell communication analysis |
| Identification of potential cell-cell interactions between two cell types and their ligand-receptor pairs for different disease states |
| Ligand | Receptor | LRpair | Pathway | Tissue | Disease Stage |
| Page: 1 |
Top |
Single-cell gene regulatory network inference analysis |
| Find out the significant the regulons (TFs) and the target genes of each regulon across cell types for different disease states |
| TF | Cell Type | Tissue | Disease Stage | Target Gene | RSS | Regulon Activity |
| ∗The dot plots of a searched regulon are shown for all cell subpopulations in each disease state of each tissue based on the regulon specific score inferred using pySCENIC and by calculating the average expression. |
| Page: 1 |
Top |
Somatic mutation of malignant transformation related genes |
| Annotation of somatic variants for genes involved in malignant transformation |
| Hugo Symbol | Variant Class | Variant Classification | dbSNP RS | HGVSc | HGVSp | HGVSp Short | SWISSPROT | BIOTYPE | SIFT | PolyPhen | Tumor Sample Barcode | Tissue | Histology | Sex | Age | Stage | Therapy Types | Drugs | Outcome |
| REXO4 | insertion | Frame_Shift_Ins | novel | c.414_415insAAAATACAAAAAATTA | p.Asp139LysfsTer23 | p.D139Kfs*23 | Q9GZR2 | protein_coding | TCGA-B6-A0IN-01 | Breast | breast invasive carcinoma | Female | <65 | I/II | Unknown | Unknown | PD | ||
| REXO4 | insertion | Frame_Shift_Ins | novel | c.412_413insAACCCCGTATCTAC | p.Met138LysfsTer76 | p.M138Kfs*76 | Q9GZR2 | protein_coding | TCGA-B6-A0IN-01 | Breast | breast invasive carcinoma | Female | <65 | I/II | Unknown | Unknown | PD | ||
| REXO4 | SNV | Missense_Mutation | rs377306235 | c.437N>A | p.Arg146His | p.R146H | Q9GZR2 | protein_coding | tolerated(0.21) | benign(0) | TCGA-2W-A8YY-01 | Cervix | cervical & endocervical cancer | Female | <65 | I/II | Chemotherapy | cisplatin | CR |
| REXO4 | SNV | Missense_Mutation | c.599N>G | p.Asp200Gly | p.D200G | Q9GZR2 | protein_coding | deleterious(0.02) | benign(0.263) | TCGA-AA-3715-01 | Colorectum | colon adenocarcinoma | Male | >=65 | I/II | Unknown | Unknown | PD | |
| REXO4 | SNV | Missense_Mutation | novel | c.425N>T | p.Ala142Val | p.A142V | Q9GZR2 | protein_coding | tolerated(0.53) | benign(0) | TCGA-AA-3949-01 | Colorectum | colon adenocarcinoma | Female | >=65 | III/IV | Unknown | Unknown | SD |
| REXO4 | SNV | Missense_Mutation | c.853N>T | p.Pro285Ser | p.P285S | Q9GZR2 | protein_coding | deleterious(0.04) | benign(0.18) | TCGA-AD-A5EK-01 | Colorectum | colon adenocarcinoma | Male | <65 | I/II | Unknown | Unknown | SD | |
| REXO4 | SNV | Missense_Mutation | c.1115T>G | p.Leu372Arg | p.L372R | Q9GZR2 | protein_coding | deleterious(0) | probably_damaging(0.996) | TCGA-AZ-4313-01 | Colorectum | colon adenocarcinoma | Female | <65 | I/II | Unknown | Unknown | SD | |
| REXO4 | SNV | Missense_Mutation | novel | c.1045A>G | p.Lys349Glu | p.K349E | Q9GZR2 | protein_coding | deleterious(0) | possibly_damaging(0.475) | TCGA-CA-6717-01 | Colorectum | colon adenocarcinoma | Male | <65 | I/II | Chemotherapy | oxaliplatin | CR |
| REXO4 | SNV | Missense_Mutation | novel | c.245N>A | p.Ser82Tyr | p.S82Y | Q9GZR2 | protein_coding | deleterious(0.01) | possibly_damaging(0.453) | TCGA-A5-A2K5-01 | Endometrium | uterine corpus endometrioid carcinoma | Female | >=65 | I/II | Unknown | Unknown | SD |
| REXO4 | SNV | Missense_Mutation | novel | c.613G>A | p.Glu205Lys | p.E205K | Q9GZR2 | protein_coding | deleterious(0) | probably_damaging(0.967) | TCGA-AP-A056-01 | Endometrium | uterine corpus endometrioid carcinoma | Female | <65 | I/II | Unknown | Unknown | SD |
| Page: 1 2 3 |
Top |
Related drugs of malignant transformation related genes |
| Identification of chemicals and drugs interact with genes involved in malignant transfromation |
| (DGIdb 4.0) |
| Entrez ID | Symbol | Category | Interaction Types | Drug Claim Name | Drug Name | PMIDs |
| Page: 1 |

Copyright 2023-Present -The University of Texas Health Science Center at Houston |