
|
|||||
|
 | |
| |
| |
| |
| |
| |
|
Gene: REG1A |
Gene summary for REG1A |
| Gene information | Species | Human | Gene symbol | REG1A | Gene ID | 5967 |
| Gene name | regenerating family member 1 alpha | |
| Gene Alias | ICRF | |
| Cytomap | 2p12 | |
| Gene Type | protein-coding | GO ID | GO:0000902 | UniProtAcc | A8K7G6 |
Top |
Malignant transformation analysis |
| Identification of the aberrant gene expression in precancerous and cancerous lesions by comparing the gene expression of stem-like cells in diseased tissues with normal stem cells |
| Entrez ID | Symbol | Replicates | Species | Organ | Tissue | Adj P-value | Log2FC | Malignancy |
| 5967 | REG1A | HTA11_3410_2000001011 | Human | Colorectum | AD | 1.65e-40 | 2.86e+00 | 0.0155 |
| 5967 | REG1A | HTA11_2951_2000001011 | Human | Colorectum | AD | 6.19e-26 | 2.79e+00 | 0.0216 |
| 5967 | REG1A | HTA11_3361_2000001011 | Human | Colorectum | AD | 9.47e-09 | 1.59e+00 | -0.1207 |
| 5967 | REG1A | HTA11_696_2000001011 | Human | Colorectum | AD | 2.00e-49 | 3.13e+00 | -0.1464 |
| 5967 | REG1A | HTA11_1391_2000001011 | Human | Colorectum | AD | 1.31e-58 | 4.67e+00 | -0.059 |
| 5967 | REG1A | HTA11_546_2000001011 | Human | Colorectum | AD | 6.13e-20 | 2.21e+00 | -0.0842 |
| 5967 | REG1A | HTA11_866_3004761011 | Human | Colorectum | AD | 5.47e-53 | 3.67e+00 | 0.096 |
| 5967 | REG1A | HTA11_7663_2000001011 | Human | Colorectum | SER | 1.10e-09 | 1.51e+00 | 0.0131 |
| 5967 | REG1A | HTA11_10711_2000001011 | Human | Colorectum | AD | 1.40e-35 | 2.37e+00 | 0.0338 |
| 5967 | REG1A | HTA11_7696_3000711011 | Human | Colorectum | AD | 5.15e-36 | 1.48e+00 | 0.0674 |
| 5967 | REG1A | HTA11_11156_2000001011 | Human | Colorectum | AD | 1.16e-02 | 2.25e+00 | 0.0397 |
| 5967 | REG1A | HTA11_99999970781_79442 | Human | Colorectum | MSS | 1.53e-38 | 9.14e-01 | 0.294 |
| 5967 | REG1A | HTA11_99999965062_69753 | Human | Colorectum | MSI-H | 6.23e-08 | 1.58e+00 | 0.3487 |
| 5967 | REG1A | HTA11_99999965104_69814 | Human | Colorectum | MSS | 1.22e-10 | 1.63e+00 | 0.281 |
| 5967 | REG1A | A002-C-010 | Human | Colorectum | FAP | 1.40e-04 | 3.22e-01 | 0.242 |
| 5967 | REG1A | S014 | Human | Liver | HCC | 1.29e-52 | 4.16e+00 | 0.2254 |
| 5967 | REG1A | S015 | Human | Liver | HCC | 1.17e-21 | 3.11e+00 | 0.2375 |
| 5967 | REG1A | S016 | Human | Liver | HCC | 8.26e-35 | 1.99e+00 | 0.2243 |
| 5967 | REG1A | HTA12-15-2 | Human | Pancreas | PDAC | 2.63e-53 | -2.83e+00 | 0.2315 |
| 5967 | REG1A | HTA12-16-2 | Human | Pancreas | PDAC | 1.98e-12 | -5.92e-01 | 0.0535 |
| Page: 1 2 3 4 |
| Tissue | Expression Dynamics | Abbreviation |
| Colorectum (GSE201348) |  | FAP: Familial adenomatous polyposis |
| CRC: Colorectal cancer | ||
| Colorectum (HTA11) |  | AD: Adenomas |
| SER: Sessile serrated lesions | ||
| MSI-H: Microsatellite-high colorectal cancer | ||
| MSS: Microsatellite stable colorectal cancer | ||
| GC | 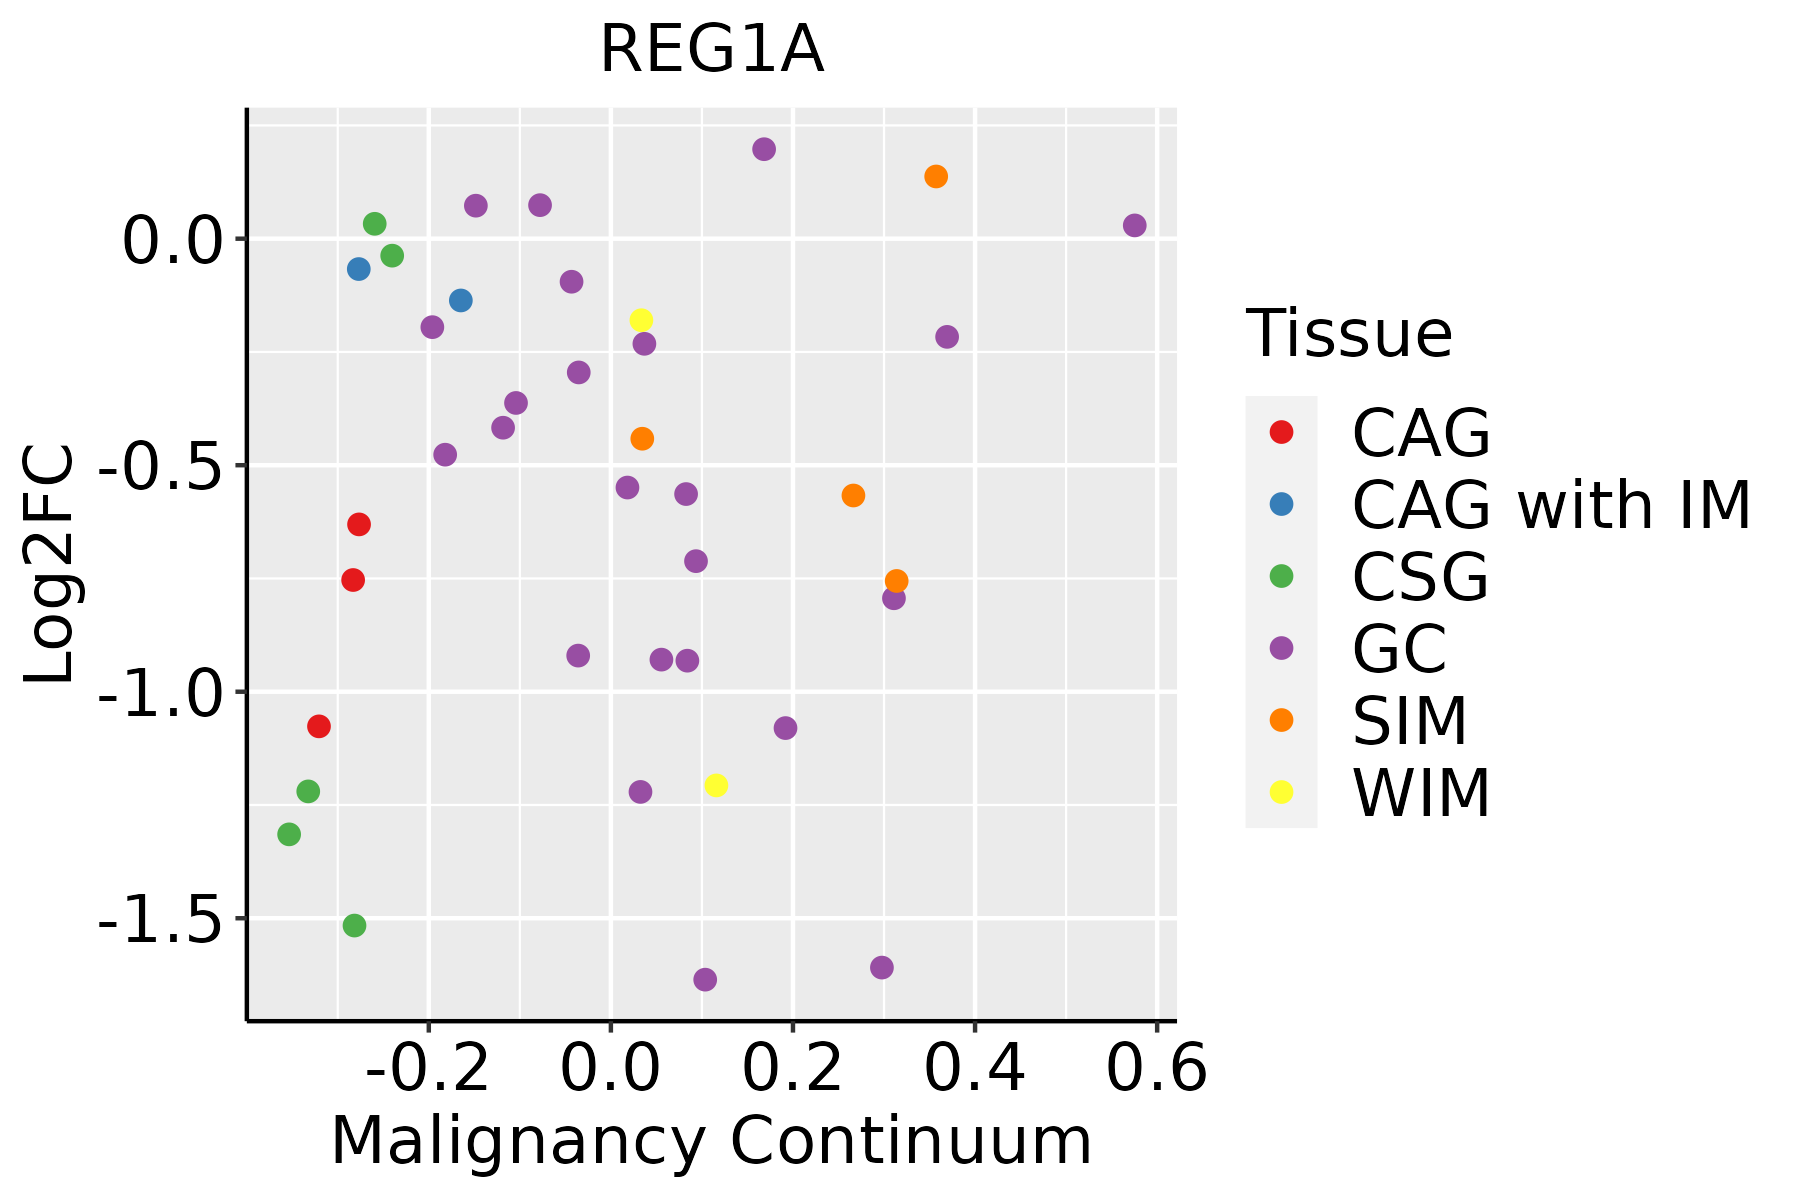 | CAG: Chronic atrophic gastritis |
| CAG with IM: Chronic atrophic gastritis with intestinal metaplasia | ||
| CSG: Chronic superficial gastritis | ||
| GC: Gastric cancer | ||
| SIM: Severe intestinal metaplasia | ||
| WIM: Wild intestinal metaplasia | ||
| Liver | 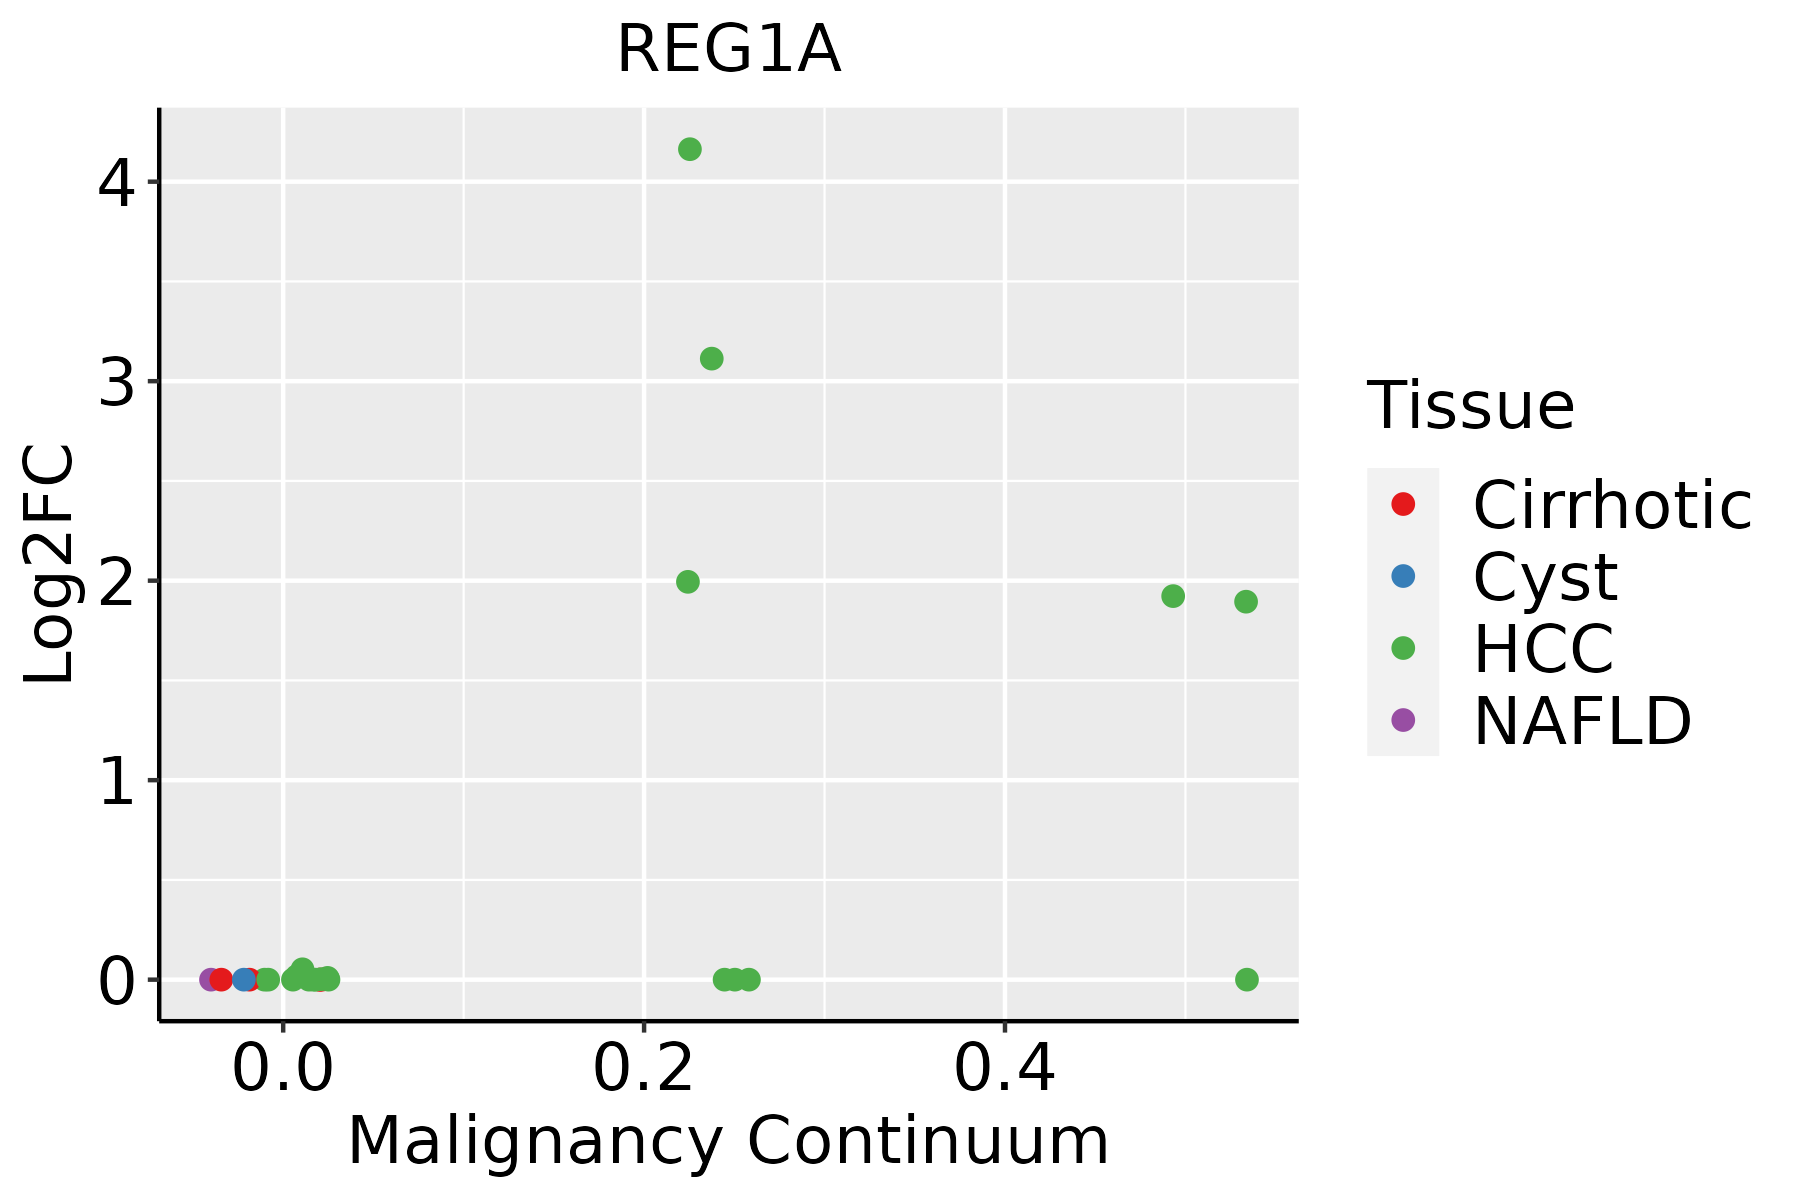 | HCC: Hepatocellular carcinoma |
| NAFLD: Non-alcoholic fatty liver disease |
| ∗log2FC in expression of this searched gene in stem-like cells from each diseased tissue sample relative to stem-like cells in normal samples in each tissue plotted against the malignancy continuum. Samples are colored based on if they are from different disease stage. |
Top |
Malignant transformation related pathway analysis |
| Find out the enriched GO biological processes and KEGG pathways involved in transition from healthy to precancer to cancer |
| Tissue | Disease Stage | Enriched GO biological Processes |
| Colorectum | AD |  |
| Colorectum | SER |  |
| Colorectum | MSS |  |
| Colorectum | MSI-H |  |
| Colorectum | FAP |  |
| ∗Top 15 enriched GO BP terms are showed in the bar plot of each disease state in each tissue. Each row represents a significant GO biological process which is colored according to the -log10(p.adjust). |
| Page: 1 2 3 4 5 6 7 8 9 |
| GO ID | Tissue | Disease Stage | Description | Gene Ratio | Bg Ratio | pvalue | p.adjust | Count |
| GO:00459271 | Colorectum | SER | positive regulation of growth | 56/2897 | 259/18723 | 5.10e-03 | 3.91e-02 | 56 |
| GO:00487322 | Colorectum | MSS | gland development | 143/3467 | 436/18723 | 3.85e-13 | 8.01e-11 | 143 |
| GO:00226042 | Colorectum | MSS | regulation of cell morphogenesis | 103/3467 | 309/18723 | 2.70e-10 | 2.56e-08 | 103 |
| GO:00420602 | Colorectum | MSS | wound healing | 119/3467 | 422/18723 | 5.93e-07 | 2.24e-05 | 119 |
| GO:00610082 | Colorectum | MSS | hepaticobiliary system development | 51/3467 | 150/18723 | 4.33e-06 | 1.23e-04 | 51 |
| GO:00018892 | Colorectum | MSS | liver development | 50/3467 | 147/18723 | 5.28e-06 | 1.44e-04 | 50 |
| GO:00316672 | Colorectum | MSS | response to nutrient levels | 125/3467 | 474/18723 | 1.24e-05 | 2.88e-04 | 125 |
| GO:00160492 | Colorectum | MSS | cell growth | 123/3467 | 482/18723 | 7.15e-05 | 1.21e-03 | 123 |
| GO:00974212 | Colorectum | MSS | liver regeneration | 16/3467 | 35/18723 | 2.07e-04 | 2.89e-03 | 16 |
| GO:00015582 | Colorectum | MSS | regulation of cell growth | 105/3467 | 414/18723 | 2.97e-04 | 3.90e-03 | 105 |
| GO:00434342 | Colorectum | MSS | response to peptide hormone | 104/3467 | 414/18723 | 4.58e-04 | 5.43e-03 | 104 |
| GO:00506731 | Colorectum | MSS | epithelial cell proliferation | 108/3467 | 437/18723 | 6.76e-04 | 7.30e-03 | 108 |
| GO:19016532 | Colorectum | MSS | cellular response to peptide | 91/3467 | 359/18723 | 7.38e-04 | 7.88e-03 | 91 |
| GO:00486381 | Colorectum | MSS | regulation of developmental growth | 84/3467 | 330/18723 | 1.01e-03 | 1.01e-02 | 84 |
| GO:00713752 | Colorectum | MSS | cellular response to peptide hormone stimulus | 75/3467 | 290/18723 | 1.14e-03 | 1.12e-02 | 75 |
| GO:00486391 | Colorectum | MSS | positive regulation of developmental growth | 49/3467 | 174/18723 | 1.17e-03 | 1.13e-02 | 49 |
| GO:00358211 | Colorectum | MSS | modulation of process of other organism | 33/3467 | 106/18723 | 1.18e-03 | 1.14e-02 | 33 |
| GO:00459272 | Colorectum | MSS | positive regulation of growth | 68/3467 | 259/18723 | 1.24e-03 | 1.19e-02 | 68 |
| GO:00303072 | Colorectum | MSS | positive regulation of cell growth | 47/3467 | 166/18723 | 1.29e-03 | 1.23e-02 | 47 |
| GO:00311001 | Colorectum | MSS | animal organ regeneration | 25/3467 | 76/18723 | 1.91e-03 | 1.66e-02 | 25 |
| Page: 1 2 3 4 5 6 7 8 9 10 11 |
| Pathway ID | Tissue | Disease Stage | Description | Gene Ratio | Bg Ratio | pvalue | p.adjust | qvalue | Count |
| Page: 1 |
Top |
Cell-cell communication analysis |
| Identification of potential cell-cell interactions between two cell types and their ligand-receptor pairs for different disease states |
| Ligand | Receptor | LRpair | Pathway | Tissue | Disease Stage |
| Page: 1 |
Top |
Single-cell gene regulatory network inference analysis |
| Find out the significant the regulons (TFs) and the target genes of each regulon across cell types for different disease states |
| TF | Cell Type | Tissue | Disease Stage | Target Gene | RSS | Regulon Activity |
| ∗The dot plots of a searched regulon are shown for all cell subpopulations in each disease state of each tissue based on the regulon specific score inferred using pySCENIC and by calculating the average expression. |
| Page: 1 |
Top |
Somatic mutation of malignant transformation related genes |
| Annotation of somatic variants for genes involved in malignant transformation |
| Hugo Symbol | Variant Class | Variant Classification | dbSNP RS | HGVSc | HGVSp | HGVSp Short | SWISSPROT | BIOTYPE | SIFT | PolyPhen | Tumor Sample Barcode | Tissue | Histology | Sex | Age | Stage | Therapy Types | Drugs | Outcome |
| REG1A | SNV | Missense_Mutation | c.320N>C | p.Lys107Thr | p.K107T | P05451 | protein_coding | tolerated(0.37) | benign(0.003) | TCGA-BH-A0HY-01 | Breast | breast invasive carcinoma | Female | <65 | I/II | Hormone Therapy | taxotere | CR | |
| REG1A | SNV | Missense_Mutation | rs544706237 | c.152N>T | p.Asn51Ile | p.N51I | P05451 | protein_coding | tolerated(0.22) | benign(0.01) | TCGA-BH-A0WA-01 | Breast | breast invasive carcinoma | Female | >=65 | I/II | Unknown | Unknown | SD |
| REG1A | insertion | Nonsense_Mutation | novel | c.174_175insAATCTTTAAATTTAAATGA | p.Asp59AsnfsTer3 | p.D59Nfs*3 | P05451 | protein_coding | TCGA-A8-A07J-01 | Breast | breast invasive carcinoma | Female | <65 | I/II | Chemotherapy | 5-fluorouracil | CR | ||
| REG1A | deletion | Frame_Shift_Del | novel | c.375delN | p.Ile126LeufsTer13 | p.I126Lfs*13 | P05451 | protein_coding | TCGA-EW-A2FV-01 | Breast | breast invasive carcinoma | Female | <65 | III/IV | Chemotherapy | docetaxel | SD | ||
| REG1A | SNV | Missense_Mutation | rs773643336 | c.326N>A | p.Arg109His | p.R109H | P05451 | protein_coding | tolerated(0.42) | benign(0.001) | TCGA-C5-A1BM-01 | Cervix | cervical & endocervical cancer | Female | >=65 | I/II | Unknown | Unknown | SD |
| REG1A | SNV | Missense_Mutation | rs758319248 | c.130C>G | p.Arg44Gly | p.R44G | P05451 | protein_coding | tolerated(1) | benign(0) | TCGA-DS-A1OB-01 | Cervix | cervical & endocervical cancer | Female | <65 | I/II | Chemotherapy | carboplatin | PD |
| REG1A | SNV | Missense_Mutation | rs765761645 | c.428N>A | p.Ser143Asn | p.S143N | P05451 | protein_coding | tolerated(0.69) | benign(0) | TCGA-EA-A3HS-01 | Cervix | cervical & endocervical cancer | Female | <65 | I/II | Unknown | Unknown | SD |
| REG1A | SNV | Missense_Mutation | c.163N>A | p.Glu55Lys | p.E55K | P05451 | protein_coding | tolerated(1) | benign(0.304) | TCGA-IR-A3LK-01 | Cervix | cervical & endocervical cancer | Female | >=65 | I/II | Chemotherapy | cisplatin | PD | |
| REG1A | SNV | Missense_Mutation | c.359N>T | p.Ser120Phe | p.S120F | P05451 | protein_coding | deleterious(0.01) | possibly_damaging(0.641) | TCGA-AA-3860-01 | Colorectum | colon adenocarcinoma | Female | <65 | III/IV | Chemotherapy | folinic | CR | |
| REG1A | SNV | Missense_Mutation | rs777579151 | c.131G>A | p.Arg44His | p.R44H | P05451 | protein_coding | deleterious(0.03) | benign(0) | TCGA-AA-3984-01 | Colorectum | colon adenocarcinoma | Female | <65 | I/II | Unknown | Unknown | SD |
| Page: 1 2 3 4 5 6 7 8 9 |
Top |
Related drugs of malignant transformation related genes |
| Identification of chemicals and drugs interact with genes involved in malignant transfromation |
| (DGIdb 4.0) |
| Entrez ID | Symbol | Category | Interaction Types | Drug Claim Name | Drug Name | PMIDs |
| 5967 | REG1A | DRUGGABLE GENOME, GROWTH FACTOR | LINOMIDE | ROQUINIMEX | 9564847 | |
| 5967 | REG1A | DRUGGABLE GENOME, GROWTH FACTOR | INSULIN | INSULIN | 9930932 |
| Page: 1 |

Copyright 2023-Present -The University of Texas Health Science Center at Houston |