
|
|||||
|
 | |
| |
| |
| |
| |
| |
|
Gene: RBM25 |
Gene summary for RBM25 |
| Gene information | Species | Human | Gene symbol | RBM25 | Gene ID | 58517 |
| Gene name | RNA binding motif protein 25 | |
| Gene Alias | NET52 | |
| Cytomap | 14q24.2 | |
| Gene Type | protein-coding | GO ID | GO:0000375 | UniProtAcc | P49756 |
Top |
Malignant transformation analysis |
| Identification of the aberrant gene expression in precancerous and cancerous lesions by comparing the gene expression of stem-like cells in diseased tissues with normal stem cells |
| Entrez ID | Symbol | Replicates | Species | Organ | Tissue | Adj P-value | Log2FC | Malignancy |
| 58517 | RBM25 | HTA11_3410_2000001011 | Human | Colorectum | AD | 6.82e-14 | -5.56e-01 | 0.0155 |
| 58517 | RBM25 | HTA11_3361_2000001011 | Human | Colorectum | AD | 3.24e-02 | -4.95e-01 | -0.1207 |
| 58517 | RBM25 | HTA11_866_3004761011 | Human | Colorectum | AD | 6.05e-03 | -3.84e-01 | 0.096 |
| 58517 | RBM25 | HTA11_6818_2000001021 | Human | Colorectum | AD | 2.95e-02 | -5.07e-01 | 0.0588 |
| 58517 | RBM25 | HTA11_99999965062_69753 | Human | Colorectum | MSI-H | 2.49e-06 | 8.72e-01 | 0.3487 |
| 58517 | RBM25 | HTA11_99999971662_82457 | Human | Colorectum | MSS | 1.54e-05 | -4.07e-01 | 0.3859 |
| 58517 | RBM25 | HTA11_99999973899_84307 | Human | Colorectum | MSS | 6.08e-03 | -5.85e-01 | 0.2585 |
| 58517 | RBM25 | HTA11_99999974143_84620 | Human | Colorectum | MSS | 2.51e-03 | -3.95e-01 | 0.3005 |
| 58517 | RBM25 | F007 | Human | Colorectum | FAP | 8.87e-03 | -8.64e-02 | 0.1176 |
| 58517 | RBM25 | A001-C-207 | Human | Colorectum | FAP | 2.84e-04 | 7.35e-02 | 0.1278 |
| 58517 | RBM25 | A015-C-203 | Human | Colorectum | FAP | 1.88e-45 | 3.92e-01 | -0.1294 |
| 58517 | RBM25 | A015-C-204 | Human | Colorectum | FAP | 3.38e-12 | 2.81e-01 | -0.0228 |
| 58517 | RBM25 | A014-C-040 | Human | Colorectum | FAP | 1.53e-06 | 2.28e-01 | -0.1184 |
| 58517 | RBM25 | A002-C-201 | Human | Colorectum | FAP | 5.94e-20 | 2.57e-01 | 0.0324 |
| 58517 | RBM25 | A002-C-203 | Human | Colorectum | FAP | 2.62e-04 | 8.47e-03 | 0.2786 |
| 58517 | RBM25 | A001-C-119 | Human | Colorectum | FAP | 7.92e-55 | 9.73e-01 | -0.1557 |
| 58517 | RBM25 | A001-C-108 | Human | Colorectum | FAP | 5.64e-29 | 4.22e-01 | -0.0272 |
| 58517 | RBM25 | A002-C-021 | Human | Colorectum | FAP | 2.25e-04 | 3.12e-01 | 0.1171 |
| 58517 | RBM25 | A002-C-205 | Human | Colorectum | FAP | 3.53e-49 | 6.06e-01 | -0.1236 |
| 58517 | RBM25 | A014-C-108 | Human | Colorectum | FAP | 5.42e-11 | 5.18e-01 | -0.124 |
| Page: 1 2 3 4 5 6 7 8 9 10 11 12 |
| Tissue | Expression Dynamics | Abbreviation |
| Colorectum (GSE201348) |  | FAP: Familial adenomatous polyposis |
| CRC: Colorectal cancer | ||
| Colorectum (HTA11) |  | AD: Adenomas |
| SER: Sessile serrated lesions | ||
| MSI-H: Microsatellite-high colorectal cancer | ||
| MSS: Microsatellite stable colorectal cancer | ||
| Endometrium |  | AEH: Atypical endometrial hyperplasia |
| EEC: Endometrioid Cancer | ||
| Esophagus | 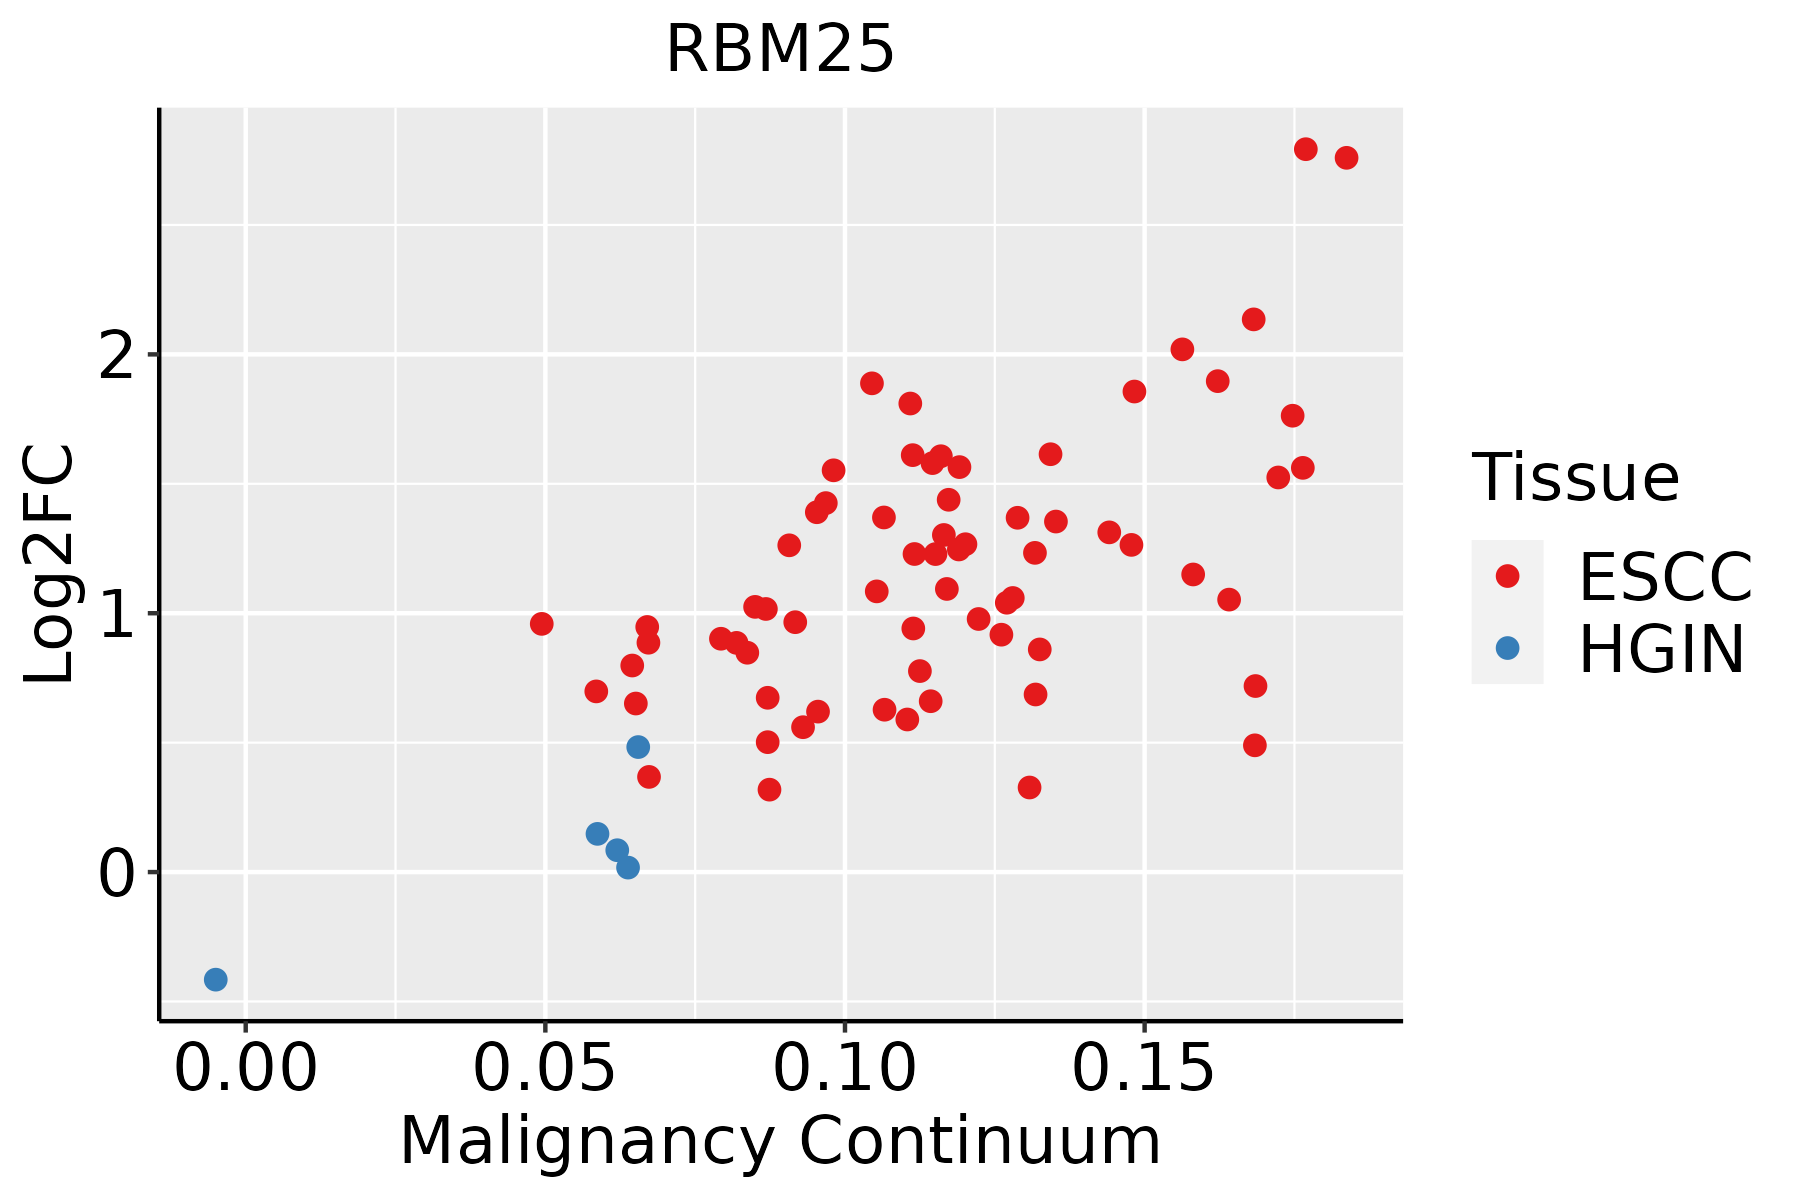 | ESCC: Esophageal squamous cell carcinoma |
| HGIN: High-grade intraepithelial neoplasias | ||
| LGIN: Low-grade intraepithelial neoplasias | ||
| Liver | 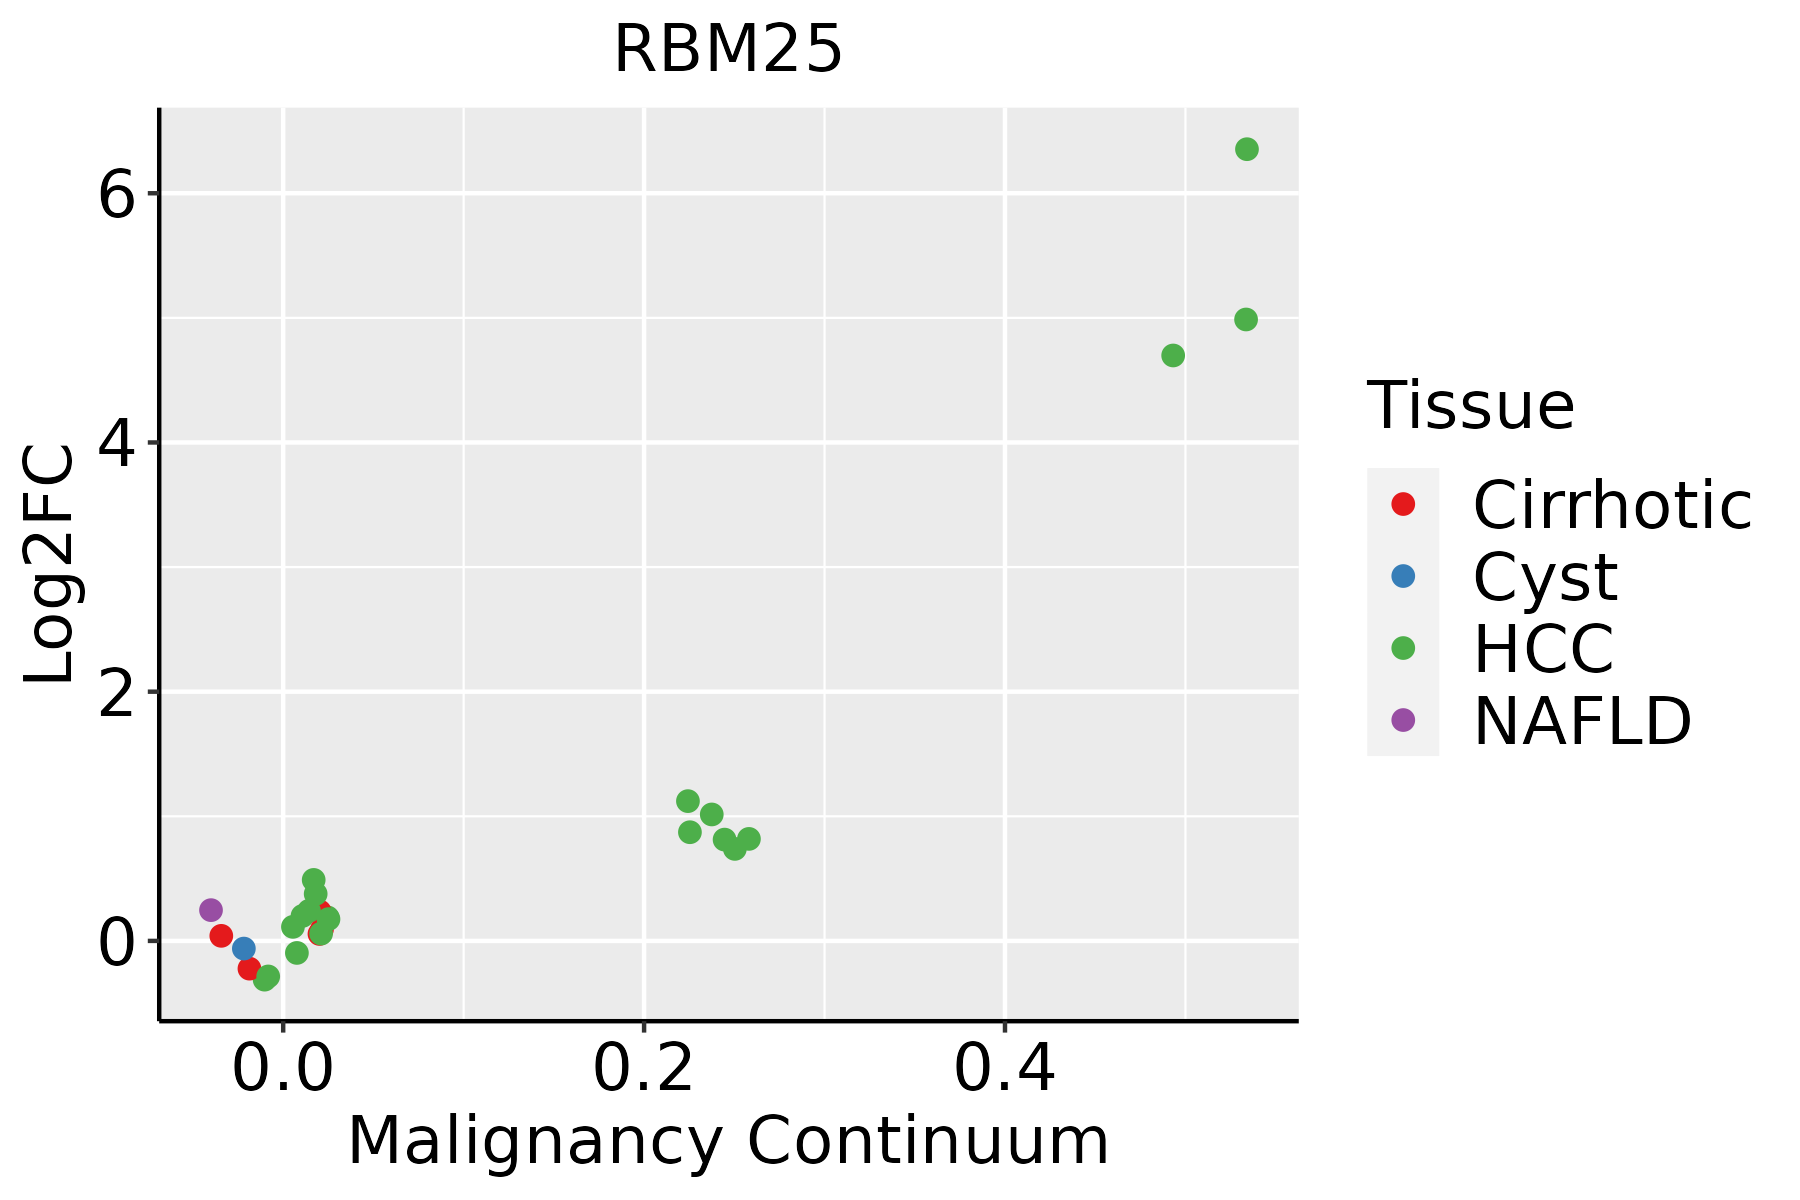 | HCC: Hepatocellular carcinoma |
| NAFLD: Non-alcoholic fatty liver disease | ||
| Lung |  | AAH: Atypical adenomatous hyperplasia |
| AIS: Adenocarcinoma in situ | ||
| IAC: Invasive lung adenocarcinoma | ||
| MIA: Minimally invasive adenocarcinoma | ||
| Oral Cavity | 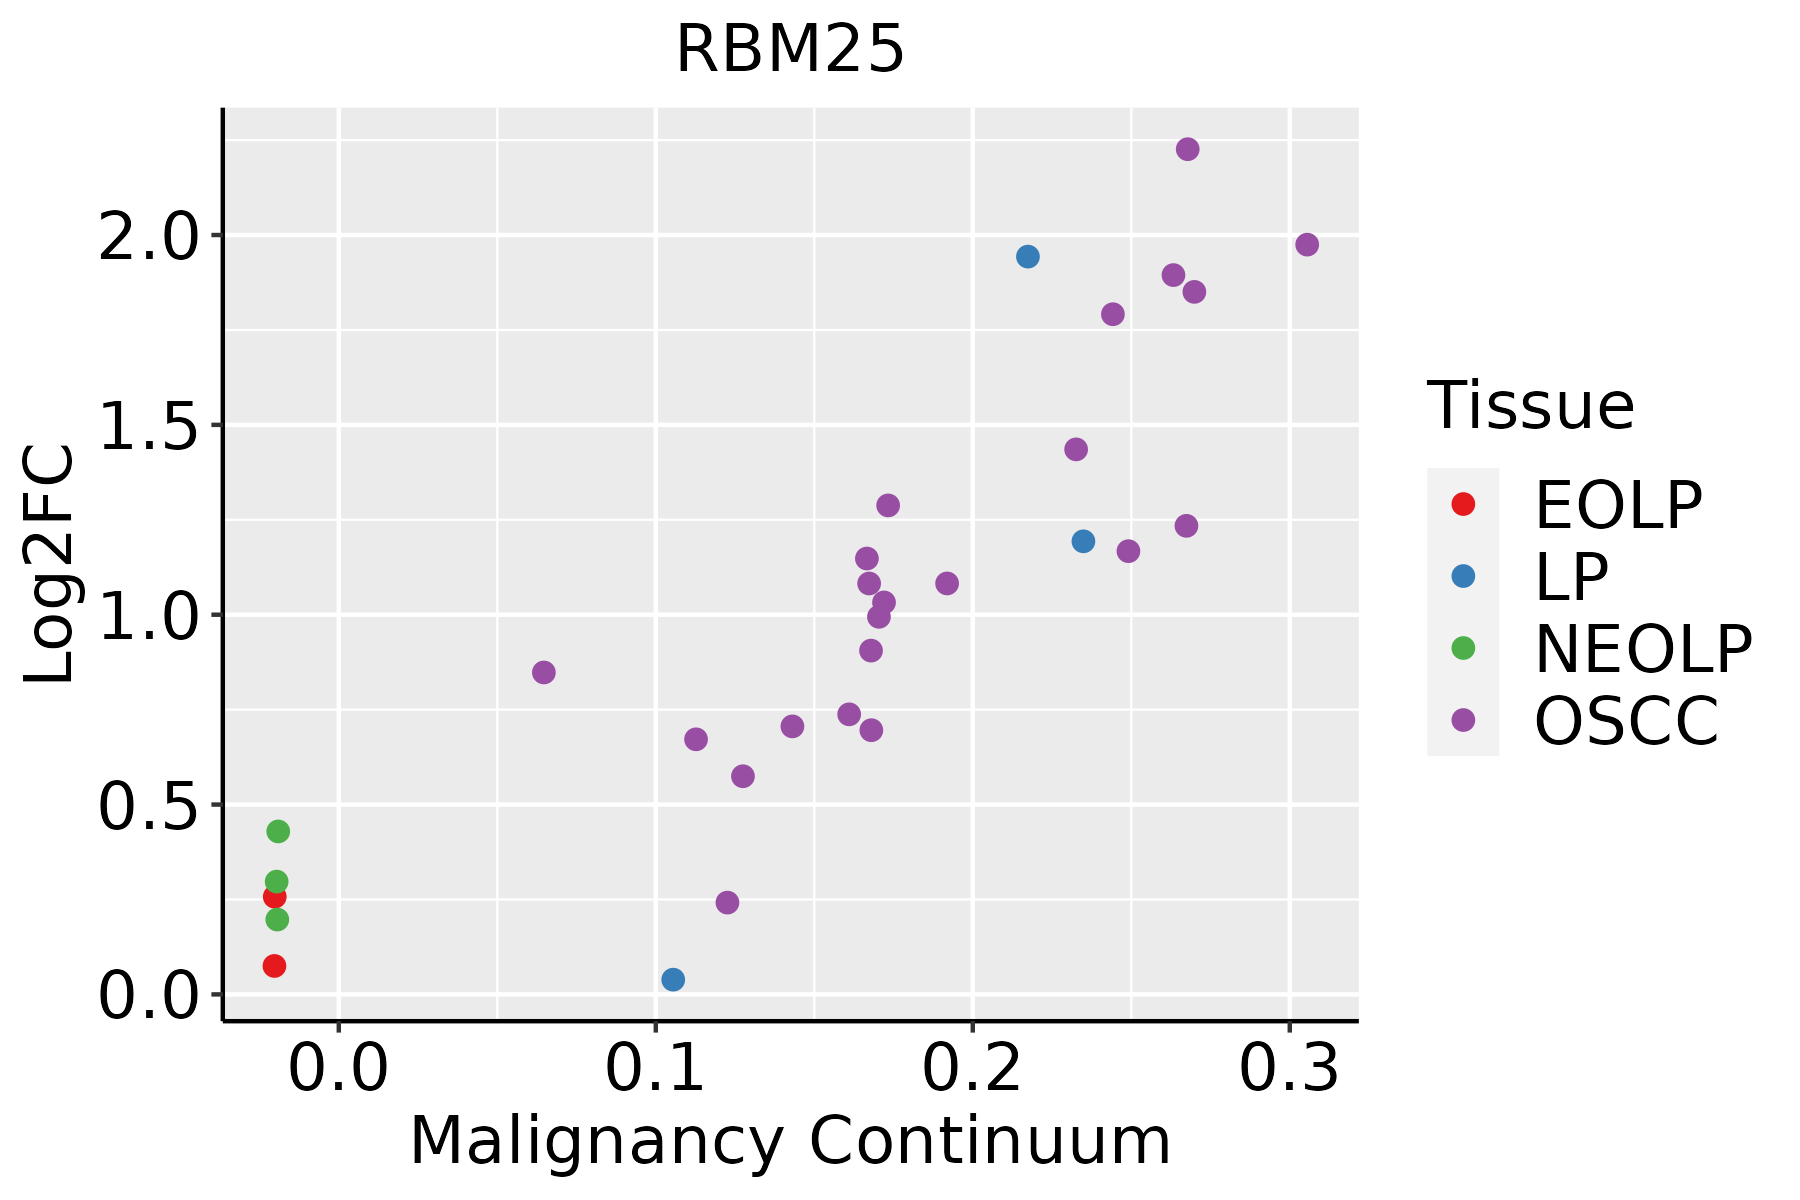 | EOLP: Erosive Oral lichen planus |
| LP: leukoplakia | ||
| NEOLP: Non-erosive oral lichen planus | ||
| OSCC: Oral squamous cell carcinoma | ||
| Prostate |  | BPH: Benign Prostatic Hyperplasia |
| Skin | 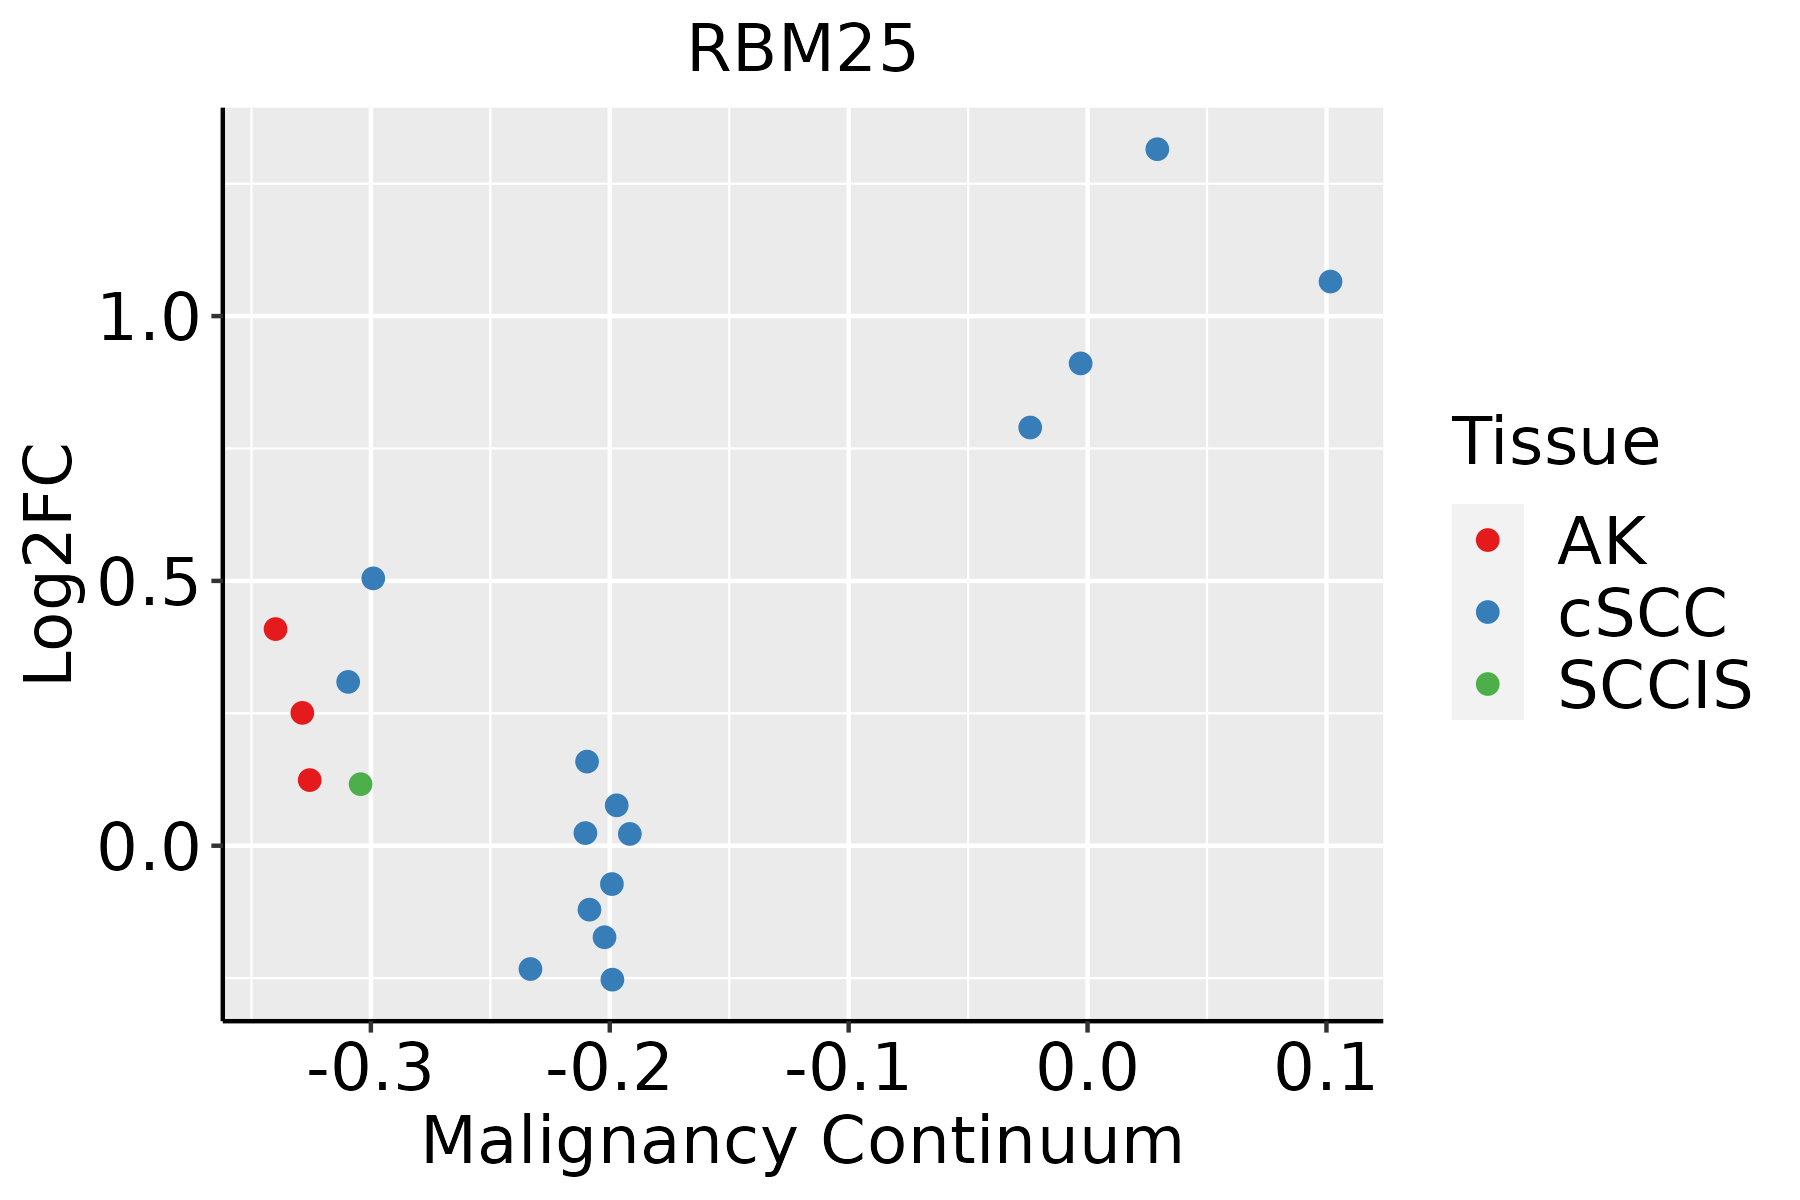 | AK: Actinic keratosis |
| cSCC: Cutaneous squamous cell carcinoma | ||
| SCCIS:squamous cell carcinoma in situ | ||
| Thyroid | 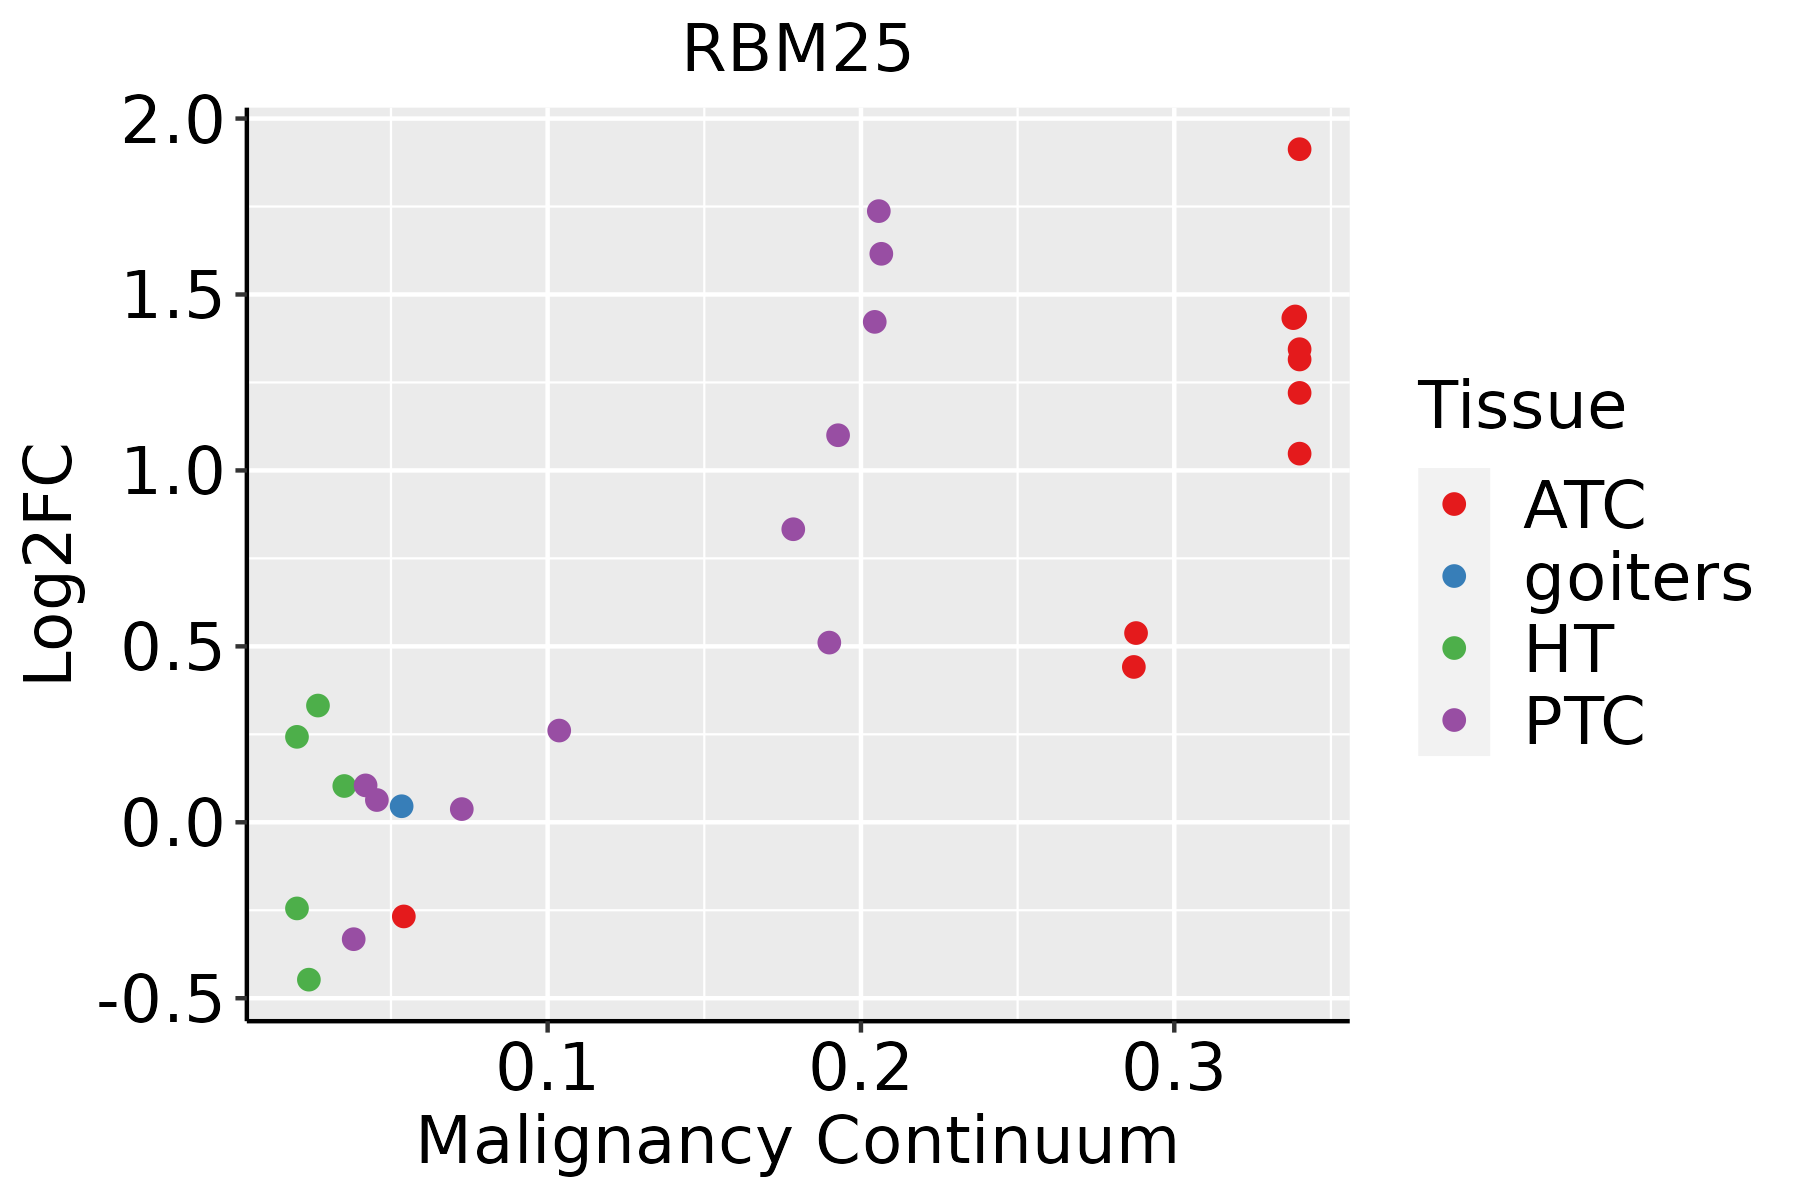 | ATC: Anaplastic thyroid cancer |
| HT: Hashimoto's thyroiditis | ||
| PTC: Papillary thyroid cancer |
| ∗log2FC in expression of this searched gene in stem-like cells from each diseased tissue sample relative to stem-like cells in normal samples in each tissue plotted against the malignancy continuum. Samples are colored based on if they are from different disease stage. |
Top |
Malignant transformation related pathway analysis |
| Find out the enriched GO biological processes and KEGG pathways involved in transition from healthy to precancer to cancer |
| Tissue | Disease Stage | Enriched GO biological Processes |
| Colorectum | AD |  |
| Colorectum | SER |  |
| Colorectum | MSS |  |
| Colorectum | MSI-H |  |
| Colorectum | FAP |  |
| ∗Top 15 enriched GO BP terms are showed in the bar plot of each disease state in each tissue. Each row represents a significant GO biological process which is colored according to the -log10(p.adjust). |
| Page: 1 2 3 4 5 6 7 8 9 |
| GO ID | Tissue | Disease Stage | Description | Gene Ratio | Bg Ratio | pvalue | p.adjust | Count |
| GO:19033115 | Colorectum | CRC | regulation of mRNA metabolic process | 80/2078 | 288/18723 | 3.21e-15 | 6.40e-12 | 80 |
| GO:00506845 | Colorectum | CRC | regulation of mRNA processing | 41/2078 | 137/18723 | 1.57e-09 | 5.23e-07 | 41 |
| GO:00434845 | Colorectum | CRC | regulation of RNA splicing | 43/2078 | 148/18723 | 1.75e-09 | 5.31e-07 | 43 |
| GO:00083805 | Colorectum | CRC | RNA splicing | 90/2078 | 434/18723 | 2.80e-09 | 7.97e-07 | 90 |
| GO:00480245 | Colorectum | CRC | regulation of mRNA splicing, via spliceosome | 32/2078 | 101/18723 | 2.11e-08 | 3.23e-06 | 32 |
| GO:00003805 | Colorectum | CRC | alternative mRNA splicing, via spliceosome | 25/2078 | 77/18723 | 4.28e-07 | 3.37e-05 | 25 |
| GO:00003775 | Colorectum | CRC | RNA splicing, via transesterification reactions with bulged adenosine as nucleophile | 66/2078 | 320/18723 | 4.39e-07 | 3.37e-05 | 66 |
| GO:00003985 | Colorectum | CRC | mRNA splicing, via spliceosome | 66/2078 | 320/18723 | 4.39e-07 | 3.37e-05 | 66 |
| GO:00003755 | Colorectum | CRC | RNA splicing, via transesterification reactions | 66/2078 | 324/18723 | 7.00e-07 | 4.61e-05 | 66 |
| GO:00003815 | Colorectum | CRC | regulation of alternative mRNA splicing, via spliceosome | 20/2078 | 60/18723 | 3.80e-06 | 1.61e-04 | 20 |
| GO:000838016 | Endometrium | AEH | RNA splicing | 111/2100 | 434/18723 | 2.42e-17 | 1.12e-14 | 111 |
| GO:004348416 | Endometrium | AEH | regulation of RNA splicing | 55/2100 | 148/18723 | 1.28e-16 | 5.49e-14 | 55 |
| GO:000037515 | Endometrium | AEH | RNA splicing, via transesterification reactions | 88/2100 | 324/18723 | 1.11e-15 | 3.91e-13 | 88 |
| GO:000037715 | Endometrium | AEH | RNA splicing, via transesterification reactions with bulged adenosine as nucleophile | 87/2100 | 320/18723 | 1.51e-15 | 4.78e-13 | 87 |
| GO:000039815 | Endometrium | AEH | mRNA splicing, via spliceosome | 87/2100 | 320/18723 | 1.51e-15 | 4.78e-13 | 87 |
| GO:004802416 | Endometrium | AEH | regulation of mRNA splicing, via spliceosome | 40/2100 | 101/18723 | 1.56e-13 | 4.27e-11 | 40 |
| GO:190331110 | Endometrium | AEH | regulation of mRNA metabolic process | 77/2100 | 288/18723 | 1.69e-13 | 4.40e-11 | 77 |
| GO:005068410 | Endometrium | AEH | regulation of mRNA processing | 42/2100 | 137/18723 | 6.05e-10 | 5.67e-08 | 42 |
| GO:00003809 | Endometrium | AEH | alternative mRNA splicing, via spliceosome | 26/2100 | 77/18723 | 1.28e-07 | 5.97e-06 | 26 |
| GO:00003819 | Endometrium | AEH | regulation of alternative mRNA splicing, via spliceosome | 20/2100 | 60/18723 | 4.46e-06 | 1.17e-04 | 20 |
| Page: 1 2 3 4 5 6 7 8 9 10 11 12 13 |
| Pathway ID | Tissue | Disease Stage | Description | Gene Ratio | Bg Ratio | pvalue | p.adjust | qvalue | Count |
| hsa03040 | Colorectum | AD | Spliceosome | 73/2092 | 217/8465 | 1.73e-03 | 9.68e-03 | 6.18e-03 | 73 |
| hsa030401 | Colorectum | AD | Spliceosome | 73/2092 | 217/8465 | 1.73e-03 | 9.68e-03 | 6.18e-03 | 73 |
| hsa030402 | Colorectum | MSS | Spliceosome | 66/1875 | 217/8465 | 2.58e-03 | 1.27e-02 | 7.81e-03 | 66 |
| hsa030403 | Colorectum | MSS | Spliceosome | 66/1875 | 217/8465 | 2.58e-03 | 1.27e-02 | 7.81e-03 | 66 |
| hsa030404 | Colorectum | MSI-H | Spliceosome | 37/797 | 217/8465 | 2.49e-04 | 3.23e-03 | 2.70e-03 | 37 |
| hsa030405 | Colorectum | MSI-H | Spliceosome | 37/797 | 217/8465 | 2.49e-04 | 3.23e-03 | 2.70e-03 | 37 |
| hsa030409 | Endometrium | AEH | Spliceosome | 54/1197 | 217/8465 | 1.47e-05 | 1.65e-04 | 1.21e-04 | 54 |
| hsa0304014 | Endometrium | AEH | Spliceosome | 54/1197 | 217/8465 | 1.47e-05 | 1.65e-04 | 1.21e-04 | 54 |
| hsa0304024 | Endometrium | EEC | Spliceosome | 54/1237 | 217/8465 | 3.78e-05 | 3.88e-04 | 2.89e-04 | 54 |
| hsa0304034 | Endometrium | EEC | Spliceosome | 54/1237 | 217/8465 | 3.78e-05 | 3.88e-04 | 2.89e-04 | 54 |
| hsa0304018 | Esophagus | HGIN | Spliceosome | 79/1383 | 217/8465 | 3.22e-13 | 7.00e-12 | 5.56e-12 | 79 |
| hsa0304019 | Esophagus | HGIN | Spliceosome | 79/1383 | 217/8465 | 3.22e-13 | 7.00e-12 | 5.56e-12 | 79 |
| hsa0304027 | Esophagus | ESCC | Spliceosome | 128/4205 | 217/8465 | 3.31e-03 | 8.79e-03 | 4.50e-03 | 128 |
| hsa0304037 | Esophagus | ESCC | Spliceosome | 128/4205 | 217/8465 | 3.31e-03 | 8.79e-03 | 4.50e-03 | 128 |
| hsa030407 | Liver | Cirrhotic | Spliceosome | 102/2530 | 217/8465 | 5.69e-08 | 9.47e-07 | 5.84e-07 | 102 |
| hsa0304012 | Liver | Cirrhotic | Spliceosome | 102/2530 | 217/8465 | 5.69e-08 | 9.47e-07 | 5.84e-07 | 102 |
| hsa0304022 | Liver | HCC | Spliceosome | 122/4020 | 217/8465 | 5.55e-03 | 1.60e-02 | 8.91e-03 | 122 |
| hsa0304032 | Liver | HCC | Spliceosome | 122/4020 | 217/8465 | 5.55e-03 | 1.60e-02 | 8.91e-03 | 122 |
| hsa0304016 | Oral cavity | OSCC | Spliceosome | 123/3704 | 217/8465 | 7.21e-05 | 2.74e-04 | 1.40e-04 | 123 |
| hsa0304017 | Oral cavity | OSCC | Spliceosome | 123/3704 | 217/8465 | 7.21e-05 | 2.74e-04 | 1.40e-04 | 123 |
| Page: 1 2 |
Top |
Cell-cell communication analysis |
| Identification of potential cell-cell interactions between two cell types and their ligand-receptor pairs for different disease states |
| Ligand | Receptor | LRpair | Pathway | Tissue | Disease Stage |
| Page: 1 |
Top |
Single-cell gene regulatory network inference analysis |
| Find out the significant the regulons (TFs) and the target genes of each regulon across cell types for different disease states |
| TF | Cell Type | Tissue | Disease Stage | Target Gene | RSS | Regulon Activity |
| ∗The dot plots of a searched regulon are shown for all cell subpopulations in each disease state of each tissue based on the regulon specific score inferred using pySCENIC and by calculating the average expression. |
| Page: 1 |
Top |
Somatic mutation of malignant transformation related genes |
| Annotation of somatic variants for genes involved in malignant transformation |
| Hugo Symbol | Variant Class | Variant Classification | dbSNP RS | HGVSc | HGVSp | HGVSp Short | SWISSPROT | BIOTYPE | SIFT | PolyPhen | Tumor Sample Barcode | Tissue | Histology | Sex | Age | Stage | Therapy Types | Drugs | Outcome |
| RBM25 | SNV | Missense_Mutation | c.1651N>G | p.Leu551Val | p.L551V | P49756 | protein_coding | tolerated(0.1) | benign(0.031) | TCGA-A2-A0EY-01 | Breast | breast invasive carcinoma | Female | <65 | I/II | Chemotherapy | adriamycin | SD | |
| RBM25 | SNV | Missense_Mutation | c.1268N>A | p.Arg423Gln | p.R423Q | P49756 | protein_coding | tolerated(0.08) | benign(0.071) | TCGA-A8-A092-01 | Breast | breast invasive carcinoma | Female | <65 | III/IV | Chemotherapy | paclitaxel | CR | |
| RBM25 | SNV | Missense_Mutation | c.2024N>G | p.Ser675Cys | p.S675C | P49756 | protein_coding | tolerated(0.08) | possibly_damaging(0.785) | TCGA-AC-A23H-01 | Breast | breast invasive carcinoma | Female | >=65 | I/II | Unknown | Unknown | PD | |
| RBM25 | SNV | Missense_Mutation | c.1795G>A | p.Glu599Lys | p.E599K | P49756 | protein_coding | tolerated(0.36) | possibly_damaging(0.899) | TCGA-BH-A0HA-01 | Breast | breast invasive carcinoma | Female | <65 | I/II | Unknown | Unknown | SD | |
| RBM25 | SNV | Missense_Mutation | c.1601N>A | p.Arg534Gln | p.R534Q | P49756 | protein_coding | deleterious(0.03) | possibly_damaging(0.885) | TCGA-D8-A1JK-01 | Breast | breast invasive carcinoma | Female | >=65 | I/II | Unknown | Unknown | SD | |
| RBM25 | SNV | Missense_Mutation | c.1291N>T | p.Arg431Trp | p.R431W | P49756 | protein_coding | deleterious(0) | probably_damaging(0.973) | TCGA-D8-A1X5-01 | Breast | breast invasive carcinoma | Female | >=65 | III/IV | Hormone Therapy | tamoxiphen | SD | |
| RBM25 | insertion | In_Frame_Ins | novel | c.288_289insTTGAGGATCACCGAACCACATGAACCCGAATGGATAACT | p.Glu96_Lys97insLeuArgIleThrGluProHisGluProGluTrpIleThr | p.E96_K97insLRITEPHEPEWIT | P49756 | protein_coding | TCGA-A2-A04Y-01 | Breast | breast invasive carcinoma | Female | <65 | I/II | Chemotherapy | cytoxan | SD | ||
| RBM25 | SNV | Missense_Mutation | novel | c.207N>T | p.Lys69Asn | p.K69N | P49756 | protein_coding | deleterious(0.01) | possibly_damaging(0.514) | TCGA-2W-A8YY-01 | Cervix | cervical & endocervical cancer | Female | <65 | I/II | Chemotherapy | cisplatin | CR |
| RBM25 | SNV | Missense_Mutation | c.646N>T | p.Arg216Cys | p.R216C | P49756 | protein_coding | deleterious(0.02) | possibly_damaging(0.446) | TCGA-DG-A2KK-01 | Cervix | cervical & endocervical cancer | Female | <65 | III/IV | Chemotherapy | cisplatin | SD | |
| RBM25 | SNV | Missense_Mutation | c.821N>C | p.Arg274Thr | p.R274T | P49756 | protein_coding | deleterious(0.01) | benign(0.354) | TCGA-DR-A0ZL-01 | Cervix | cervical & endocervical cancer | Female | <65 | I/II | Unknown | Unknown | SD |
| Page: 1 2 3 4 5 6 7 8 9 10 11 12 |
Top |
Related drugs of malignant transformation related genes |
| Identification of chemicals and drugs interact with genes involved in malignant transfromation |
| (DGIdb 4.0) |
| Entrez ID | Symbol | Category | Interaction Types | Drug Claim Name | Drug Name | PMIDs |
| Page: 1 |

Copyright 2023-Present -The University of Texas Health Science Center at Houston |