
|
|||||
|
 | |
| |
| |
| |
| |
| |
|
Gene: RAP2A |
Gene summary for RAP2A |
| Gene information | Species | Human | Gene symbol | RAP2A | Gene ID | 5911 |
| Gene name | RAP2A, member of RAS oncogene family | |
| Gene Alias | K-REV | |
| Cytomap | 13q32.1 | |
| Gene Type | protein-coding | GO ID | GO:0000165 | UniProtAcc | P10114 |
Top |
Malignant transformation analysis |
| Identification of the aberrant gene expression in precancerous and cancerous lesions by comparing the gene expression of stem-like cells in diseased tissues with normal stem cells |
| Entrez ID | Symbol | Replicates | Species | Organ | Tissue | Adj P-value | Log2FC | Malignancy |
| 5911 | RAP2A | P2T-E | Human | Esophagus | ESCC | 1.45e-20 | 4.33e-02 | 0.1177 |
| 5911 | RAP2A | P4T-E | Human | Esophagus | ESCC | 2.87e-08 | 1.17e-01 | 0.1323 |
| 5911 | RAP2A | P5T-E | Human | Esophagus | ESCC | 1.80e-06 | 4.75e-03 | 0.1327 |
| 5911 | RAP2A | P8T-E | Human | Esophagus | ESCC | 4.22e-03 | 9.76e-03 | 0.0889 |
| 5911 | RAP2A | P9T-E | Human | Esophagus | ESCC | 2.56e-06 | 3.69e-02 | 0.1131 |
| 5911 | RAP2A | P10T-E | Human | Esophagus | ESCC | 1.09e-08 | 9.12e-02 | 0.116 |
| 5911 | RAP2A | P11T-E | Human | Esophagus | ESCC | 1.75e-03 | 9.55e-02 | 0.1426 |
| 5911 | RAP2A | P12T-E | Human | Esophagus | ESCC | 1.44e-08 | 6.95e-02 | 0.1122 |
| 5911 | RAP2A | P15T-E | Human | Esophagus | ESCC | 1.67e-06 | 2.25e-02 | 0.1149 |
| 5911 | RAP2A | P16T-E | Human | Esophagus | ESCC | 6.52e-19 | 3.56e-01 | 0.1153 |
| 5911 | RAP2A | P21T-E | Human | Esophagus | ESCC | 1.27e-06 | 3.41e-02 | 0.1617 |
| 5911 | RAP2A | P22T-E | Human | Esophagus | ESCC | 2.01e-02 | -1.41e-02 | 0.1236 |
| 5911 | RAP2A | P24T-E | Human | Esophagus | ESCC | 2.10e-09 | 1.07e-02 | 0.1287 |
| 5911 | RAP2A | P26T-E | Human | Esophagus | ESCC | 1.04e-07 | 3.54e-03 | 0.1276 |
| 5911 | RAP2A | P30T-E | Human | Esophagus | ESCC | 6.70e-08 | 1.17e-01 | 0.137 |
| 5911 | RAP2A | P31T-E | Human | Esophagus | ESCC | 1.76e-08 | 8.04e-03 | 0.1251 |
| 5911 | RAP2A | P32T-E | Human | Esophagus | ESCC | 1.45e-12 | 9.12e-02 | 0.1666 |
| 5911 | RAP2A | P37T-E | Human | Esophagus | ESCC | 1.23e-09 | 9.17e-02 | 0.1371 |
| 5911 | RAP2A | P39T-E | Human | Esophagus | ESCC | 2.29e-04 | -3.97e-02 | 0.0894 |
| 5911 | RAP2A | P47T-E | Human | Esophagus | ESCC | 4.57e-16 | -2.97e-04 | 0.1067 |
| Page: 1 2 3 |
| Tissue | Expression Dynamics | Abbreviation |
| Esophagus |  | ESCC: Esophageal squamous cell carcinoma |
| HGIN: High-grade intraepithelial neoplasias | ||
| LGIN: Low-grade intraepithelial neoplasias | ||
| Liver | 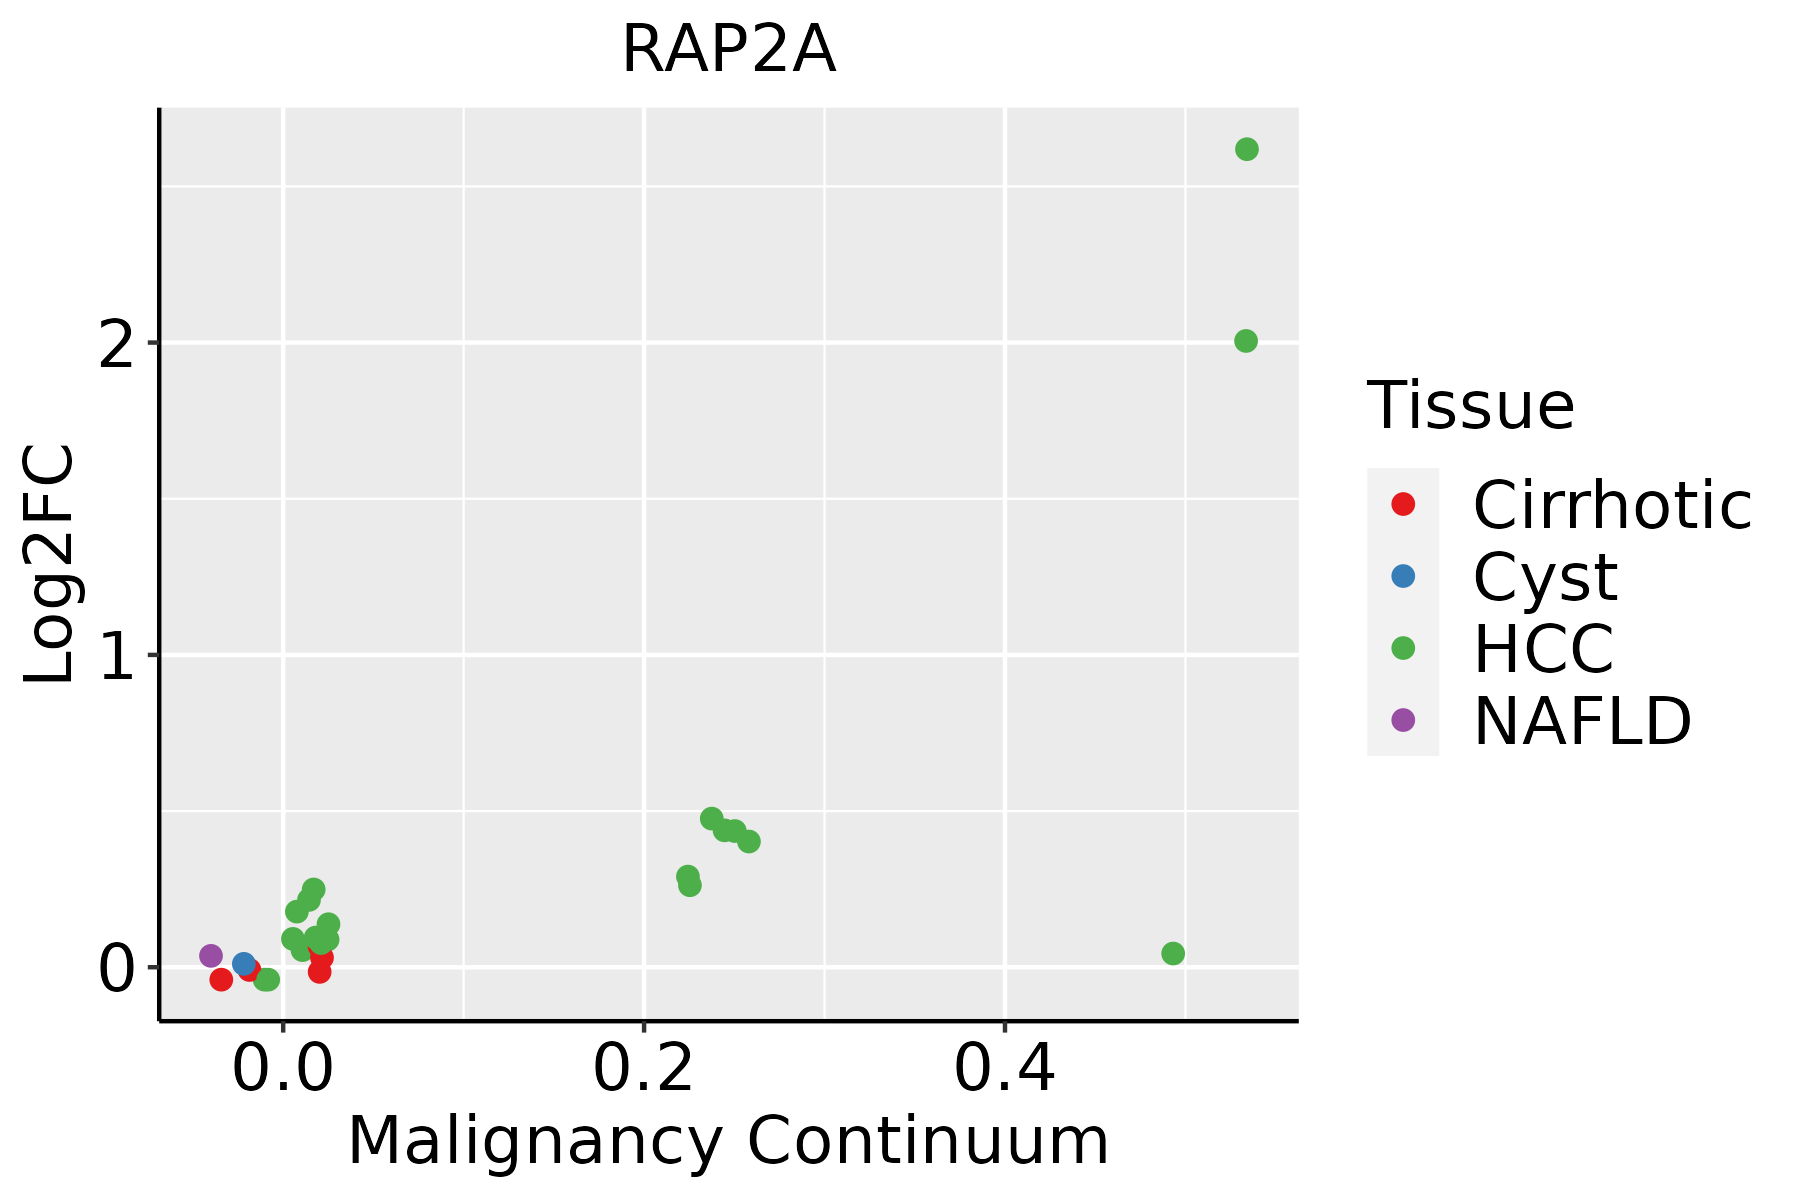 | HCC: Hepatocellular carcinoma |
| NAFLD: Non-alcoholic fatty liver disease | ||
| Oral Cavity | 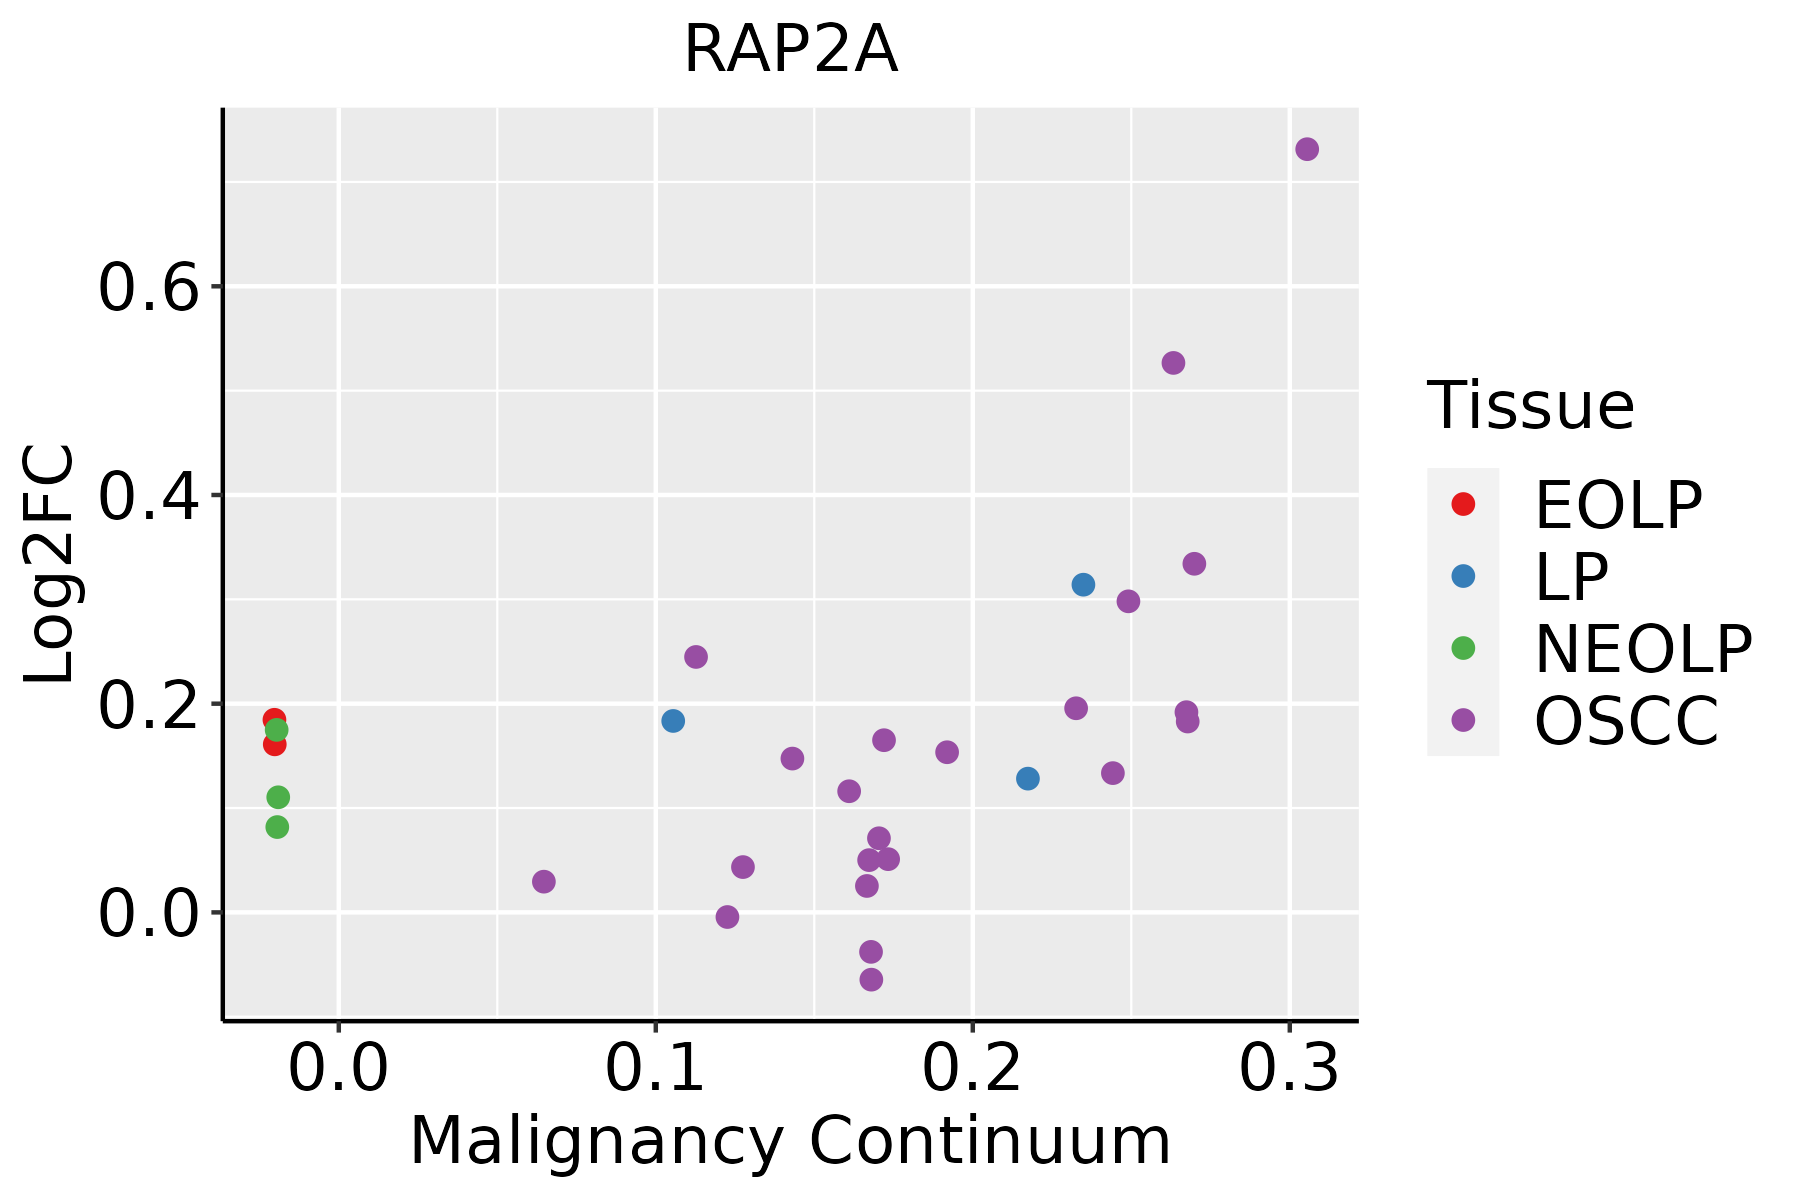 | EOLP: Erosive Oral lichen planus |
| LP: leukoplakia | ||
| NEOLP: Non-erosive oral lichen planus | ||
| OSCC: Oral squamous cell carcinoma |
| ∗log2FC in expression of this searched gene in stem-like cells from each diseased tissue sample relative to stem-like cells in normal samples in each tissue plotted against the malignancy continuum. Samples are colored based on if they are from different disease stage. |
Top |
Malignant transformation related pathway analysis |
| Find out the enriched GO biological processes and KEGG pathways involved in transition from healthy to precancer to cancer |
| Tissue | Disease Stage | Enriched GO biological Processes |
| Colorectum | AD |  |
| Colorectum | SER |  |
| Colorectum | MSS |  |
| Colorectum | MSI-H |  |
| Colorectum | FAP |  |
| ∗Top 15 enriched GO BP terms are showed in the bar plot of each disease state in each tissue. Each row represents a significant GO biological process which is colored according to the -log10(p.adjust). |
| Page: 1 2 3 4 5 6 7 8 9 |
| GO ID | Tissue | Disease Stage | Description | Gene Ratio | Bg Ratio | pvalue | p.adjust | Count |
| GO:003153216 | Oral cavity | OSCC | actin cytoskeleton reorganization | 65/7305 | 107/18723 | 4.25e-06 | 4.93e-05 | 65 |
| GO:000941018 | Oral cavity | OSCC | response to xenobiotic stimulus | 222/7305 | 462/18723 | 4.00e-05 | 3.48e-04 | 222 |
| GO:00072548 | Oral cavity | OSCC | JNK cascade | 90/7305 | 167/18723 | 6.49e-05 | 5.26e-04 | 90 |
| GO:00463288 | Oral cavity | OSCC | regulation of JNK cascade | 74/7305 | 133/18723 | 7.22e-05 | 5.69e-04 | 74 |
| GO:001097510 | Oral cavity | OSCC | regulation of neuron projection development | 210/7305 | 445/18723 | 2.35e-04 | 1.52e-03 | 210 |
| GO:0031952 | Oral cavity | OSCC | regulation of protein autophosphorylation | 27/7305 | 43/18723 | 1.35e-03 | 6.62e-03 | 27 |
| GO:0031954 | Oral cavity | OSCC | positive regulation of protein autophosphorylation | 18/7305 | 27/18723 | 3.34e-03 | 1.42e-02 | 18 |
| GO:0032486 | Oral cavity | OSCC | Rap protein signal transduction | 11/7305 | 15/18723 | 7.49e-03 | 2.75e-02 | 11 |
| GO:001635810 | Oral cavity | OSCC | dendrite development | 113/7305 | 243/18723 | 1.00e-02 | 3.49e-02 | 113 |
| GO:003153223 | Oral cavity | EOLP | actin cytoskeleton reorganization | 34/2218 | 107/18723 | 3.66e-08 | 1.41e-06 | 34 |
| GO:000726522 | Oral cavity | EOLP | Ras protein signal transduction | 74/2218 | 337/18723 | 8.76e-08 | 3.09e-06 | 74 |
| GO:001635815 | Oral cavity | EOLP | dendrite development | 55/2218 | 243/18723 | 1.43e-06 | 3.42e-05 | 55 |
| GO:001097515 | Oral cavity | EOLP | regulation of neuron projection development | 86/2218 | 445/18723 | 2.75e-06 | 6.05e-05 | 86 |
| GO:007265924 | Oral cavity | EOLP | protein localization to plasma membrane | 59/2218 | 284/18723 | 1.07e-05 | 1.91e-04 | 59 |
| GO:004677713 | Oral cavity | EOLP | protein autophosphorylation | 49/2218 | 227/18723 | 2.04e-05 | 3.21e-04 | 49 |
| GO:199077823 | Oral cavity | EOLP | protein localization to cell periphery | 65/2218 | 333/18723 | 3.17e-05 | 4.48e-04 | 65 |
| GO:00488137 | Oral cavity | EOLP | dendrite morphogenesis | 34/2218 | 146/18723 | 7.56e-05 | 9.19e-04 | 34 |
| GO:00303366 | Oral cavity | EOLP | negative regulation of cell migration | 64/2218 | 344/18723 | 1.57e-04 | 1.67e-03 | 64 |
| GO:003109824 | Oral cavity | EOLP | stress-activated protein kinase signaling cascade | 49/2218 | 247/18723 | 1.89e-04 | 1.94e-03 | 49 |
| GO:00512716 | Oral cavity | EOLP | negative regulation of cellular component movement | 67/2218 | 367/18723 | 1.97e-04 | 2.00e-03 | 67 |
| Page: 1 2 3 4 5 |
| Pathway ID | Tissue | Disease Stage | Description | Gene Ratio | Bg Ratio | pvalue | p.adjust | qvalue | Count |
| Page: 1 |
Top |
Cell-cell communication analysis |
| Identification of potential cell-cell interactions between two cell types and their ligand-receptor pairs for different disease states |
| Ligand | Receptor | LRpair | Pathway | Tissue | Disease Stage |
| Page: 1 |
Top |
Single-cell gene regulatory network inference analysis |
| Find out the significant the regulons (TFs) and the target genes of each regulon across cell types for different disease states |
| TF | Cell Type | Tissue | Disease Stage | Target Gene | RSS | Regulon Activity |
| ∗The dot plots of a searched regulon are shown for all cell subpopulations in each disease state of each tissue based on the regulon specific score inferred using pySCENIC and by calculating the average expression. |
| Page: 1 |
Top |
Somatic mutation of malignant transformation related genes |
| Annotation of somatic variants for genes involved in malignant transformation |
| Hugo Symbol | Variant Class | Variant Classification | dbSNP RS | HGVSc | HGVSp | HGVSp Short | SWISSPROT | BIOTYPE | SIFT | PolyPhen | Tumor Sample Barcode | Tissue | Histology | Sex | Age | Stage | Therapy Types | Drugs | Outcome |
| RAP2A | SNV | Missense_Mutation | novel | c.463G>A | p.Glu155Lys | p.E155K | P10114 | protein_coding | deleterious(0.02) | benign(0.111) | TCGA-AA-3984-01 | Colorectum | colon adenocarcinoma | Female | <65 | I/II | Unknown | Unknown | SD |
| RAP2A | SNV | Missense_Mutation | c.503N>T | p.Ala168Val | p.A168V | P10114 | protein_coding | tolerated(0.17) | benign(0.017) | TCGA-AP-A051-01 | Endometrium | uterine corpus endometrioid carcinoma | Female | >=65 | I/II | Unknown | Unknown | SD | |
| RAP2A | SNV | Missense_Mutation | novel | c.507N>T | p.Gln169His | p.Q169H | P10114 | protein_coding | tolerated(0.16) | benign(0.001) | TCGA-AP-A1DK-01 | Endometrium | uterine corpus endometrioid carcinoma | Female | <65 | I/II | Unknown | Unknown | SD |
| RAP2A | SNV | Missense_Mutation | c.429N>T | p.Met143Ile | p.M143I | P10114 | protein_coding | tolerated(0.43) | benign(0.001) | TCGA-AX-A05S-01 | Endometrium | uterine corpus endometrioid carcinoma | Female | >=65 | III/IV | Unspecific | Carboplatin & Paclitaxel | PD | |
| RAP2A | SNV | Missense_Mutation | c.439N>A | p.Ala147Thr | p.A147T | P10114 | protein_coding | deleterious(0) | probably_damaging(0.989) | TCGA-AX-A2HC-01 | Endometrium | uterine corpus endometrioid carcinoma | Female | <65 | III/IV | Chemotherapy | paclitaxel | PD | |
| RAP2A | SNV | Missense_Mutation | novel | c.463G>A | p.Glu155Lys | p.E155K | P10114 | protein_coding | deleterious(0.02) | benign(0.111) | TCGA-E6-A1LX-01 | Endometrium | uterine corpus endometrioid carcinoma | Female | <65 | I/II | Unknown | Unknown | SD |
| RAP2A | SNV | Missense_Mutation | novel | c.463N>A | p.Glu155Lys | p.E155K | P10114 | protein_coding | deleterious(0.02) | benign(0.111) | TCGA-EO-A22R-01 | Endometrium | uterine corpus endometrioid carcinoma | Female | <65 | I/II | Unknown | Unknown | SD |
| RAP2A | insertion | Nonsense_Mutation | novel | c.505_506insTCACAGTGGATGATAAAATGAGTTTTATGAAATGATGTTTT | p.Gln169LeufsTer12 | p.Q169Lfs*12 | P10114 | protein_coding | TCGA-BG-A0MQ-01 | Endometrium | uterine corpus endometrioid carcinoma | Female | >=65 | I/II | Unknown | Unknown | SD | ||
| RAP2A | SNV | Missense_Mutation | c.429N>T | p.Met143Ile | p.M143I | P10114 | protein_coding | tolerated(0.43) | benign(0.001) | TCGA-55-6969-01 | Lung | lung adenocarcinoma | Male | <65 | I/II | Unknown | Unknown | SD | |
| RAP2A | SNV | Missense_Mutation | novel | c.490A>T | p.Met164Leu | p.M164L | P10114 | protein_coding | deleterious(0.01) | benign(0.009) | TCGA-55-6975-01 | Lung | lung adenocarcinoma | Male | <65 | I/II | Unknown | Unknown | PD |
| Page: 1 2 |
Top |
Related drugs of malignant transformation related genes |
| Identification of chemicals and drugs interact with genes involved in malignant transfromation |
| (DGIdb 4.0) |
| Entrez ID | Symbol | Category | Interaction Types | Drug Claim Name | Drug Name | PMIDs |
| Page: 1 |

Copyright 2023-Present -The University of Texas Health Science Center at Houston |