
|
|||||
|
 | |
| |
| |
| |
| |
| |
|
Gene: RAD51AP1 |
Gene summary for RAD51AP1 |
| Gene information | Species | Human | Gene symbol | RAD51AP1 | Gene ID | 10635 |
| Gene name | RAD51 associated protein 1 | |
| Gene Alias | PIR51 | |
| Cytomap | 12p13.32 | |
| Gene Type | protein-coding | GO ID | GO:0000003 | UniProtAcc | Q96B01 |
Top |
Malignant transformation analysis |
| Identification of the aberrant gene expression in precancerous and cancerous lesions by comparing the gene expression of stem-like cells in diseased tissues with normal stem cells |
| Entrez ID | Symbol | Replicates | Species | Organ | Tissue | Adj P-value | Log2FC | Malignancy |
| 10635 | RAD51AP1 | LZE7T | Human | Esophagus | ESCC | 6.33e-03 | 2.65e-01 | 0.0667 |
| 10635 | RAD51AP1 | P2T-E | Human | Esophagus | ESCC | 9.78e-30 | 9.59e-01 | 0.1177 |
| 10635 | RAD51AP1 | P4T-E | Human | Esophagus | ESCC | 3.74e-25 | 6.75e-01 | 0.1323 |
| 10635 | RAD51AP1 | P5T-E | Human | Esophagus | ESCC | 7.98e-13 | 3.44e-01 | 0.1327 |
| 10635 | RAD51AP1 | P8T-E | Human | Esophagus | ESCC | 9.56e-08 | 2.59e-01 | 0.0889 |
| 10635 | RAD51AP1 | P9T-E | Human | Esophagus | ESCC | 3.05e-03 | 1.27e-01 | 0.1131 |
| 10635 | RAD51AP1 | P10T-E | Human | Esophagus | ESCC | 2.06e-08 | 2.67e-01 | 0.116 |
| 10635 | RAD51AP1 | P15T-E | Human | Esophagus | ESCC | 3.26e-02 | 1.21e-01 | 0.1149 |
| 10635 | RAD51AP1 | P16T-E | Human | Esophagus | ESCC | 4.41e-07 | 2.12e-01 | 0.1153 |
| 10635 | RAD51AP1 | P17T-E | Human | Esophagus | ESCC | 1.49e-02 | 1.56e-01 | 0.1278 |
| 10635 | RAD51AP1 | P20T-E | Human | Esophagus | ESCC | 2.18e-03 | 1.19e-01 | 0.1124 |
| 10635 | RAD51AP1 | P21T-E | Human | Esophagus | ESCC | 4.41e-07 | 1.62e-01 | 0.1617 |
| 10635 | RAD51AP1 | P22T-E | Human | Esophagus | ESCC | 2.06e-08 | 3.08e-01 | 0.1236 |
| 10635 | RAD51AP1 | P24T-E | Human | Esophagus | ESCC | 2.06e-08 | 2.68e-01 | 0.1287 |
| 10635 | RAD51AP1 | P26T-E | Human | Esophagus | ESCC | 7.90e-03 | 1.39e-01 | 0.1276 |
| 10635 | RAD51AP1 | P27T-E | Human | Esophagus | ESCC | 2.06e-08 | 2.36e-01 | 0.1055 |
| 10635 | RAD51AP1 | P28T-E | Human | Esophagus | ESCC | 9.02e-11 | 2.40e-01 | 0.1149 |
| 10635 | RAD51AP1 | P30T-E | Human | Esophagus | ESCC | 1.02e-02 | 3.29e-01 | 0.137 |
| 10635 | RAD51AP1 | P31T-E | Human | Esophagus | ESCC | 1.62e-13 | 3.63e-01 | 0.1251 |
| 10635 | RAD51AP1 | P32T-E | Human | Esophagus | ESCC | 8.56e-12 | 2.95e-01 | 0.1666 |
| Page: 1 2 3 |
| Tissue | Expression Dynamics | Abbreviation |
| Esophagus |  | ESCC: Esophageal squamous cell carcinoma |
| HGIN: High-grade intraepithelial neoplasias | ||
| LGIN: Low-grade intraepithelial neoplasias | ||
| Oral Cavity | 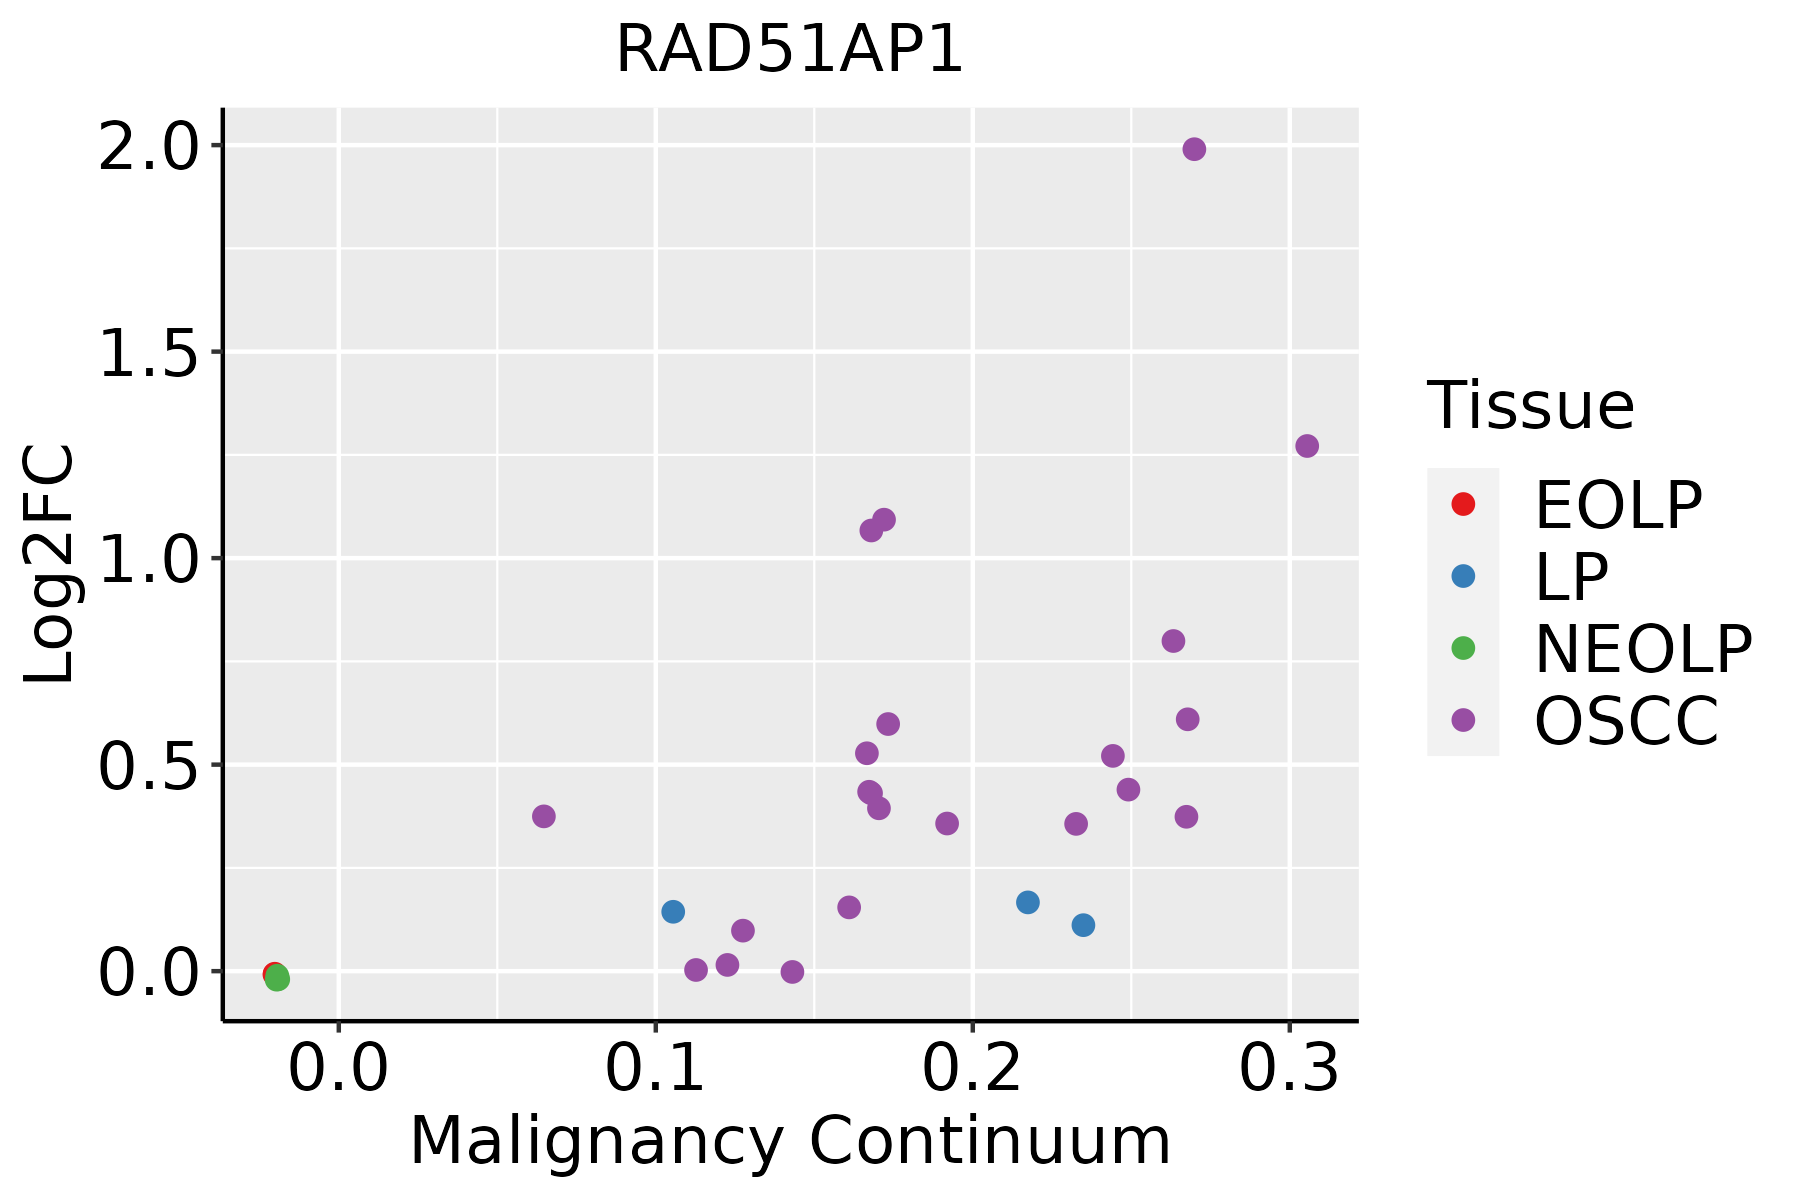 | EOLP: Erosive Oral lichen planus |
| LP: leukoplakia | ||
| NEOLP: Non-erosive oral lichen planus | ||
| OSCC: Oral squamous cell carcinoma |
| ∗log2FC in expression of this searched gene in stem-like cells from each diseased tissue sample relative to stem-like cells in normal samples in each tissue plotted against the malignancy continuum. Samples are colored based on if they are from different disease stage. |
Top |
Malignant transformation related pathway analysis |
| Find out the enriched GO biological processes and KEGG pathways involved in transition from healthy to precancer to cancer |
| Tissue | Disease Stage | Enriched GO biological Processes |
| Colorectum | AD |  |
| Colorectum | SER |  |
| Colorectum | MSS |  |
| Colorectum | MSI-H |  |
| Colorectum | FAP |  |
| ∗Top 15 enriched GO BP terms are showed in the bar plot of each disease state in each tissue. Each row represents a significant GO biological process which is colored according to the -log10(p.adjust). |
| Page: 1 2 3 4 5 6 7 8 9 |
| GO ID | Tissue | Disease Stage | Description | Gene Ratio | Bg Ratio | pvalue | p.adjust | Count |
| GO:00457394 | Oral cavity | OSCC | positive regulation of DNA repair | 45/7305 | 73/18723 | 7.46e-05 | 5.82e-04 | 45 |
| GO:0006310 | Oral cavity | OSCC | DNA recombination | 147/7305 | 305/18723 | 6.33e-04 | 3.56e-03 | 147 |
| GO:20007792 | Oral cavity | OSCC | regulation of double-strand break repair | 48/7305 | 85/18723 | 8.14e-04 | 4.35e-03 | 48 |
| GO:0000725 | Oral cavity | OSCC | recombinational repair | 70/7305 | 140/18723 | 5.22e-03 | 2.03e-02 | 70 |
| GO:0000724 | Oral cavity | OSCC | double-strand break repair via homologous recombination | 69/7305 | 138/18723 | 5.52e-03 | 2.14e-02 | 69 |
| GO:0051785 | Oral cavity | OSCC | positive regulation of nuclear division | 31/7305 | 57/18723 | 1.32e-02 | 4.38e-02 | 31 |
| GO:2000781 | Oral cavity | OSCC | positive regulation of double-strand break repair | 23/7305 | 40/18723 | 1.36e-02 | 4.50e-02 | 23 |
| Page: 1 2 3 |
| Pathway ID | Tissue | Disease Stage | Description | Gene Ratio | Bg Ratio | pvalue | p.adjust | qvalue | Count |
| Page: 1 |
Top |
Cell-cell communication analysis |
| Identification of potential cell-cell interactions between two cell types and their ligand-receptor pairs for different disease states |
| Ligand | Receptor | LRpair | Pathway | Tissue | Disease Stage |
| Page: 1 |
Top |
Single-cell gene regulatory network inference analysis |
| Find out the significant the regulons (TFs) and the target genes of each regulon across cell types for different disease states |
| TF | Cell Type | Tissue | Disease Stage | Target Gene | RSS | Regulon Activity |
| ∗The dot plots of a searched regulon are shown for all cell subpopulations in each disease state of each tissue based on the regulon specific score inferred using pySCENIC and by calculating the average expression. |
| Page: 1 |
Top |
Somatic mutation of malignant transformation related genes |
| Annotation of somatic variants for genes involved in malignant transformation |
| Hugo Symbol | Variant Class | Variant Classification | dbSNP RS | HGVSc | HGVSp | HGVSp Short | SWISSPROT | BIOTYPE | SIFT | PolyPhen | Tumor Sample Barcode | Tissue | Histology | Sex | Age | Stage | Therapy Types | Drugs | Outcome |
| RAD51AP1 | SNV | Missense_Mutation | c.685N>T | p.Val229Phe | p.V229F | Q96B01 | protein_coding | tolerated(0.17) | possibly_damaging(0.775) | TCGA-A2-A0EO-01 | Breast | breast invasive carcinoma | Female | <65 | I/II | Hormone Therapy | tamoxiphen | SD | |
| RAD51AP1 | SNV | Missense_Mutation | novel | c.1003N>T | p.Gly335Cys | p.G335C | Q96B01 | protein_coding | deleterious(0) | probably_damaging(1) | TCGA-A2-A25E-01 | Breast | breast invasive carcinoma | Female | <65 | III/IV | Chemotherapy | cytoxan | PD |
| RAD51AP1 | SNV | Missense_Mutation | c.163N>G | p.Leu55Val | p.L55V | Q96B01 | protein_coding | tolerated(0.47) | benign(0.003) | TCGA-A8-A08R-01 | Breast | breast invasive carcinoma | Female | <65 | I/II | Unknown | Unknown | SD | |
| RAD51AP1 | SNV | Missense_Mutation | novel | c.938N>A | p.Ser313Asn | p.S313N | Q96B01 | protein_coding | deleterious(0.04) | benign(0.021) | TCGA-DS-A3LQ-01 | Cervix | cervical & endocervical cancer | Female | <65 | III/IV | Chemotherapy | cisplatin | SD |
| RAD51AP1 | SNV | Missense_Mutation | novel | c.428C>G | p.Ser143Cys | p.S143C | Q96B01 | protein_coding | deleterious(0) | probably_damaging(0.999) | TCGA-EA-A3HU-01 | Cervix | cervical & endocervical cancer | Female | <65 | I/II | Unknown | Unknown | SD |
| RAD51AP1 | SNV | Missense_Mutation | c.407N>C | p.Met136Thr | p.M136T | Q96B01 | protein_coding | tolerated(0.4) | benign(0.001) | TCGA-JX-A3Q8-01 | Cervix | cervical & endocervical cancer | Female | <65 | I/II | Unknown | Unknown | SD | |
| RAD51AP1 | SNV | Missense_Mutation | rs766644662 | c.779N>T | p.Ser260Leu | p.S260L | Q96B01 | protein_coding | tolerated(0.12) | benign(0.007) | TCGA-AA-3984-01 | Colorectum | colon adenocarcinoma | Female | <65 | I/II | Unknown | Unknown | SD |
| RAD51AP1 | SNV | Missense_Mutation | c.862N>G | p.Lys288Glu | p.K288E | Q96B01 | protein_coding | deleterious(0.03) | possibly_damaging(0.71) | TCGA-AA-A00N-01 | Colorectum | colon adenocarcinoma | Male | >=65 | I/II | Unknown | Unknown | PD | |
| RAD51AP1 | SNV | Missense_Mutation | rs766644662 | c.779N>T | p.Ser260Leu | p.S260L | Q96B01 | protein_coding | tolerated(0.12) | benign(0.007) | TCGA-AA-A010-01 | Colorectum | colon adenocarcinoma | Female | <65 | I/II | Chemotherapy | folinic | CR |
| RAD51AP1 | SNV | Missense_Mutation | c.839N>A | p.Ser280Tyr | p.S280Y | Q96B01 | protein_coding | tolerated(0.33) | benign(0.007) | TCGA-CA-6717-01 | Colorectum | colon adenocarcinoma | Male | <65 | I/II | Chemotherapy | oxaliplatin | CR |
| Page: 1 2 3 4 5 6 |
Top |
Related drugs of malignant transformation related genes |
| Identification of chemicals and drugs interact with genes involved in malignant transfromation |
| (DGIdb 4.0) |
| Entrez ID | Symbol | Category | Interaction Types | Drug Claim Name | Drug Name | PMIDs |
| Page: 1 |

Copyright 2023-Present -The University of Texas Health Science Center at Houston |