
|
|||||
|
 | |
| |
| |
| |
| |
| |
|
Gene: RABEP1 |
Gene summary for RABEP1 |
| Gene information | Species | Human | Gene symbol | RABEP1 | Gene ID | 9135 |
| Gene name | rabaptin, RAB GTPase binding effector protein 1 | |
| Gene Alias | RAB5EP | |
| Cytomap | 17p13.2 | |
| Gene Type | protein-coding | GO ID | GO:0006810 | UniProtAcc | Q15276 |
Top |
Malignant transformation analysis |
| Identification of the aberrant gene expression in precancerous and cancerous lesions by comparing the gene expression of stem-like cells in diseased tissues with normal stem cells |
| Entrez ID | Symbol | Replicates | Species | Organ | Tissue | Adj P-value | Log2FC | Malignancy |
| 9135 | RABEP1 | GSM4909297 | Human | Breast | IDC | 1.93e-02 | -1.79e-02 | 0.1517 |
| 9135 | RABEP1 | GSM4909298 | Human | Breast | IDC | 1.85e-04 | 2.55e-01 | 0.1551 |
| 9135 | RABEP1 | GSM4909301 | Human | Breast | IDC | 3.09e-13 | 5.10e-01 | 0.1577 |
| 9135 | RABEP1 | GSM4909305 | Human | Breast | IDC | 3.66e-03 | 2.95e-01 | 0.0436 |
| 9135 | RABEP1 | GSM4909306 | Human | Breast | IDC | 3.64e-02 | 2.43e-01 | 0.1564 |
| 9135 | RABEP1 | GSM4909307 | Human | Breast | IDC | 4.46e-05 | 3.44e-01 | 0.1569 |
| 9135 | RABEP1 | GSM4909308 | Human | Breast | IDC | 1.01e-18 | 5.02e-01 | 0.158 |
| 9135 | RABEP1 | GSM4909311 | Human | Breast | IDC | 2.49e-07 | -1.33e-01 | 0.1534 |
| 9135 | RABEP1 | GSM4909319 | Human | Breast | IDC | 7.52e-14 | -1.07e-01 | 0.1563 |
| 9135 | RABEP1 | M1 | Human | Breast | IDC | 1.56e-09 | 4.82e-01 | 0.1577 |
| 9135 | RABEP1 | M5 | Human | Breast | IDC | 1.99e-03 | 5.86e-01 | 0.1598 |
| 9135 | RABEP1 | P1 | Human | Breast | IDC | 1.77e-06 | 2.56e-01 | 0.1527 |
| 9135 | RABEP1 | DCIS2 | Human | Breast | DCIS | 3.07e-28 | 2.74e-02 | 0.0085 |
| 9135 | RABEP1 | LZE4T | Human | Esophagus | ESCC | 1.63e-15 | 3.65e-01 | 0.0811 |
| 9135 | RABEP1 | LZE7T | Human | Esophagus | ESCC | 4.17e-05 | 1.92e-01 | 0.0667 |
| 9135 | RABEP1 | LZE24T | Human | Esophagus | ESCC | 1.58e-14 | 4.48e-01 | 0.0596 |
| 9135 | RABEP1 | LZE21T | Human | Esophagus | ESCC | 3.34e-02 | 2.52e-01 | 0.0655 |
| 9135 | RABEP1 | P1T-E | Human | Esophagus | ESCC | 1.45e-06 | 2.90e-01 | 0.0875 |
| 9135 | RABEP1 | P2T-E | Human | Esophagus | ESCC | 2.42e-20 | 4.46e-01 | 0.1177 |
| 9135 | RABEP1 | P4T-E | Human | Esophagus | ESCC | 1.63e-38 | 8.11e-01 | 0.1323 |
| Page: 1 2 3 4 5 6 7 |
| Tissue | Expression Dynamics | Abbreviation |
| Breast | 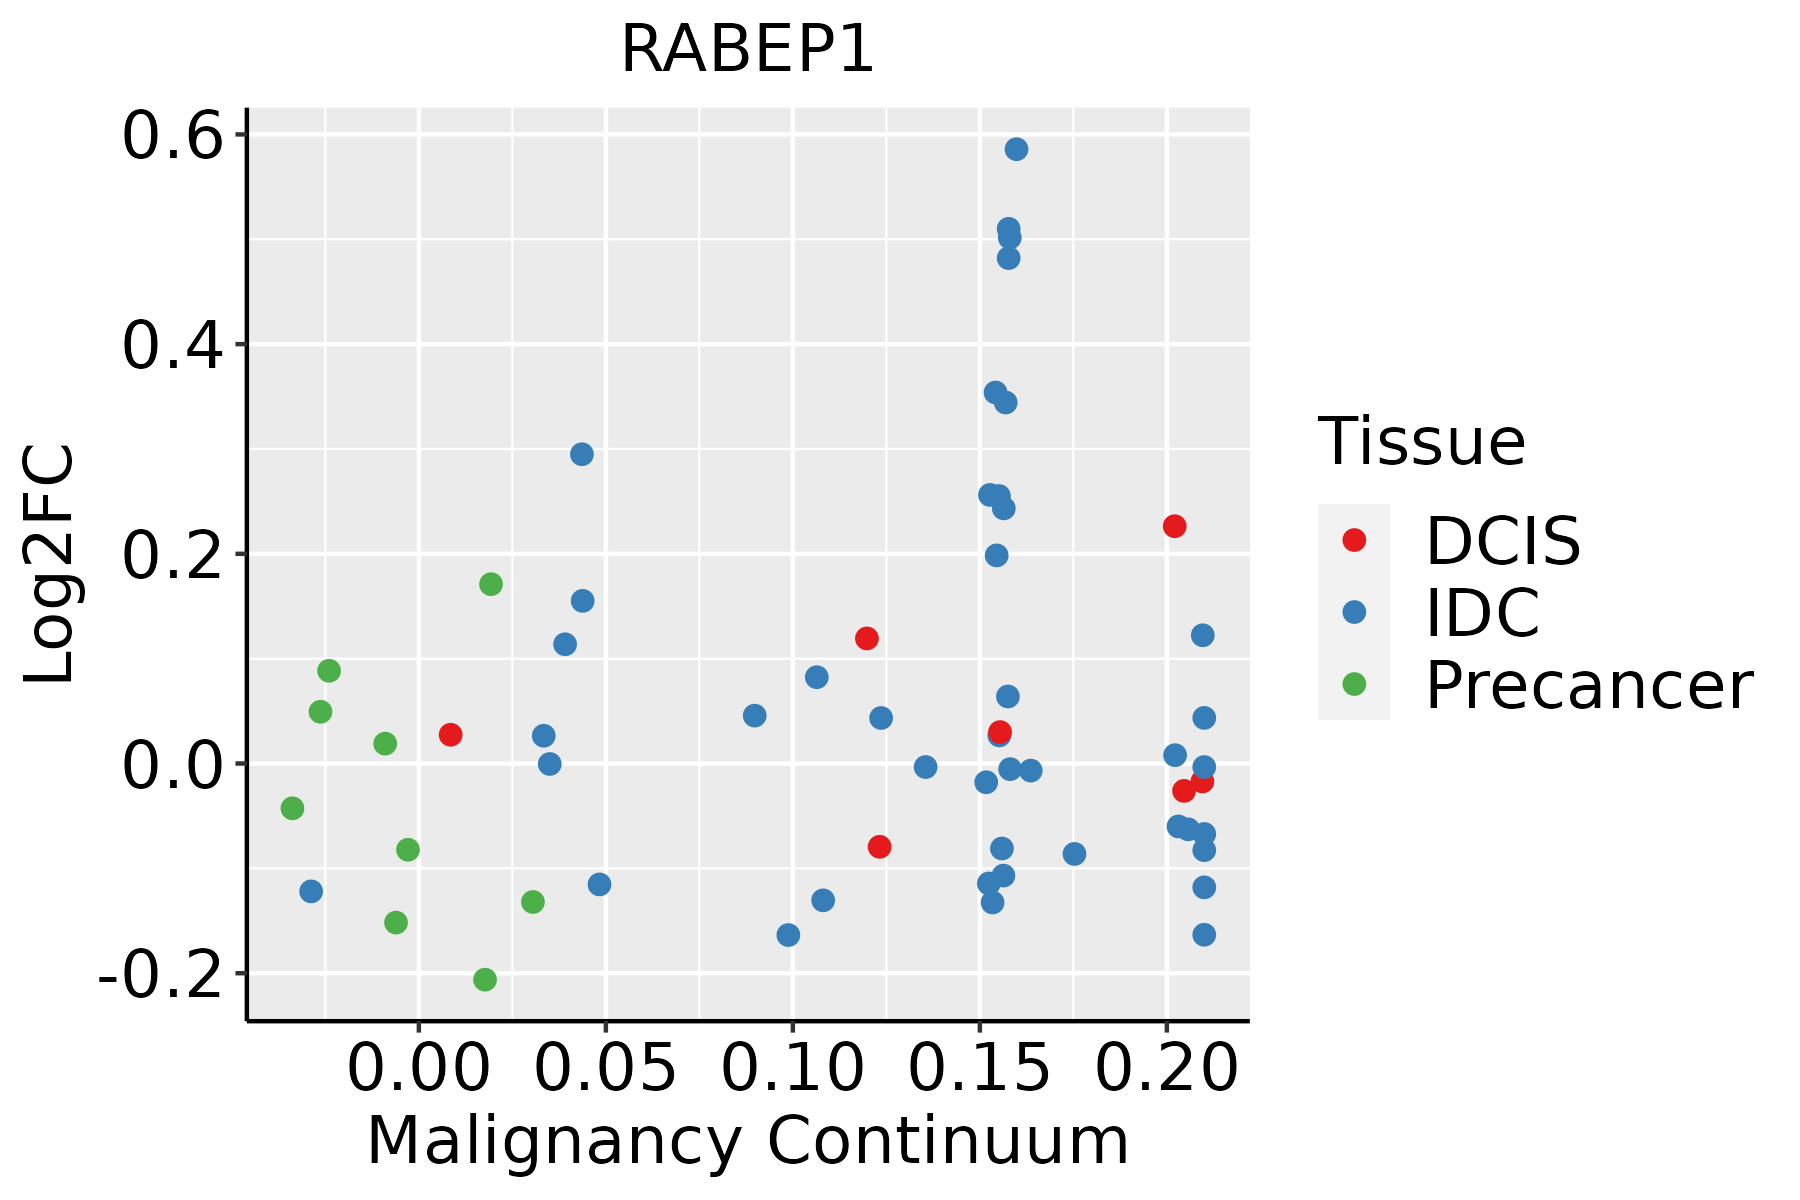 | IDC: Invasive ductal carcinoma |
| DCIS: Ductal carcinoma in situ | ||
| Precancer(BRCA1-mut): Precancerous lesion from BRCA1 mutation carriers | ||
| Esophagus | 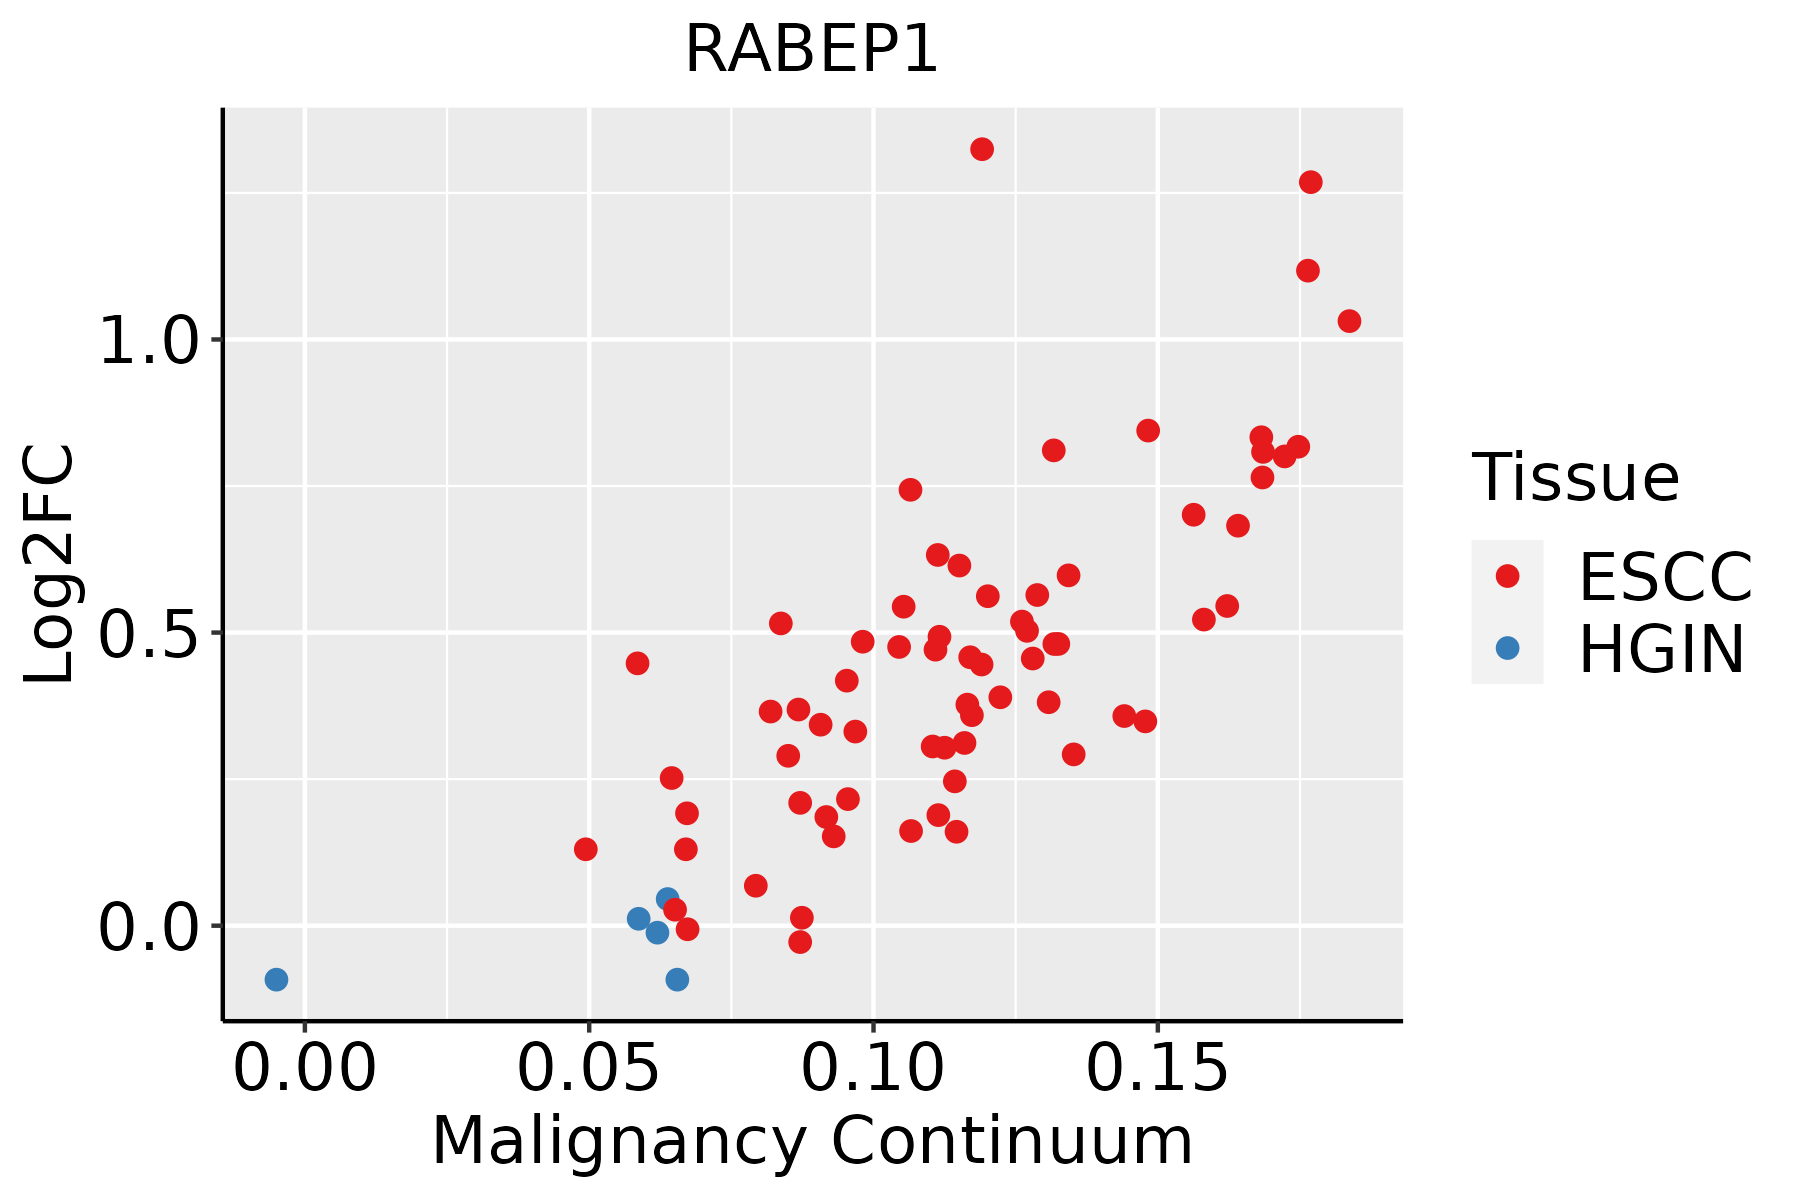 | ESCC: Esophageal squamous cell carcinoma |
| HGIN: High-grade intraepithelial neoplasias | ||
| LGIN: Low-grade intraepithelial neoplasias | ||
| Liver | 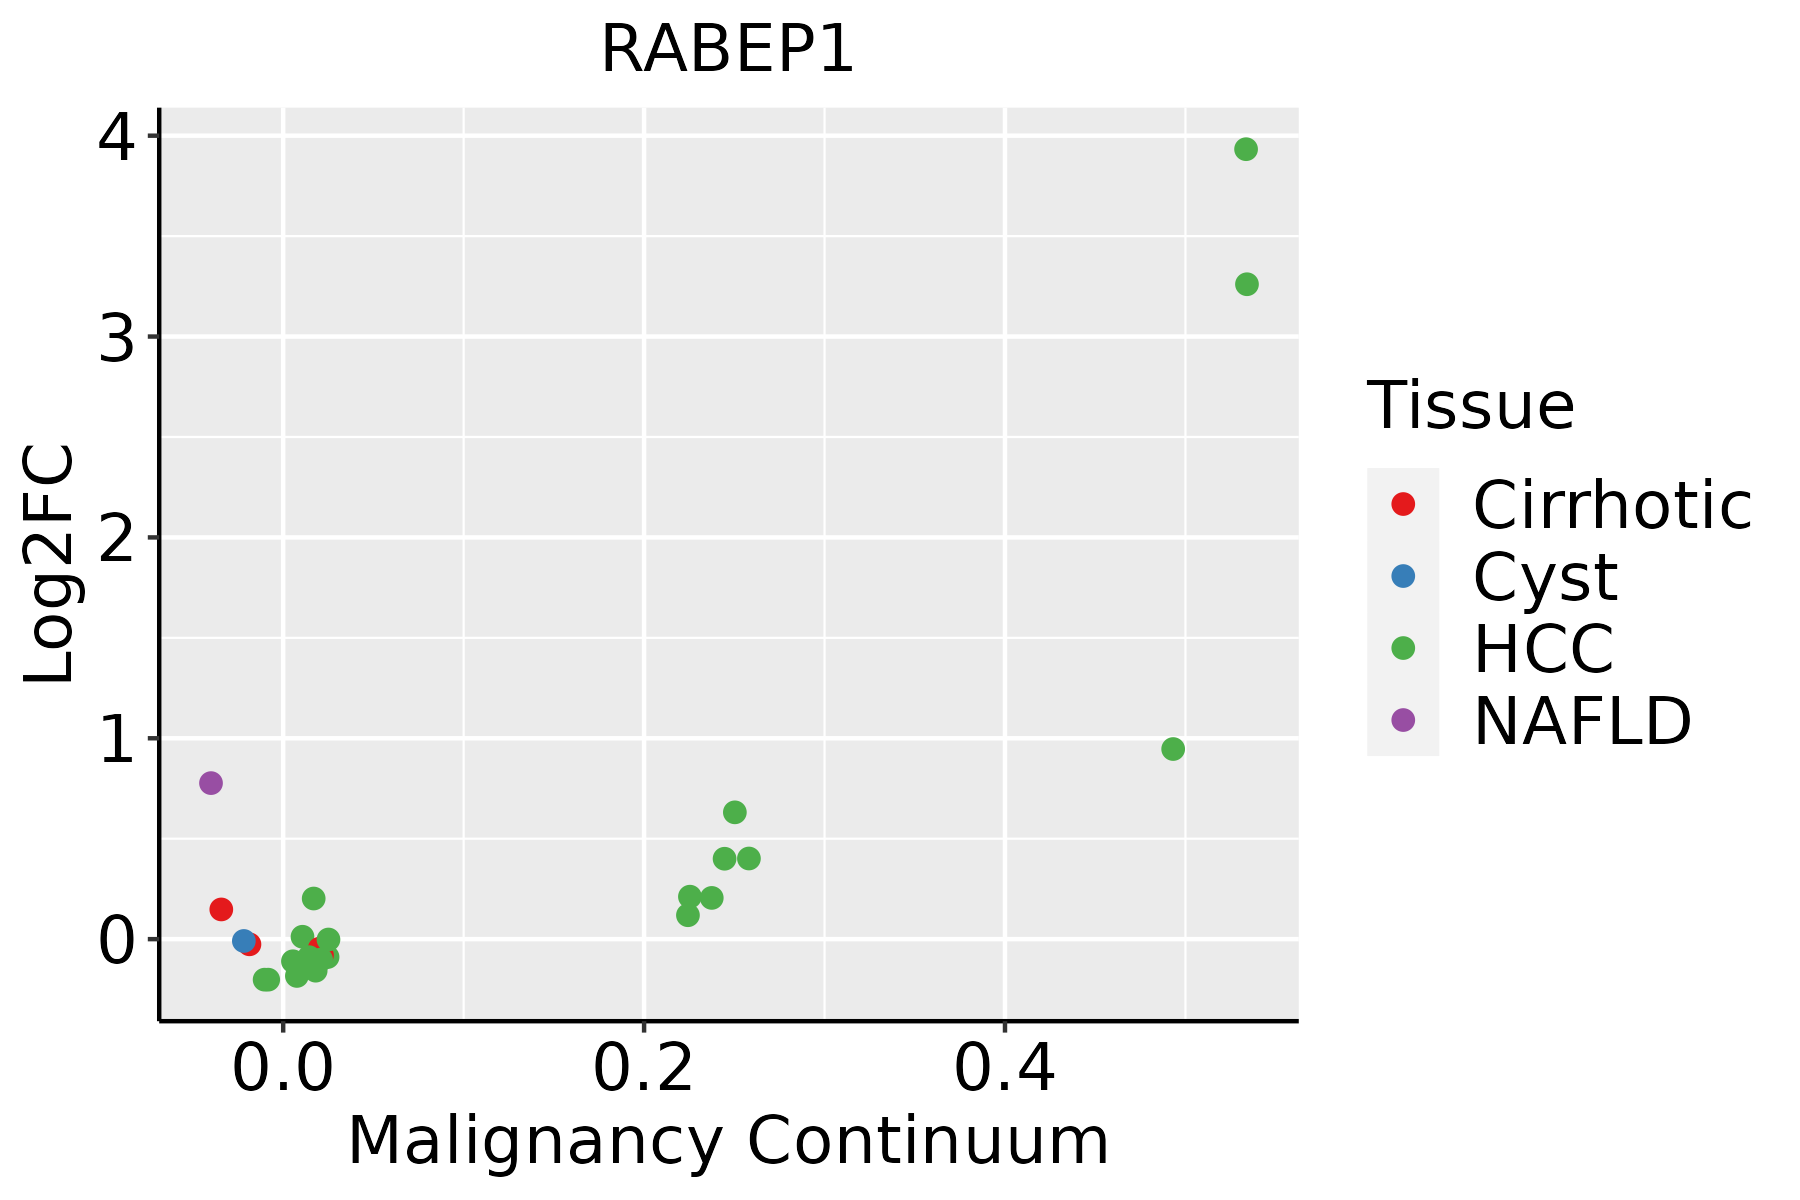 | HCC: Hepatocellular carcinoma |
| NAFLD: Non-alcoholic fatty liver disease | ||
| Oral Cavity | 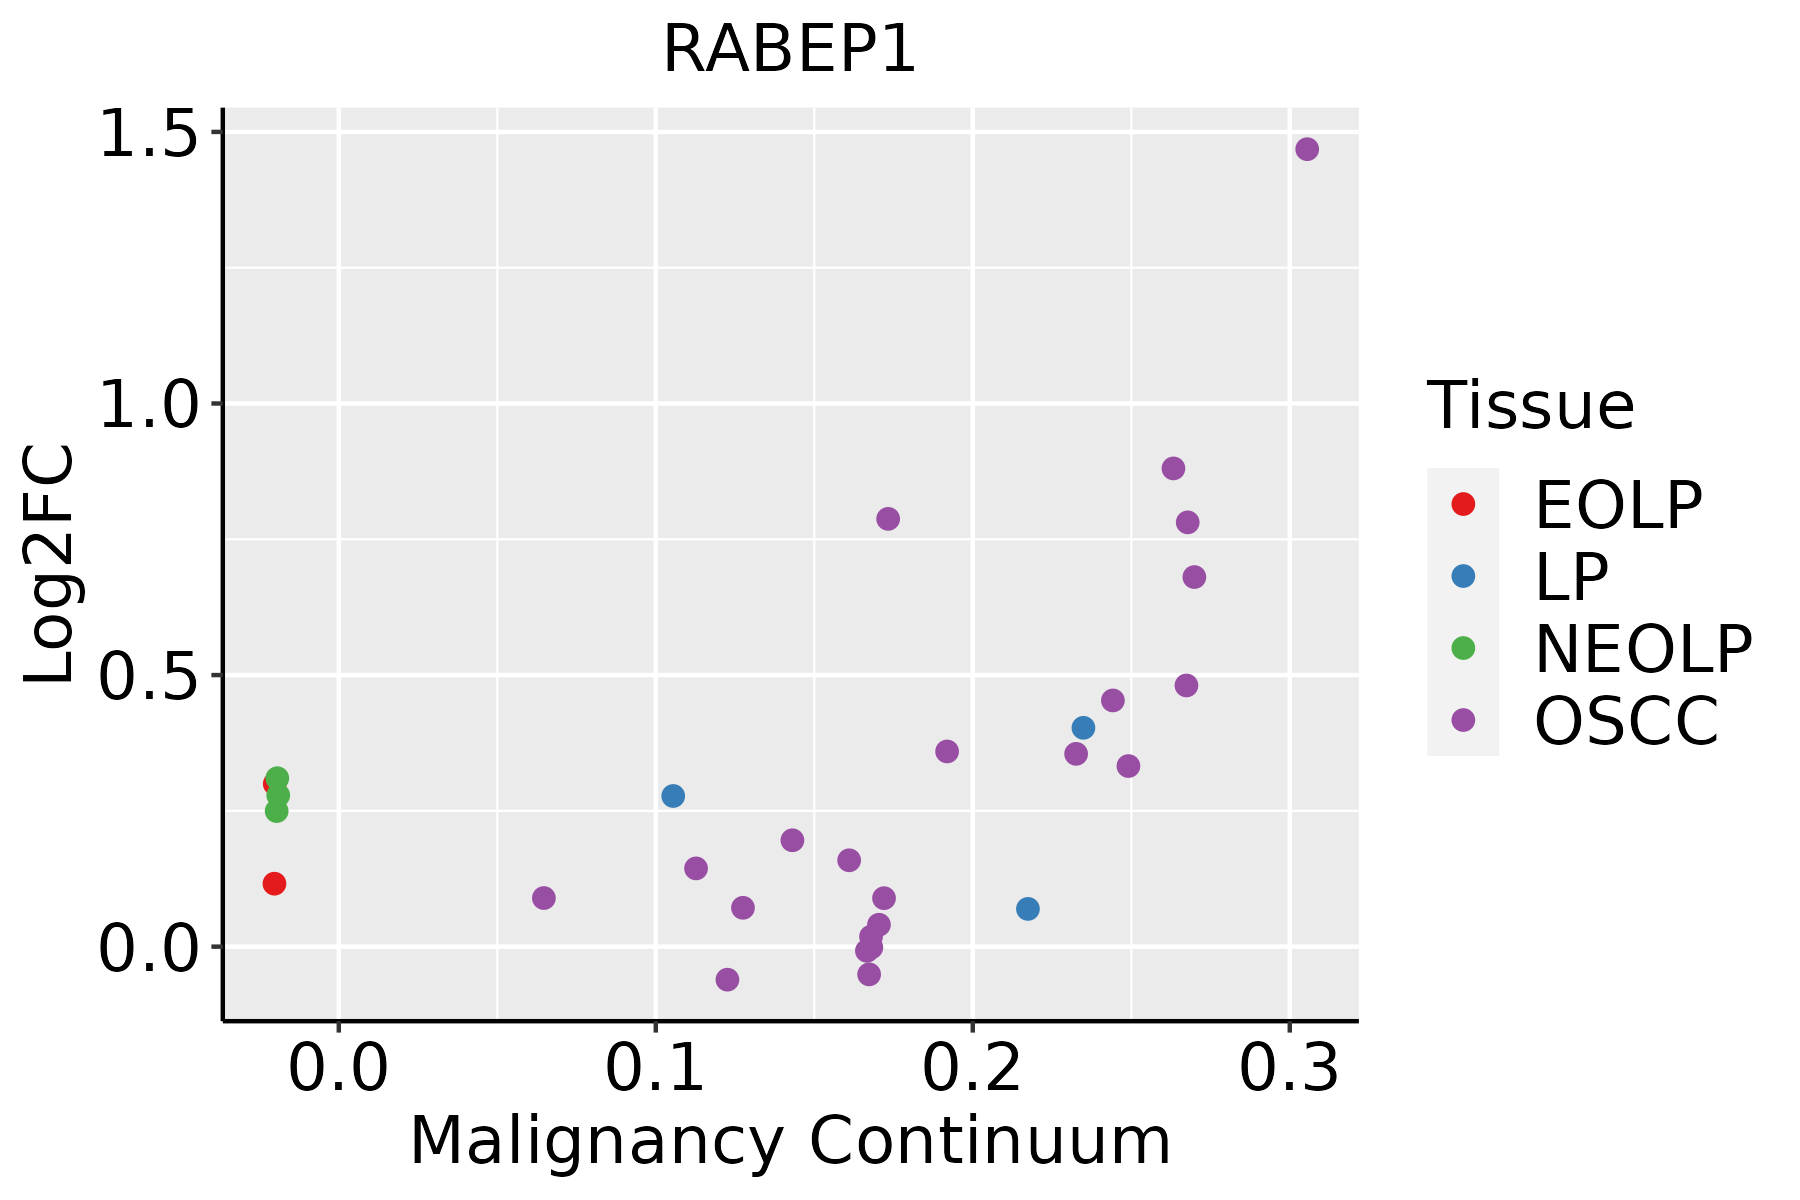 | EOLP: Erosive Oral lichen planus |
| LP: leukoplakia | ||
| NEOLP: Non-erosive oral lichen planus | ||
| OSCC: Oral squamous cell carcinoma | ||
| Prostate | 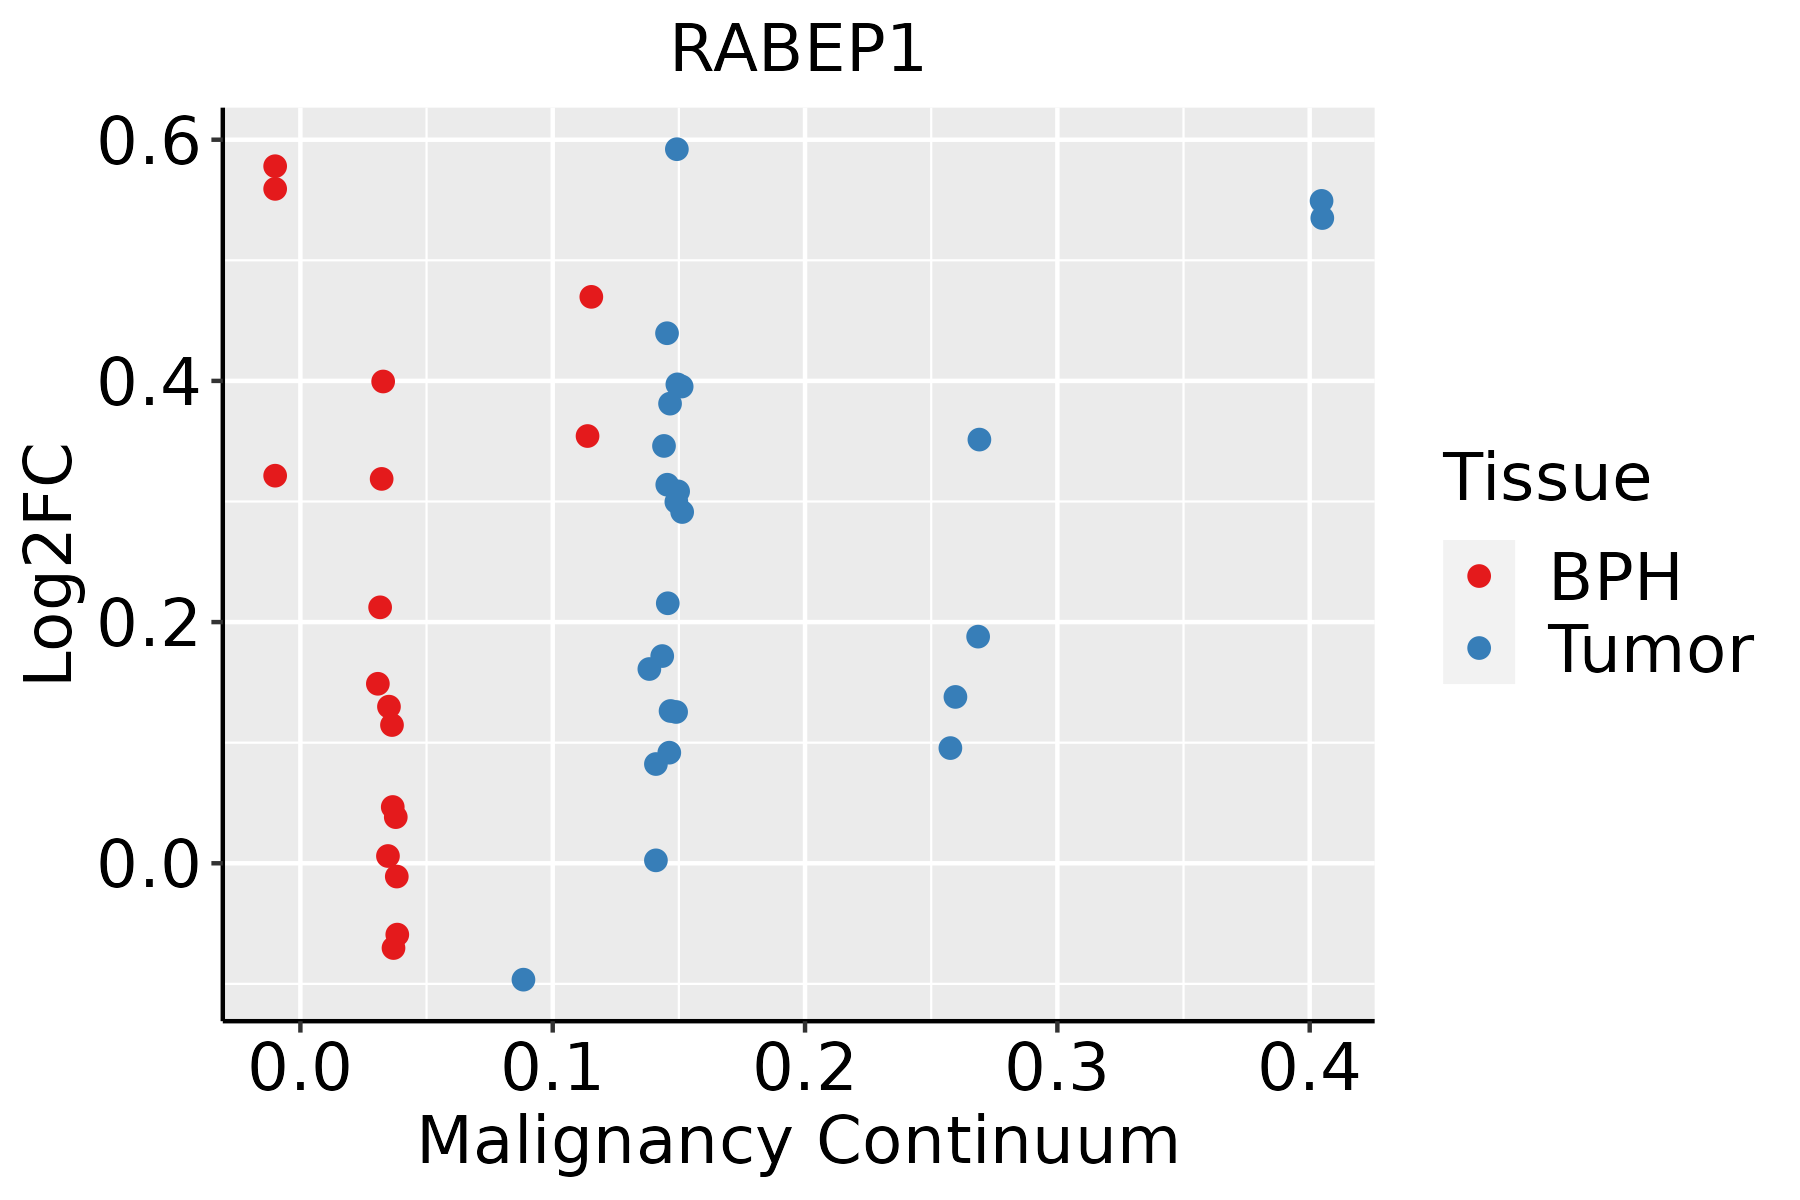 | BPH: Benign Prostatic Hyperplasia |
| Skin | 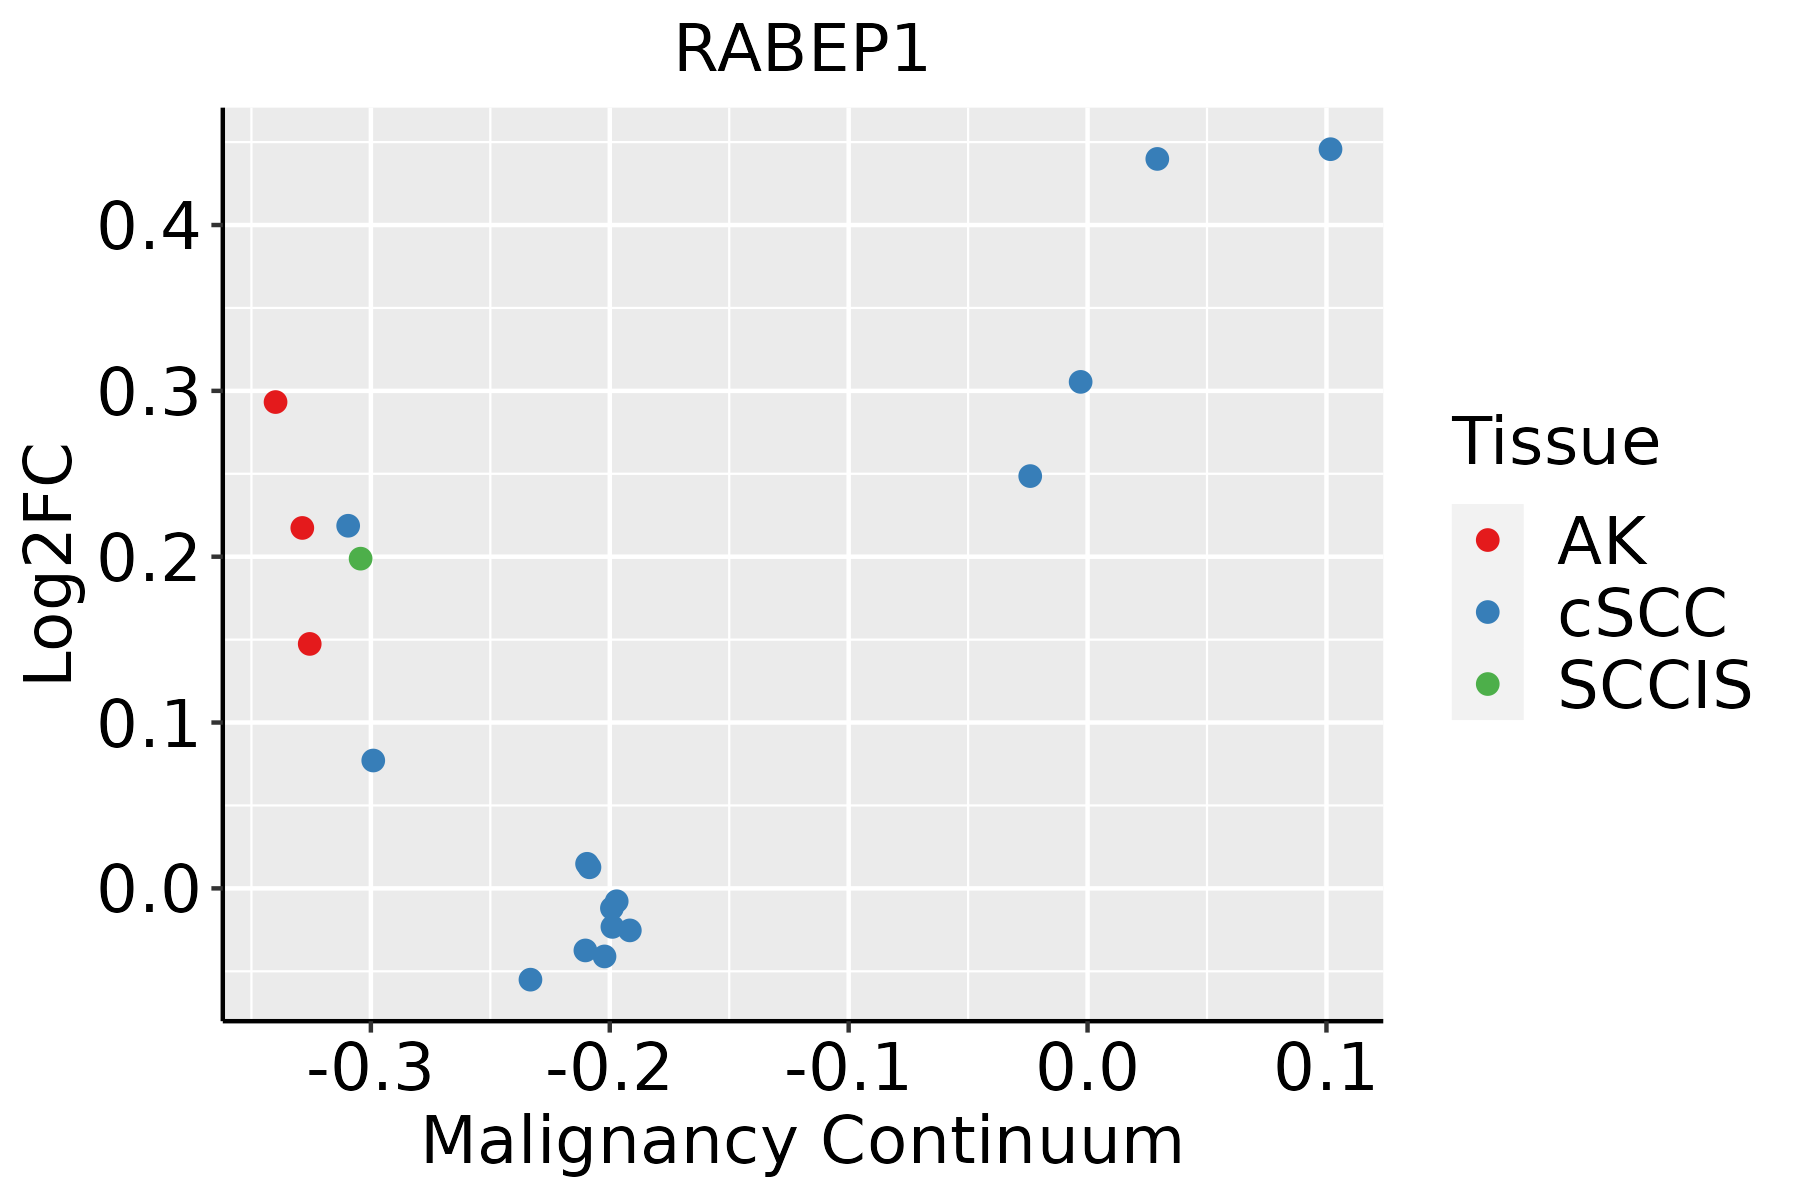 | AK: Actinic keratosis |
| cSCC: Cutaneous squamous cell carcinoma | ||
| SCCIS:squamous cell carcinoma in situ | ||
| Thyroid |  | ATC: Anaplastic thyroid cancer |
| HT: Hashimoto's thyroiditis | ||
| PTC: Papillary thyroid cancer |
| ∗log2FC in expression of this searched gene in stem-like cells from each diseased tissue sample relative to stem-like cells in normal samples in each tissue plotted against the malignancy continuum. Samples are colored based on if they are from different disease stage. |
Top |
Malignant transformation related pathway analysis |
| Find out the enriched GO biological processes and KEGG pathways involved in transition from healthy to precancer to cancer |
| Tissue | Disease Stage | Enriched GO biological Processes |
| Colorectum | AD |  |
| Colorectum | SER |  |
| Colorectum | MSS |  |
| Colorectum | MSI-H |  |
| Colorectum | FAP |  |
| ∗Top 15 enriched GO BP terms are showed in the bar plot of each disease state in each tissue. Each row represents a significant GO biological process which is colored according to the -log10(p.adjust). |
| Page: 1 2 3 4 5 6 7 8 9 |
| GO ID | Tissue | Disease Stage | Description | Gene Ratio | Bg Ratio | pvalue | p.adjust | Count |
| GO:199077815 | Prostate | Tumor | protein localization to cell periphery | 97/3246 | 333/18723 | 5.88e-08 | 1.75e-06 | 97 |
| GO:000689213 | Prostate | Tumor | post-Golgi vesicle-mediated transport | 35/3246 | 104/18723 | 4.14e-05 | 4.70e-04 | 35 |
| GO:009887613 | Prostate | Tumor | vesicle-mediated transport to the plasma membrane | 42/3246 | 136/18723 | 7.47e-05 | 7.84e-04 | 42 |
| GO:000689313 | Prostate | Tumor | Golgi to plasma membrane transport | 19/3246 | 60/18723 | 4.84e-03 | 2.37e-02 | 19 |
| GO:199077820 | Skin | AK | protein localization to cell periphery | 66/1910 | 333/18723 | 9.18e-08 | 4.21e-06 | 66 |
| GO:004819319 | Skin | AK | Golgi vesicle transport | 47/1910 | 296/18723 | 1.46e-03 | 1.06e-02 | 47 |
| GO:000689216 | Skin | AK | post-Golgi vesicle-mediated transport | 20/1910 | 104/18723 | 3.91e-03 | 2.30e-02 | 20 |
| GO:000689310 | Skin | AK | Golgi to plasma membrane transport | 13/1910 | 60/18723 | 6.62e-03 | 3.50e-02 | 13 |
| GO:009887616 | Skin | AK | vesicle-mediated transport to the plasma membrane | 23/1910 | 136/18723 | 1.05e-02 | 4.96e-02 | 23 |
| GO:0048193110 | Skin | cSCC | Golgi vesicle transport | 153/4864 | 296/18723 | 1.85e-21 | 3.41e-19 | 153 |
| GO:199077824 | Skin | cSCC | protein localization to cell periphery | 134/4864 | 333/18723 | 7.09e-09 | 2.30e-07 | 134 |
| GO:000689217 | Skin | cSCC | post-Golgi vesicle-mediated transport | 49/4864 | 104/18723 | 2.71e-06 | 4.30e-05 | 49 |
| GO:009887617 | Skin | cSCC | vesicle-mediated transport to the plasma membrane | 59/4864 | 136/18723 | 7.60e-06 | 1.04e-04 | 59 |
| GO:000689316 | Skin | cSCC | Golgi to plasma membrane transport | 30/4864 | 60/18723 | 5.67e-05 | 5.67e-04 | 30 |
| GO:00610255 | Skin | cSCC | membrane fusion | 63/4864 | 163/18723 | 2.49e-04 | 2.03e-03 | 63 |
| GO:004819320 | Thyroid | PTC | Golgi vesicle transport | 186/5968 | 296/18723 | 3.09e-28 | 1.22e-25 | 186 |
| GO:1990778111 | Thyroid | PTC | protein localization to cell periphery | 172/5968 | 333/18723 | 3.71e-14 | 2.30e-12 | 172 |
| GO:000689218 | Thyroid | PTC | post-Golgi vesicle-mediated transport | 66/5968 | 104/18723 | 3.36e-11 | 1.24e-09 | 66 |
| GO:000689317 | Thyroid | PTC | Golgi to plasma membrane transport | 41/5968 | 60/18723 | 7.26e-09 | 1.82e-07 | 41 |
| GO:009887618 | Thyroid | PTC | vesicle-mediated transport to the plasma membrane | 74/5968 | 136/18723 | 4.20e-08 | 9.08e-07 | 74 |
| Page: 1 2 3 4 |
| Pathway ID | Tissue | Disease Stage | Description | Gene Ratio | Bg Ratio | pvalue | p.adjust | qvalue | Count |
| hsa04144210 | Esophagus | ESCC | Endocytosis | 186/4205 | 251/8465 | 9.74e-16 | 4.66e-14 | 2.39e-14 | 186 |
| hsa0414437 | Esophagus | ESCC | Endocytosis | 186/4205 | 251/8465 | 9.74e-16 | 4.66e-14 | 2.39e-14 | 186 |
| hsa0414422 | Liver | HCC | Endocytosis | 178/4020 | 251/8465 | 2.03e-14 | 5.22e-13 | 2.91e-13 | 178 |
| hsa0414432 | Liver | HCC | Endocytosis | 178/4020 | 251/8465 | 2.03e-14 | 5.22e-13 | 2.91e-13 | 178 |
| hsa0414427 | Oral cavity | OSCC | Endocytosis | 174/3704 | 251/8465 | 9.42e-17 | 4.51e-15 | 2.29e-15 | 174 |
| hsa04144112 | Oral cavity | OSCC | Endocytosis | 174/3704 | 251/8465 | 9.42e-17 | 4.51e-15 | 2.29e-15 | 174 |
| hsa0414442 | Oral cavity | EOLP | Endocytosis | 71/1218 | 251/8465 | 5.28e-09 | 8.97e-08 | 5.29e-08 | 71 |
| hsa0414452 | Oral cavity | EOLP | Endocytosis | 71/1218 | 251/8465 | 5.28e-09 | 8.97e-08 | 5.29e-08 | 71 |
| hsa0414461 | Oral cavity | NEOLP | Endocytosis | 62/1112 | 251/8465 | 3.56e-07 | 4.92e-06 | 3.09e-06 | 62 |
| hsa0414471 | Oral cavity | NEOLP | Endocytosis | 62/1112 | 251/8465 | 3.56e-07 | 4.92e-06 | 3.09e-06 | 62 |
| hsa0414425 | Prostate | BPH | Endocytosis | 89/1718 | 251/8465 | 1.06e-08 | 1.29e-07 | 7.99e-08 | 89 |
| hsa04144111 | Prostate | BPH | Endocytosis | 89/1718 | 251/8465 | 1.06e-08 | 1.29e-07 | 7.99e-08 | 89 |
| hsa0414426 | Prostate | Tumor | Endocytosis | 92/1791 | 251/8465 | 7.83e-09 | 1.04e-07 | 6.43e-08 | 92 |
| hsa0414435 | Prostate | Tumor | Endocytosis | 92/1791 | 251/8465 | 7.83e-09 | 1.04e-07 | 6.43e-08 | 92 |
| Page: 1 |
Top |
Cell-cell communication analysis |
| Identification of potential cell-cell interactions between two cell types and their ligand-receptor pairs for different disease states |
| Ligand | Receptor | LRpair | Pathway | Tissue | Disease Stage |
| Page: 1 |
Top |
Single-cell gene regulatory network inference analysis |
| Find out the significant the regulons (TFs) and the target genes of each regulon across cell types for different disease states |
| TF | Cell Type | Tissue | Disease Stage | Target Gene | RSS | Regulon Activity |
| ∗The dot plots of a searched regulon are shown for all cell subpopulations in each disease state of each tissue based on the regulon specific score inferred using pySCENIC and by calculating the average expression. |
| Page: 1 |
Top |
Somatic mutation of malignant transformation related genes |
| Annotation of somatic variants for genes involved in malignant transformation |
| Hugo Symbol | Variant Class | Variant Classification | dbSNP RS | HGVSc | HGVSp | HGVSp Short | SWISSPROT | BIOTYPE | SIFT | PolyPhen | Tumor Sample Barcode | Tissue | Histology | Sex | Age | Stage | Therapy Types | Drugs | Outcome |
| RABEP1 | SNV | Missense_Mutation | c.2578N>G | p.Pro860Ala | p.P860A | Q15276 | protein_coding | deleterious_low_confidence(0) | probably_damaging(0.991) | TCGA-A2-A259-01 | Breast | breast invasive carcinoma | Female | >=65 | I/II | Hormone Therapy | arimidex | SD | |
| RABEP1 | SNV | Missense_Mutation | novel | c.1346N>A | p.Ser449Tyr | p.S449Y | Q15276 | protein_coding | deleterious(0.03) | possibly_damaging(0.453) | TCGA-AN-A046-01 | Breast | breast invasive carcinoma | Female | >=65 | I/II | Unknown | Unknown | SD |
| RABEP1 | SNV | Missense_Mutation | rs773135833 | c.376N>T | p.Arg126Cys | p.R126C | Q15276 | protein_coding | tolerated(0.21) | benign(0.017) | TCGA-AO-A03R-01 | Breast | breast invasive carcinoma | Female | <65 | I/II | Chemotherapy | doxorubicin | SD |
| RABEP1 | insertion | Frame_Shift_Ins | novel | c.2451_2452insGAAAATGT | p.Gln818GlufsTer8 | p.Q818Efs*8 | Q15276 | protein_coding | TCGA-A7-A0CG-01 | Breast | breast invasive carcinoma | Female | >=65 | I/II | Unknown | Unknown | SD | ||
| RABEP1 | insertion | Nonsense_Mutation | novel | c.2452_2453insATTCCATTTGACTGATGTATCAAATCCTA | p.Gln818HisfsTer4 | p.Q818Hfs*4 | Q15276 | protein_coding | TCGA-A7-A0CG-01 | Breast | breast invasive carcinoma | Female | >=65 | I/II | Unknown | Unknown | SD | ||
| RABEP1 | deletion | In_Frame_Del | c.2253_2261delNNNNNNNNN | p.Val753_Lys755del | p.V753_K755del | Q15276 | protein_coding | TCGA-AR-A0TS-01 | Breast | breast invasive carcinoma | Female | <65 | I/II | Chemotherapy | doxorubicin | SD | |||
| RABEP1 | deletion | Frame_Shift_Del | novel | c.1951delA | p.Ser651ValfsTer32 | p.S651Vfs*32 | Q15276 | protein_coding | TCGA-UL-AAZ6-01 | Breast | breast invasive carcinoma | Female | >=65 | I/II | Chemotherapy | herceptin | SD | ||
| RABEP1 | SNV | Missense_Mutation | rs375323638 | c.1063N>A | p.Glu355Lys | p.E355K | Q15276 | protein_coding | tolerated(0.17) | benign(0.058) | TCGA-2W-A8YY-01 | Cervix | cervical & endocervical cancer | Female | <65 | I/II | Chemotherapy | cisplatin | CR |
| RABEP1 | SNV | Missense_Mutation | novel | c.2299C>G | p.Gln767Glu | p.Q767E | Q15276 | protein_coding | tolerated(0.92) | benign(0.003) | TCGA-JW-A5VL-01 | Cervix | cervical & endocervical cancer | Female | <65 | I/II | Unknown | Unknown | SD |
| RABEP1 | SNV | Missense_Mutation | c.1060C>G | p.Gln354Glu | p.Q354E | Q15276 | protein_coding | tolerated(0.6) | benign(0.001) | TCGA-JX-A3Q0-01 | Cervix | cervical & endocervical cancer | Female | <65 | III/IV | Unknown | Unknown | SD |
| Page: 1 2 3 4 5 6 7 |
Top |
Related drugs of malignant transformation related genes |
| Identification of chemicals and drugs interact with genes involved in malignant transfromation |
| (DGIdb 4.0) |
| Entrez ID | Symbol | Category | Interaction Types | Drug Claim Name | Drug Name | PMIDs |
| 9135 | RABEP1 | CLINICALLY ACTIONABLE, GROWTH FACTOR | lithium | LITHIUM | 28694205 | |
| 9135 | RABEP1 | CLINICALLY ACTIONABLE, GROWTH FACTOR | amisulpride | AMISULPRIDE | 28694205 | |
| 9135 | RABEP1 | CLINICALLY ACTIONABLE, GROWTH FACTOR | valproic acid | 28694205 | ||
| 9135 | RABEP1 | CLINICALLY ACTIONABLE, GROWTH FACTOR | risperidone | RISPERIDONE | 28694205 | |
| 9135 | RABEP1 | CLINICALLY ACTIONABLE, GROWTH FACTOR | olanzapine | OLANZAPINE | 28694205 | |
| 9135 | RABEP1 | CLINICALLY ACTIONABLE, GROWTH FACTOR | mirtazapine | MIRTAZAPINE | 28694205 | |
| 9135 | RABEP1 | CLINICALLY ACTIONABLE, GROWTH FACTOR | clozapine | CLOZAPINE | 28694205 | |
| 9135 | RABEP1 | CLINICALLY ACTIONABLE, GROWTH FACTOR | aripiprazole | ARIPIPRAZOLE | 28694205 | |
| 9135 | RABEP1 | CLINICALLY ACTIONABLE, GROWTH FACTOR | quetiapine | QUETIAPINE | 28694205 | |
| 9135 | RABEP1 | CLINICALLY ACTIONABLE, GROWTH FACTOR | paliperidone | PALIPERIDONE | 28694205 |
| Page: 1 |

Copyright 2023-Present -The University of Texas Health Science Center at Houston |