
|
|||||
|
 | |
| |
| |
| |
| |
| |
|
Gene: PPP1R2 |
Gene summary for PPP1R2 |
| Gene information | Species | Human | Gene symbol | PPP1R2 | Gene ID | 5504 |
| Gene name | protein phosphatase 1 regulatory inhibitor subunit 2 | |
| Gene Alias | IPP-2 | |
| Cytomap | 3q29 | |
| Gene Type | protein-coding | GO ID | GO:0005975 | UniProtAcc | P41236 |
Top |
Malignant transformation analysis |
| Identification of the aberrant gene expression in precancerous and cancerous lesions by comparing the gene expression of stem-like cells in diseased tissues with normal stem cells |
| Entrez ID | Symbol | Replicates | Species | Organ | Tissue | Adj P-value | Log2FC | Malignancy |
| 5504 | PPP1R2 | LZE2T | Human | Esophagus | ESCC | 4.64e-09 | 8.91e-01 | 0.082 |
| 5504 | PPP1R2 | LZE4T | Human | Esophagus | ESCC | 1.51e-40 | 1.58e+00 | 0.0811 |
| 5504 | PPP1R2 | LZE7T | Human | Esophagus | ESCC | 2.26e-21 | 1.46e+00 | 0.0667 |
| 5504 | PPP1R2 | LZE8T | Human | Esophagus | ESCC | 1.63e-22 | 8.29e-01 | 0.067 |
| 5504 | PPP1R2 | LZE20T | Human | Esophagus | ESCC | 1.86e-13 | 6.48e-01 | 0.0662 |
| 5504 | PPP1R2 | LZE22D1 | Human | Esophagus | HGIN | 9.73e-04 | 1.68e-01 | 0.0595 |
| 5504 | PPP1R2 | LZE22T | Human | Esophagus | ESCC | 1.47e-02 | 7.57e-01 | 0.068 |
| 5504 | PPP1R2 | LZE24T | Human | Esophagus | ESCC | 4.27e-43 | 1.47e+00 | 0.0596 |
| 5504 | PPP1R2 | LZE21T | Human | Esophagus | ESCC | 1.75e-18 | 1.85e+00 | 0.0655 |
| 5504 | PPP1R2 | LZE6T | Human | Esophagus | ESCC | 9.01e-20 | 1.22e+00 | 0.0845 |
| 5504 | PPP1R2 | P1T-E | Human | Esophagus | ESCC | 2.16e-20 | 1.30e+00 | 0.0875 |
| 5504 | PPP1R2 | P2T-E | Human | Esophagus | ESCC | 8.05e-100 | 1.97e+00 | 0.1177 |
| 5504 | PPP1R2 | P4T-E | Human | Esophagus | ESCC | 9.74e-79 | 2.34e+00 | 0.1323 |
| 5504 | PPP1R2 | P5T-E | Human | Esophagus | ESCC | 1.07e-65 | 1.70e+00 | 0.1327 |
| 5504 | PPP1R2 | P8T-E | Human | Esophagus | ESCC | 1.82e-56 | 1.08e+00 | 0.0889 |
| 5504 | PPP1R2 | P9T-E | Human | Esophagus | ESCC | 1.54e-52 | 1.44e+00 | 0.1131 |
| 5504 | PPP1R2 | P10T-E | Human | Esophagus | ESCC | 6.16e-56 | 1.12e+00 | 0.116 |
| 5504 | PPP1R2 | P11T-E | Human | Esophagus | ESCC | 6.64e-27 | 1.30e+00 | 0.1426 |
| 5504 | PPP1R2 | P12T-E | Human | Esophagus | ESCC | 2.24e-66 | 1.39e+00 | 0.1122 |
| 5504 | PPP1R2 | P15T-E | Human | Esophagus | ESCC | 2.65e-67 | 1.74e+00 | 0.1149 |
| Page: 1 2 3 4 5 6 7 |
| Tissue | Expression Dynamics | Abbreviation |
| Esophagus |  | ESCC: Esophageal squamous cell carcinoma |
| HGIN: High-grade intraepithelial neoplasias | ||
| LGIN: Low-grade intraepithelial neoplasias | ||
| Liver | 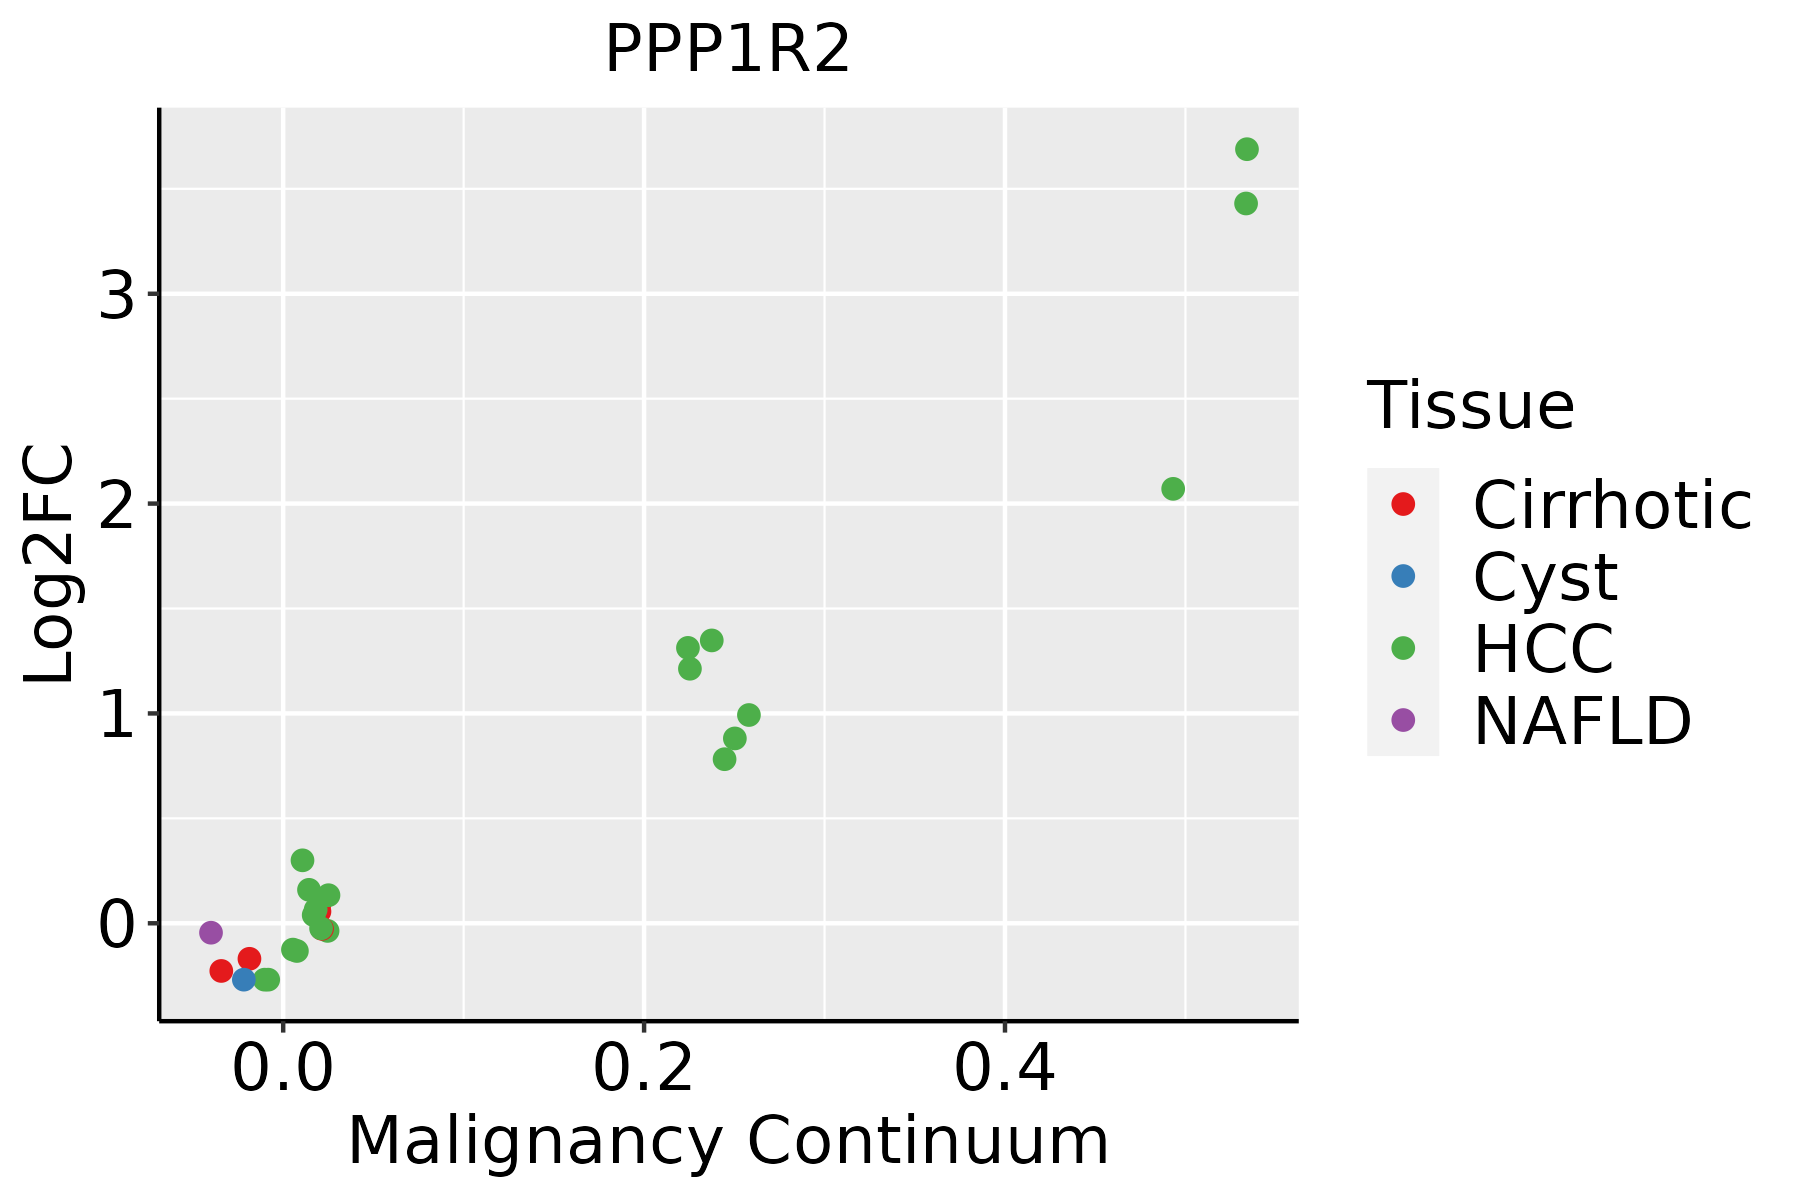 | HCC: Hepatocellular carcinoma |
| NAFLD: Non-alcoholic fatty liver disease | ||
| Oral Cavity |  | EOLP: Erosive Oral lichen planus |
| LP: leukoplakia | ||
| NEOLP: Non-erosive oral lichen planus | ||
| OSCC: Oral squamous cell carcinoma | ||
| Skin | 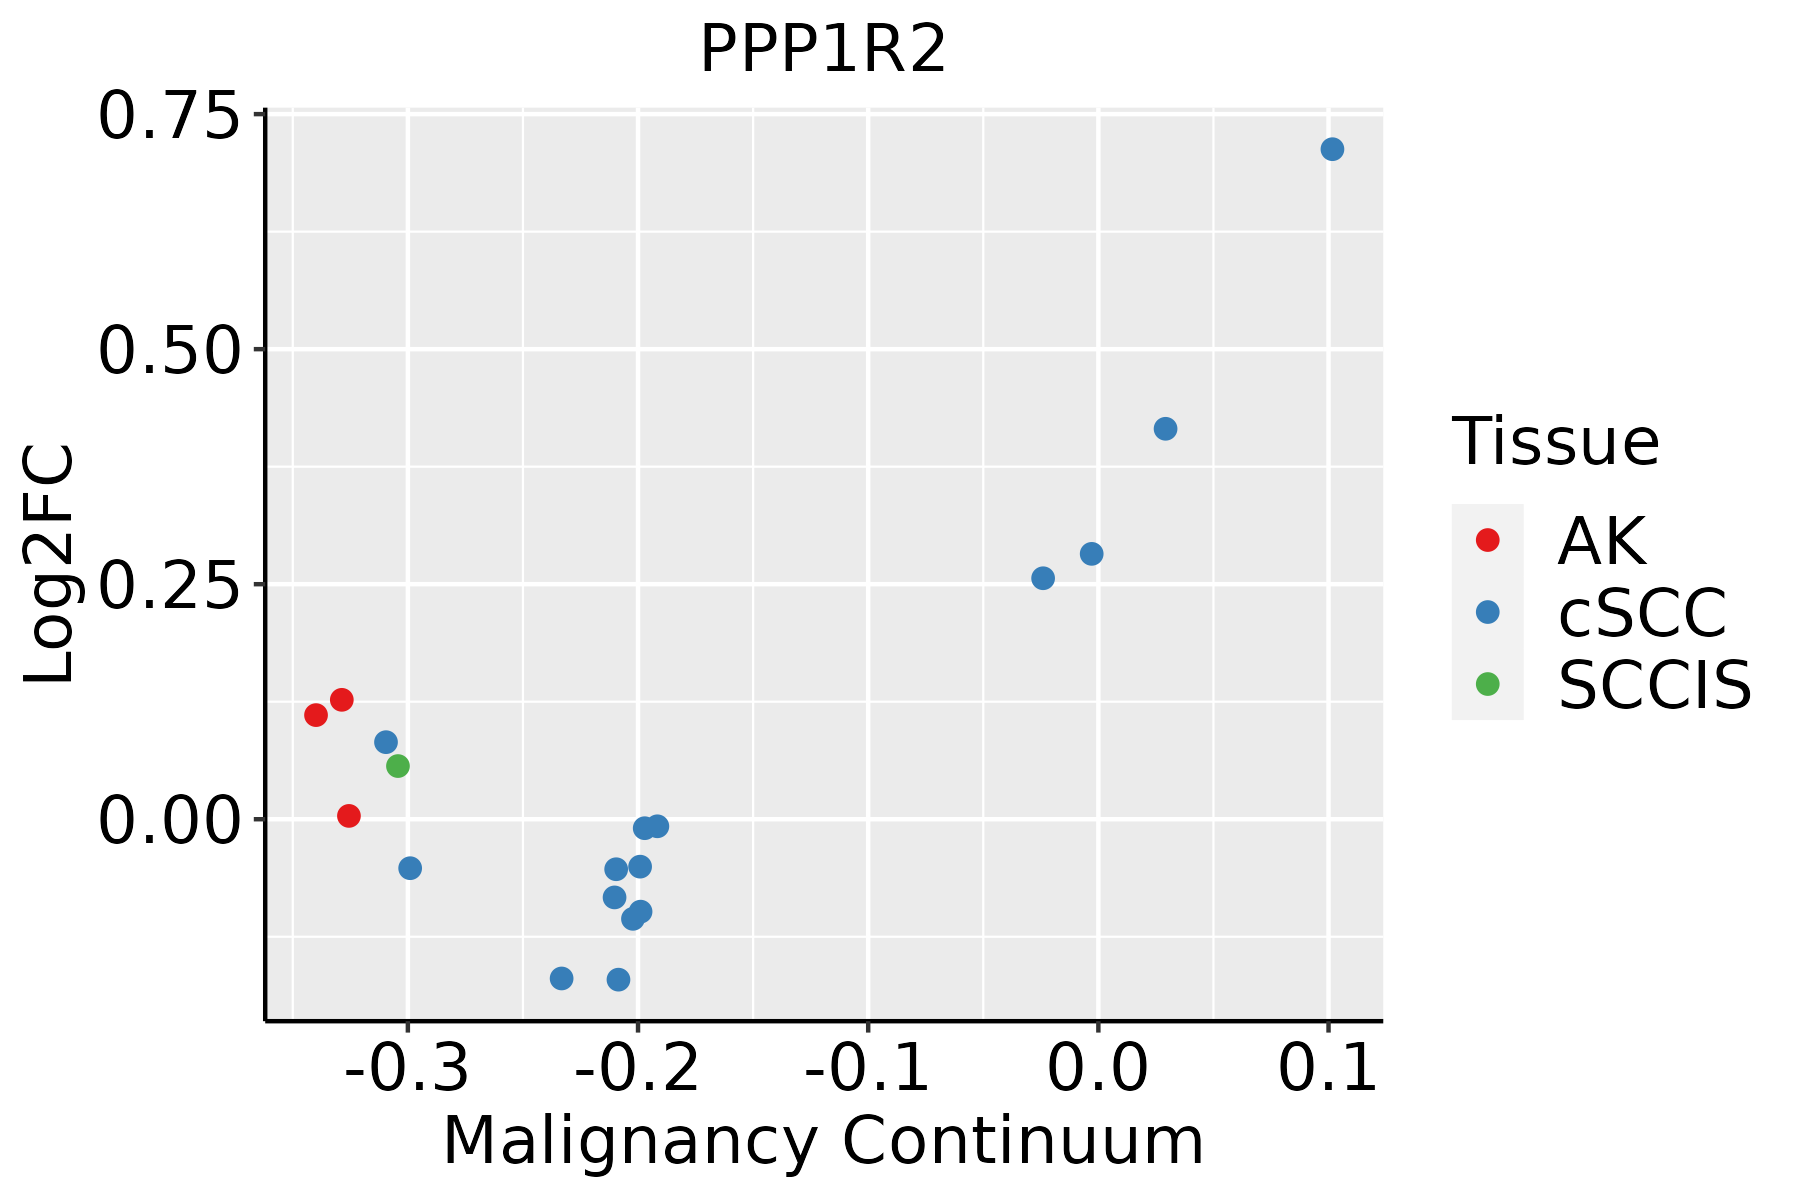 | AK: Actinic keratosis |
| cSCC: Cutaneous squamous cell carcinoma | ||
| SCCIS:squamous cell carcinoma in situ | ||
| Thyroid | 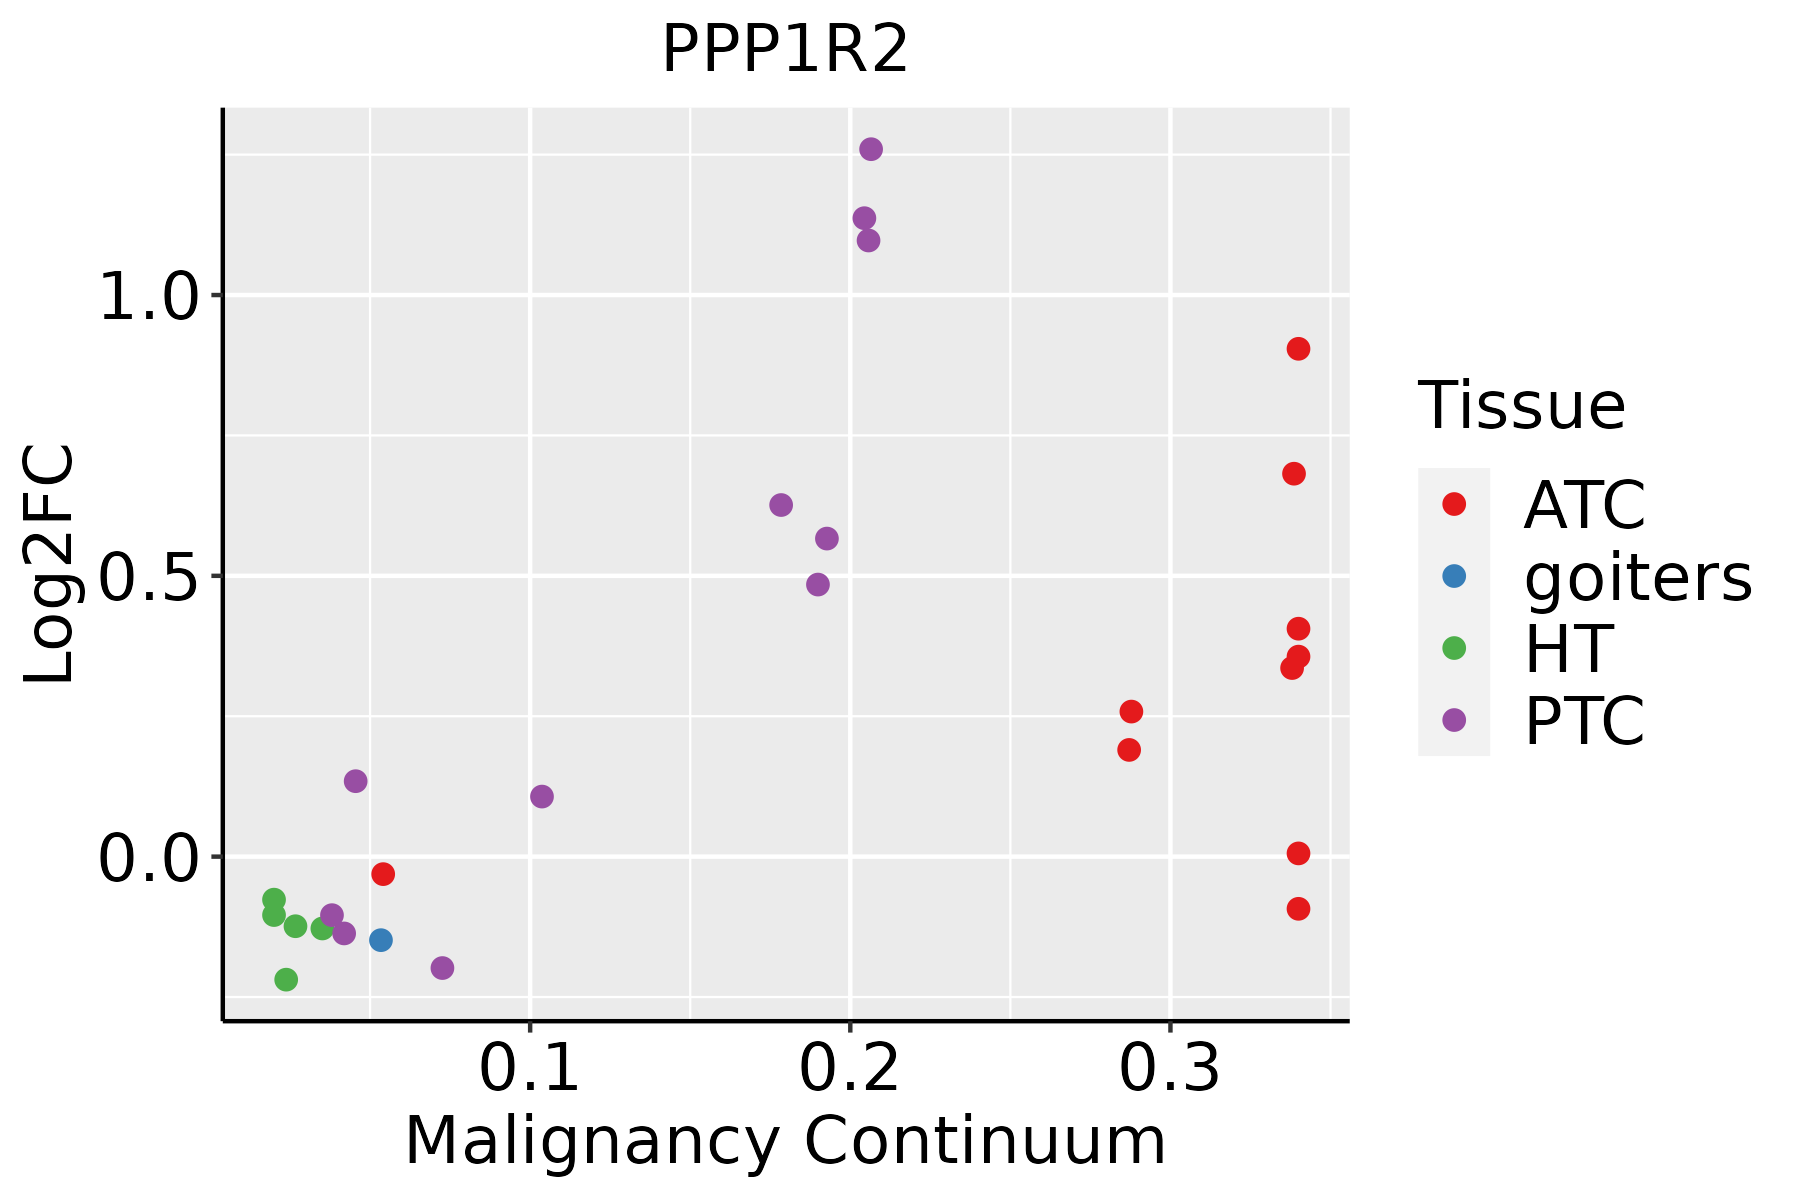 | ATC: Anaplastic thyroid cancer |
| HT: Hashimoto's thyroiditis | ||
| PTC: Papillary thyroid cancer |
| ∗log2FC in expression of this searched gene in stem-like cells from each diseased tissue sample relative to stem-like cells in normal samples in each tissue plotted against the malignancy continuum. Samples are colored based on if they are from different disease stage. |
Top |
Malignant transformation related pathway analysis |
| Find out the enriched GO biological processes and KEGG pathways involved in transition from healthy to precancer to cancer |
| Tissue | Disease Stage | Enriched GO biological Processes |
| Colorectum | AD |  |
| Colorectum | SER |  |
| Colorectum | MSS |  |
| Colorectum | MSI-H |  |
| Colorectum | FAP |  |
| ∗Top 15 enriched GO BP terms are showed in the bar plot of each disease state in each tissue. Each row represents a significant GO biological process which is colored according to the -log10(p.adjust). |
| Page: 1 2 3 4 5 6 7 8 9 |
| GO ID | Tissue | Disease Stage | Description | Gene Ratio | Bg Ratio | pvalue | p.adjust | Count |
| GO:00442641 | Liver | HCC | cellular polysaccharide metabolic process | 52/7958 | 96/18723 | 1.38e-02 | 4.91e-02 | 52 |
| GO:000609118 | Oral cavity | OSCC | generation of precursor metabolites and energy | 286/7305 | 490/18723 | 1.45e-18 | 1.71e-16 | 286 |
| GO:001598018 | Oral cavity | OSCC | energy derivation by oxidation of organic compounds | 190/7305 | 318/18723 | 4.10e-14 | 2.26e-12 | 190 |
| GO:000647015 | Oral cavity | OSCC | protein dephosphorylation | 162/7305 | 281/18723 | 1.56e-10 | 4.56e-09 | 162 |
| GO:00163119 | Oral cavity | OSCC | dephosphorylation | 220/7305 | 417/18723 | 6.33e-09 | 1.34e-07 | 220 |
| GO:003530319 | Oral cavity | OSCC | regulation of dephosphorylation | 80/7305 | 128/18723 | 6.10e-08 | 1.10e-06 | 80 |
| GO:003530420 | Oral cavity | OSCC | regulation of protein dephosphorylation | 60/7305 | 90/18723 | 9.75e-08 | 1.67e-06 | 60 |
| GO:004366617 | Oral cavity | OSCC | regulation of phosphoprotein phosphatase activity | 35/7305 | 58/18723 | 8.06e-04 | 4.32e-03 | 35 |
| GO:001092110 | Oral cavity | OSCC | regulation of phosphatase activity | 46/7305 | 84/18723 | 2.43e-03 | 1.07e-02 | 46 |
| GO:00442625 | Oral cavity | OSCC | cellular carbohydrate metabolic process | 130/7305 | 283/18723 | 9.98e-03 | 3.49e-02 | 130 |
| GO:000609119 | Oral cavity | LP | generation of precursor metabolites and energy | 214/4623 | 490/18723 | 1.12e-20 | 2.60e-18 | 214 |
| GO:001598019 | Oral cavity | LP | energy derivation by oxidation of organic compounds | 145/4623 | 318/18723 | 2.44e-16 | 3.64e-14 | 145 |
| GO:0035303110 | Oral cavity | LP | regulation of dephosphorylation | 52/4623 | 128/18723 | 4.98e-05 | 7.01e-04 | 52 |
| GO:0035304110 | Oral cavity | LP | regulation of protein dephosphorylation | 39/4623 | 90/18723 | 8.11e-05 | 1.04e-03 | 39 |
| GO:000647016 | Oral cavity | LP | protein dephosphorylation | 89/4623 | 281/18723 | 4.60e-03 | 2.93e-02 | 89 |
| GO:004366618 | Oral cavity | LP | regulation of phosphoprotein phosphatase activity | 23/4623 | 58/18723 | 8.34e-03 | 4.52e-02 | 23 |
| GO:000647023 | Oral cavity | EOLP | protein dephosphorylation | 72/2218 | 281/18723 | 1.19e-10 | 1.35e-08 | 72 |
| GO:003530424 | Oral cavity | EOLP | regulation of protein dephosphorylation | 32/2218 | 90/18723 | 4.22e-09 | 2.41e-07 | 32 |
| GO:003530322 | Oral cavity | EOLP | regulation of dephosphorylation | 39/2218 | 128/18723 | 1.39e-08 | 6.43e-07 | 39 |
| GO:004366623 | Oral cavity | EOLP | regulation of phosphoprotein phosphatase activity | 22/2218 | 58/18723 | 2.98e-07 | 8.87e-06 | 22 |
| Page: 1 2 3 4 5 |
| Pathway ID | Tissue | Disease Stage | Description | Gene Ratio | Bg Ratio | pvalue | p.adjust | qvalue | Count |
| Page: 1 |
Top |
Cell-cell communication analysis |
| Identification of potential cell-cell interactions between two cell types and their ligand-receptor pairs for different disease states |
| Ligand | Receptor | LRpair | Pathway | Tissue | Disease Stage |
| Page: 1 |
Top |
Single-cell gene regulatory network inference analysis |
| Find out the significant the regulons (TFs) and the target genes of each regulon across cell types for different disease states |
| TF | Cell Type | Tissue | Disease Stage | Target Gene | RSS | Regulon Activity |
| ∗The dot plots of a searched regulon are shown for all cell subpopulations in each disease state of each tissue based on the regulon specific score inferred using pySCENIC and by calculating the average expression. |
| Page: 1 |
Top |
Somatic mutation of malignant transformation related genes |
| Annotation of somatic variants for genes involved in malignant transformation |
| Hugo Symbol | Variant Class | Variant Classification | dbSNP RS | HGVSc | HGVSp | HGVSp Short | SWISSPROT | BIOTYPE | SIFT | PolyPhen | Tumor Sample Barcode | Tissue | Histology | Sex | Age | Stage | Therapy Types | Drugs | Outcome |
| PPP1R2 | insertion | In_Frame_Ins | novel | c.32_33insGAAGCAGGA | p.Ile11delinsMetLysGlnAsp | p.I11delinsMKQD | P41236 | protein_coding | TCGA-AO-A03R-01 | Breast | breast invasive carcinoma | Female | <65 | I/II | Chemotherapy | doxorubicin | SD | ||
| PPP1R2 | insertion | Nonsense_Mutation | novel | c.356_357insGTAGATAGCTTAGGG | p.Gln119_Glu120insTer | p.Q119_E120ins* | P41236 | protein_coding | TCGA-AQ-A04J-01 | Breast | breast invasive carcinoma | Female | <65 | I/II | Chemotherapy | cytoxan | SD | ||
| PPP1R2 | SNV | Missense_Mutation | rs751525820 | c.344N>A | p.Arg115Gln | p.R115Q | P41236 | protein_coding | tolerated(0.93) | benign(0.005) | TCGA-A6-2686-01 | Colorectum | colon adenocarcinoma | Female | >=65 | I/II | Unknown | Unknown | SD |
| PPP1R2 | SNV | Missense_Mutation | c.254N>T | p.Ala85Val | p.A85V | P41236 | protein_coding | tolerated(0.1) | benign(0.373) | TCGA-AD-5900-01 | Colorectum | colon adenocarcinoma | Male | >=65 | I/II | Unknown | Unknown | SD | |
| PPP1R2 | SNV | Missense_Mutation | c.287N>T | p.Ala96Val | p.A96V | P41236 | protein_coding | tolerated(0.08) | benign(0.003) | TCGA-AZ-4615-01 | Colorectum | colon adenocarcinoma | Male | >=65 | III/IV | Chemotherapy | xeloda | PD | |
| PPP1R2 | SNV | Missense_Mutation | rs751525820 | c.344N>A | p.Arg115Gln | p.R115Q | P41236 | protein_coding | tolerated(0.93) | benign(0.005) | TCGA-D5-6930-01 | Colorectum | colon adenocarcinoma | Male | >=65 | I/II | Unknown | Unknown | SD |
| PPP1R2 | SNV | Missense_Mutation | c.388N>A | p.Ser130Thr | p.S130T | P41236 | protein_coding | tolerated(0.44) | benign(0.033) | TCGA-AG-3728-01 | Colorectum | rectum adenocarcinoma | Male | >=65 | III/IV | Chemotherapy | folinic | CR | |
| PPP1R2 | SNV | Missense_Mutation | c.493N>A | p.Leu165Ile | p.L165I | P41236 | protein_coding | deleterious(0.02) | probably_damaging(0.953) | TCGA-AG-A002-01 | Colorectum | rectum adenocarcinoma | Male | <65 | I/II | Unknown | Unknown | SD | |
| PPP1R2 | SNV | Missense_Mutation | novel | c.292N>T | p.Asp98Tyr | p.D98Y | P41236 | protein_coding | deleterious(0) | probably_damaging(0.924) | TCGA-A5-A0G2-01 | Endometrium | uterine corpus endometrioid carcinoma | Female | <65 | III/IV | Unknown | Unknown | SD |
| PPP1R2 | SNV | Missense_Mutation | novel | c.436N>T | p.Leu146Phe | p.L146F | P41236 | protein_coding | deleterious(0) | possibly_damaging(0.877) | TCGA-A5-A1OF-01 | Endometrium | uterine corpus endometrioid carcinoma | Female | <65 | I/II | Unknown | Unknown | SD |
| Page: 1 2 3 |
Top |
Related drugs of malignant transformation related genes |
| Identification of chemicals and drugs interact with genes involved in malignant transfromation |
| (DGIdb 4.0) |
| Entrez ID | Symbol | Category | Interaction Types | Drug Claim Name | Drug Name | PMIDs |
| Page: 1 |

Copyright 2023-Present -The University of Texas Health Science Center at Houston |