Schematic overview of the cellular and molecular mechanisms involved in the cancer progression, including the proposed cellular and molecular mechanisms in cancer cells trajectory. AT1: alveolar type 1 cells; AT2: alveolar type 2 cells; AAH: atypical adenomatous hyperplasia; AIS: adenocarcinoma in situ; MIA: minimally invasive adenocarcinoma; IA: invasive adenocarcinoma; EMT: epithelial-mesenchymal transition

Home

Download

Statistics

Help

Contact

Center for Computational Systems Medicine
leaf

Gene summary

leaf

Malignant transformation analysis

leaf

Malignant transformation related pathway analysis

leaf

Cell-cell communication analysis

leaf

Single-cell gene regulatory network inference analysis

leaf

Somatic mutation of malignant transformation related genes

leaf

Related drugs of malignant transformation related genes

Gene: PMPCA

Gene summary for PMPCA

check button Gene summary.

Gene informationSpeciesHuman
Gene symbol

PMPCA

Gene ID

23203

Gene namepeptidase, mitochondrial processing subunit alpha
Gene AliasAlpha-MPP
Cytomap9q34.3
Gene Typeprotein-coding
GO ID

GO:0006508

UniProtAcc

Q10713


Top

Malignant transformation analysis

check button Identification of the aberrant gene expression in precancerous and cancerous lesions by comparing the gene expression of stem-like cells in diseased tissues with normal stem cells
check button Malignant transformation involving gene list.
Entrez IDSymbolReplicatesSpeciesOrganTissueAdj P-valueLog2FCMalignancy
23203PMPCALZE4THumanEsophagusESCC7.69e-092.02e-010.0811
23203PMPCALZE7THumanEsophagusESCC2.00e-065.93e-010.0667
23203PMPCALZE8THumanEsophagusESCC5.51e-072.83e-010.067
23203PMPCALZE20THumanEsophagusESCC1.50e-052.49e-010.0662
23203PMPCALZE22D1HumanEsophagusHGIN9.54e-041.28e-020.0595
23203PMPCALZE24THumanEsophagusESCC8.24e-081.79e-010.0596
23203PMPCALZE6THumanEsophagusESCC4.78e-071.57e-010.0845
23203PMPCAP1T-EHumanEsophagusESCC9.20e-052.94e-010.0875
23203PMPCAP2T-EHumanEsophagusESCC3.07e-285.61e-010.1177
23203PMPCAP4T-EHumanEsophagusESCC2.58e-162.90e-010.1323
23203PMPCAP5T-EHumanEsophagusESCC7.58e-092.07e-010.1327
23203PMPCAP8T-EHumanEsophagusESCC2.11e-183.63e-010.0889
23203PMPCAP9T-EHumanEsophagusESCC3.63e-122.21e-010.1131
23203PMPCAP10T-EHumanEsophagusESCC2.56e-244.87e-010.116
23203PMPCAP11T-EHumanEsophagusESCC1.40e-115.15e-010.1426
23203PMPCAP12T-EHumanEsophagusESCC1.22e-213.46e-010.1122
23203PMPCAP15T-EHumanEsophagusESCC3.27e-213.03e-010.1149
23203PMPCAP16T-EHumanEsophagusESCC5.14e-163.14e-010.1153
23203PMPCAP17T-EHumanEsophagusESCC7.62e-084.28e-010.1278
23203PMPCAP20T-EHumanEsophagusESCC6.26e-121.83e-010.1124
Page: 1 2 3 4 5 6 

check button Transcriptomic changes along malignancy continuum.
TissueExpression DynamicsAbbreviation
EsophagusThe image shows the transcriptomic changes along malignancy continuum.log2FC in expression of this searched gene in stem-like cells from each diseased tissue sample relative to stem-like cells in normal samples in each tissue plotted against the malignancy continuum. Samples are colored based on if they are from different disease stage.
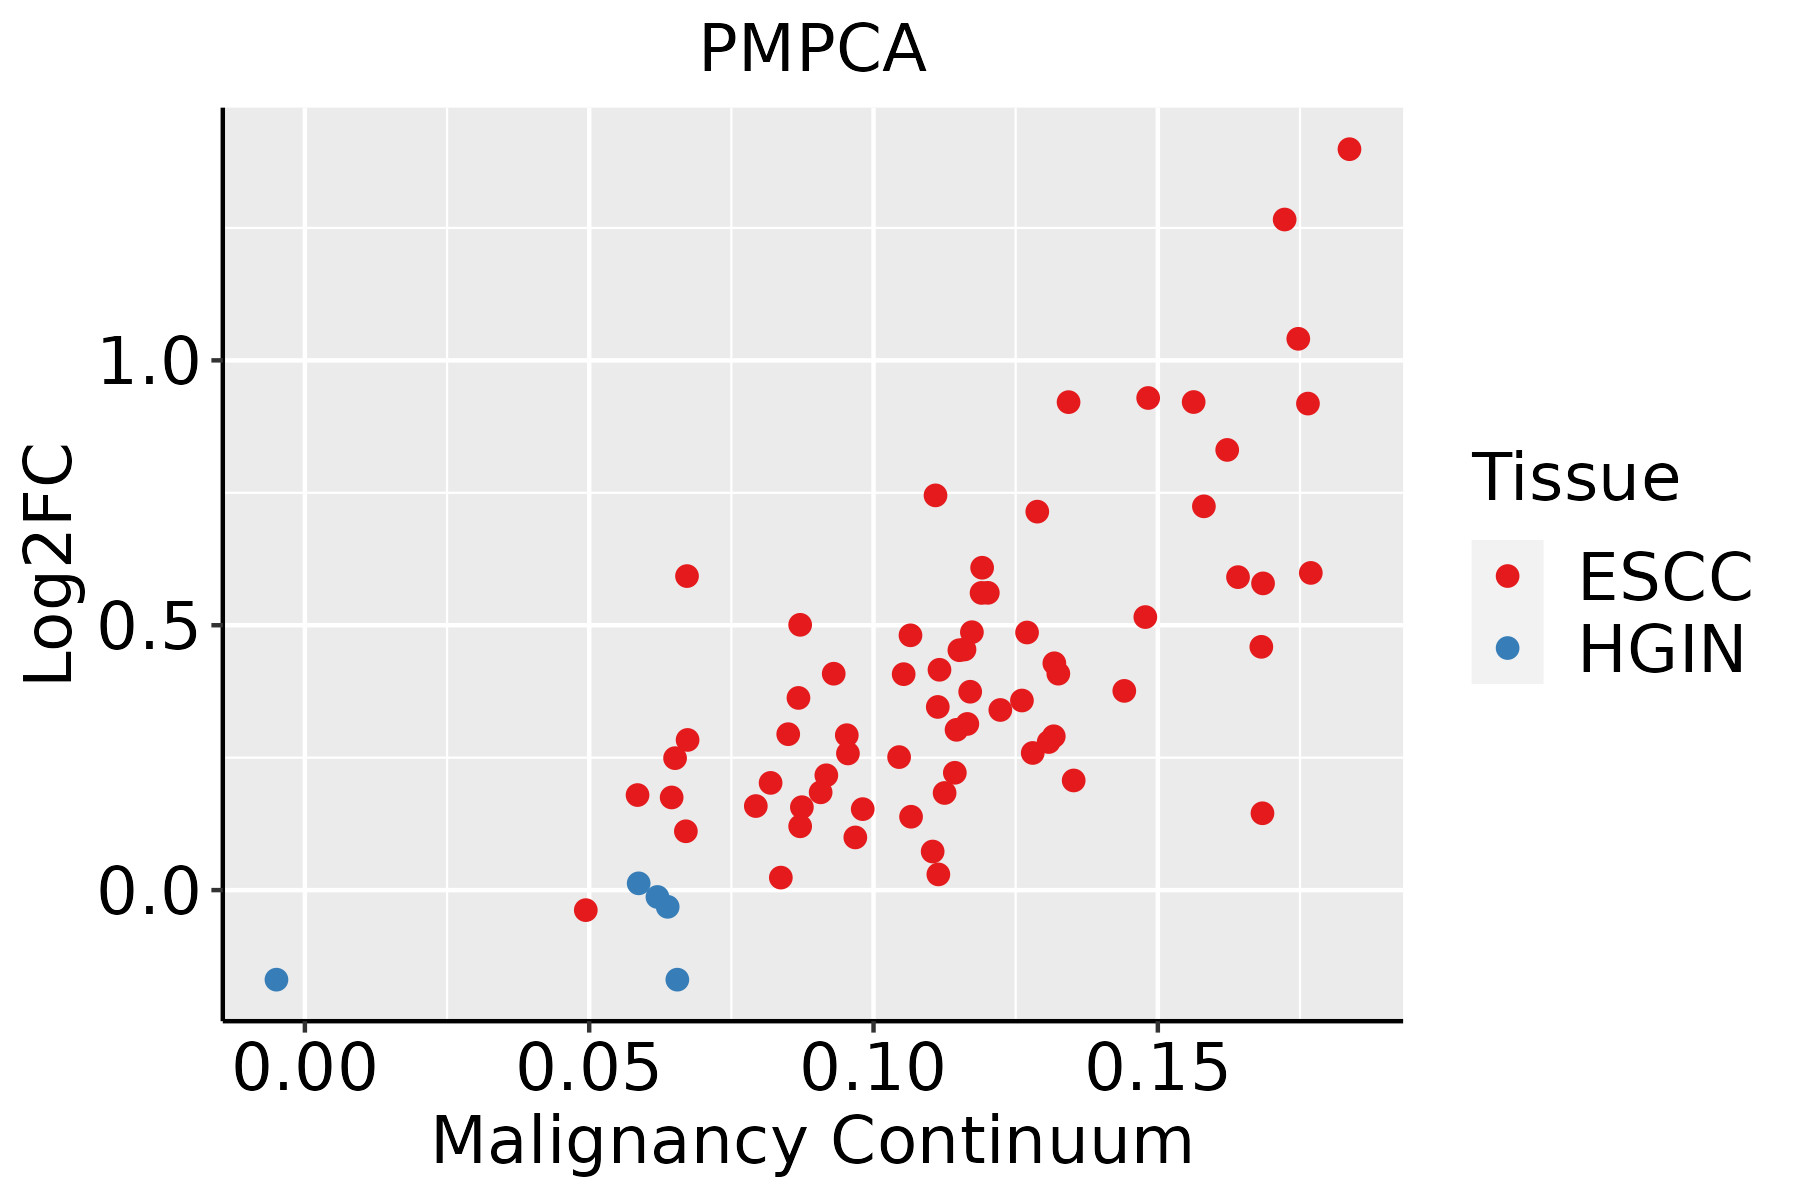
ESCC: Esophageal squamous cell carcinoma
HGIN: High-grade intraepithelial neoplasias
LGIN: Low-grade intraepithelial neoplasias
LiverThe image shows the transcriptomic changes along malignancy continuum.log2FC in expression of this searched gene in stem-like cells from each diseased tissue sample relative to stem-like cells in normal samples in each tissue plotted against the malignancy continuum. Samples are colored based on if they are from different disease stage.
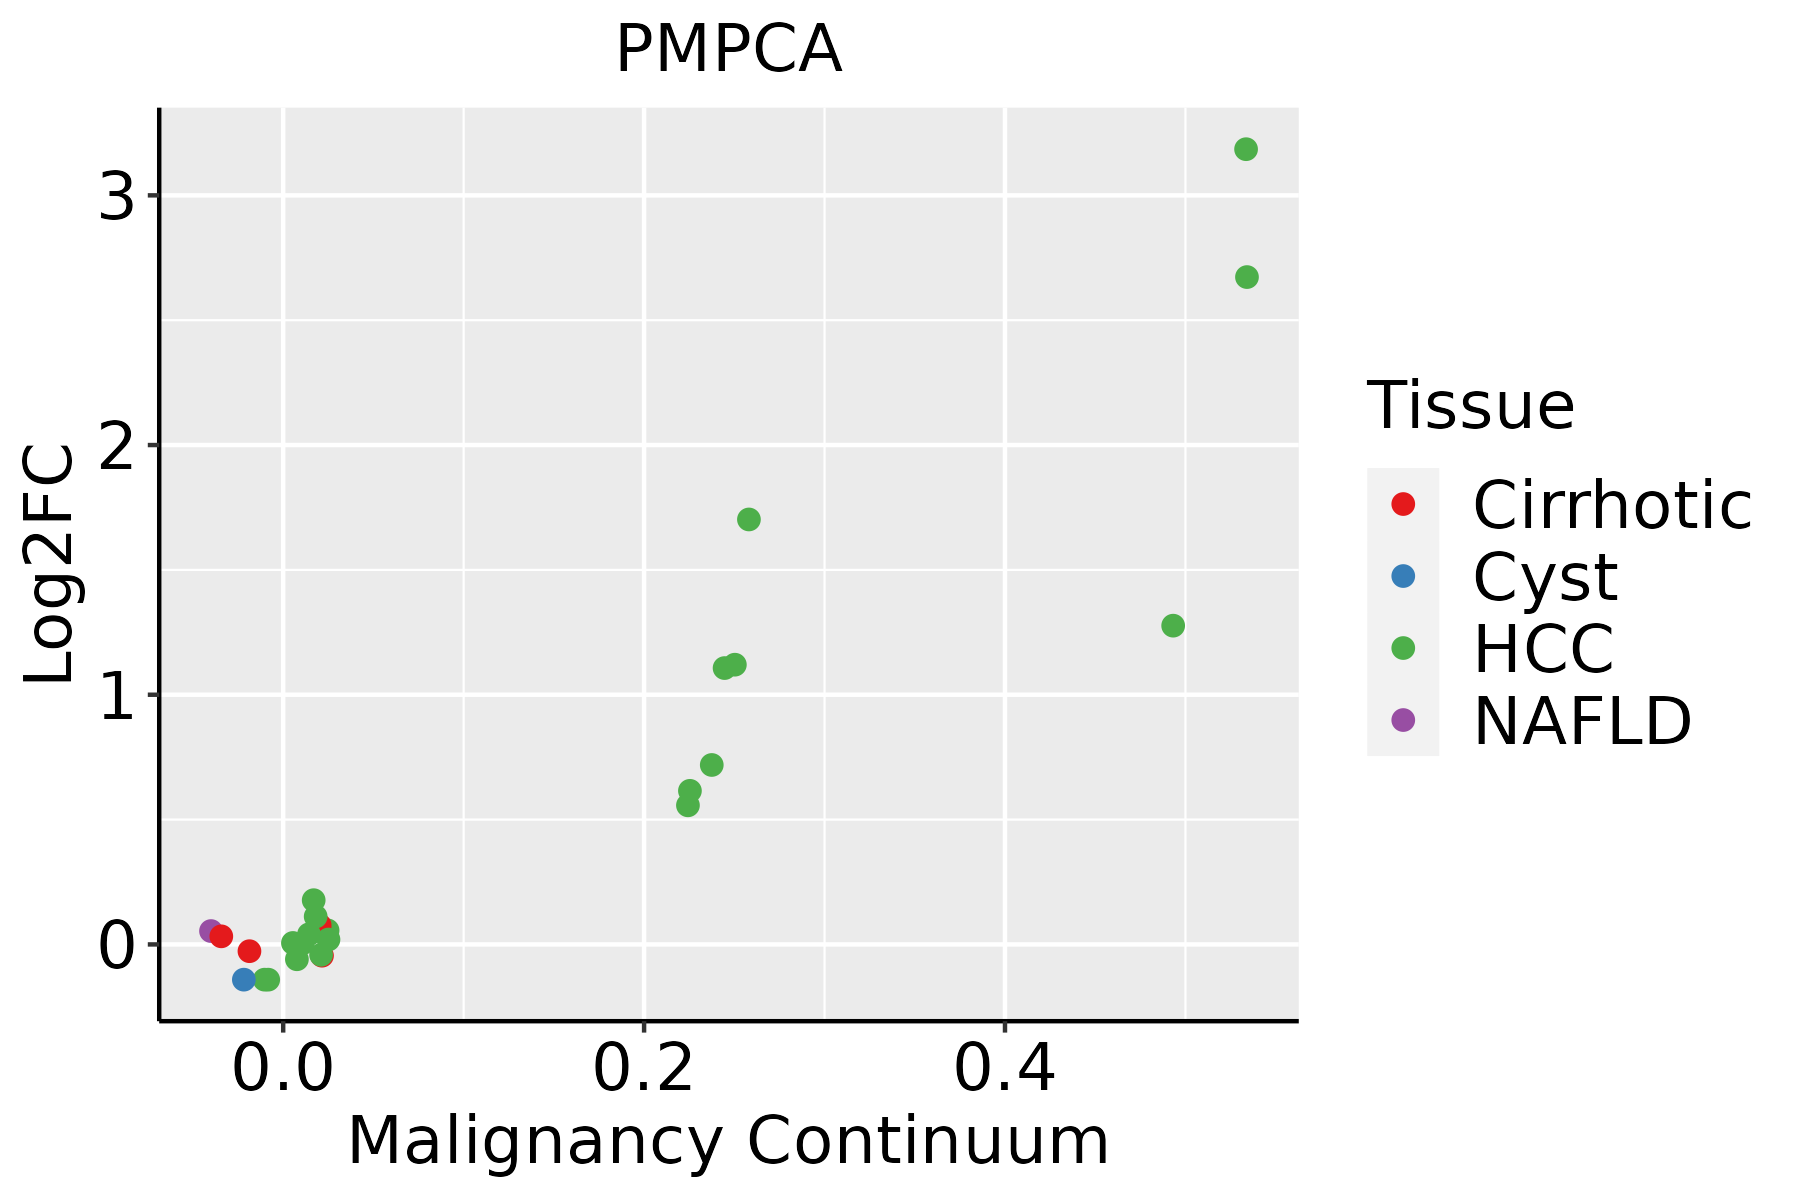
HCC: Hepatocellular carcinoma
NAFLD: Non-alcoholic fatty liver disease
Oral CavityThe image shows the transcriptomic changes along malignancy continuum.log2FC in expression of this searched gene in stem-like cells from each diseased tissue sample relative to stem-like cells in normal samples in each tissue plotted against the malignancy continuum. Samples are colored based on if they are from different disease stage.
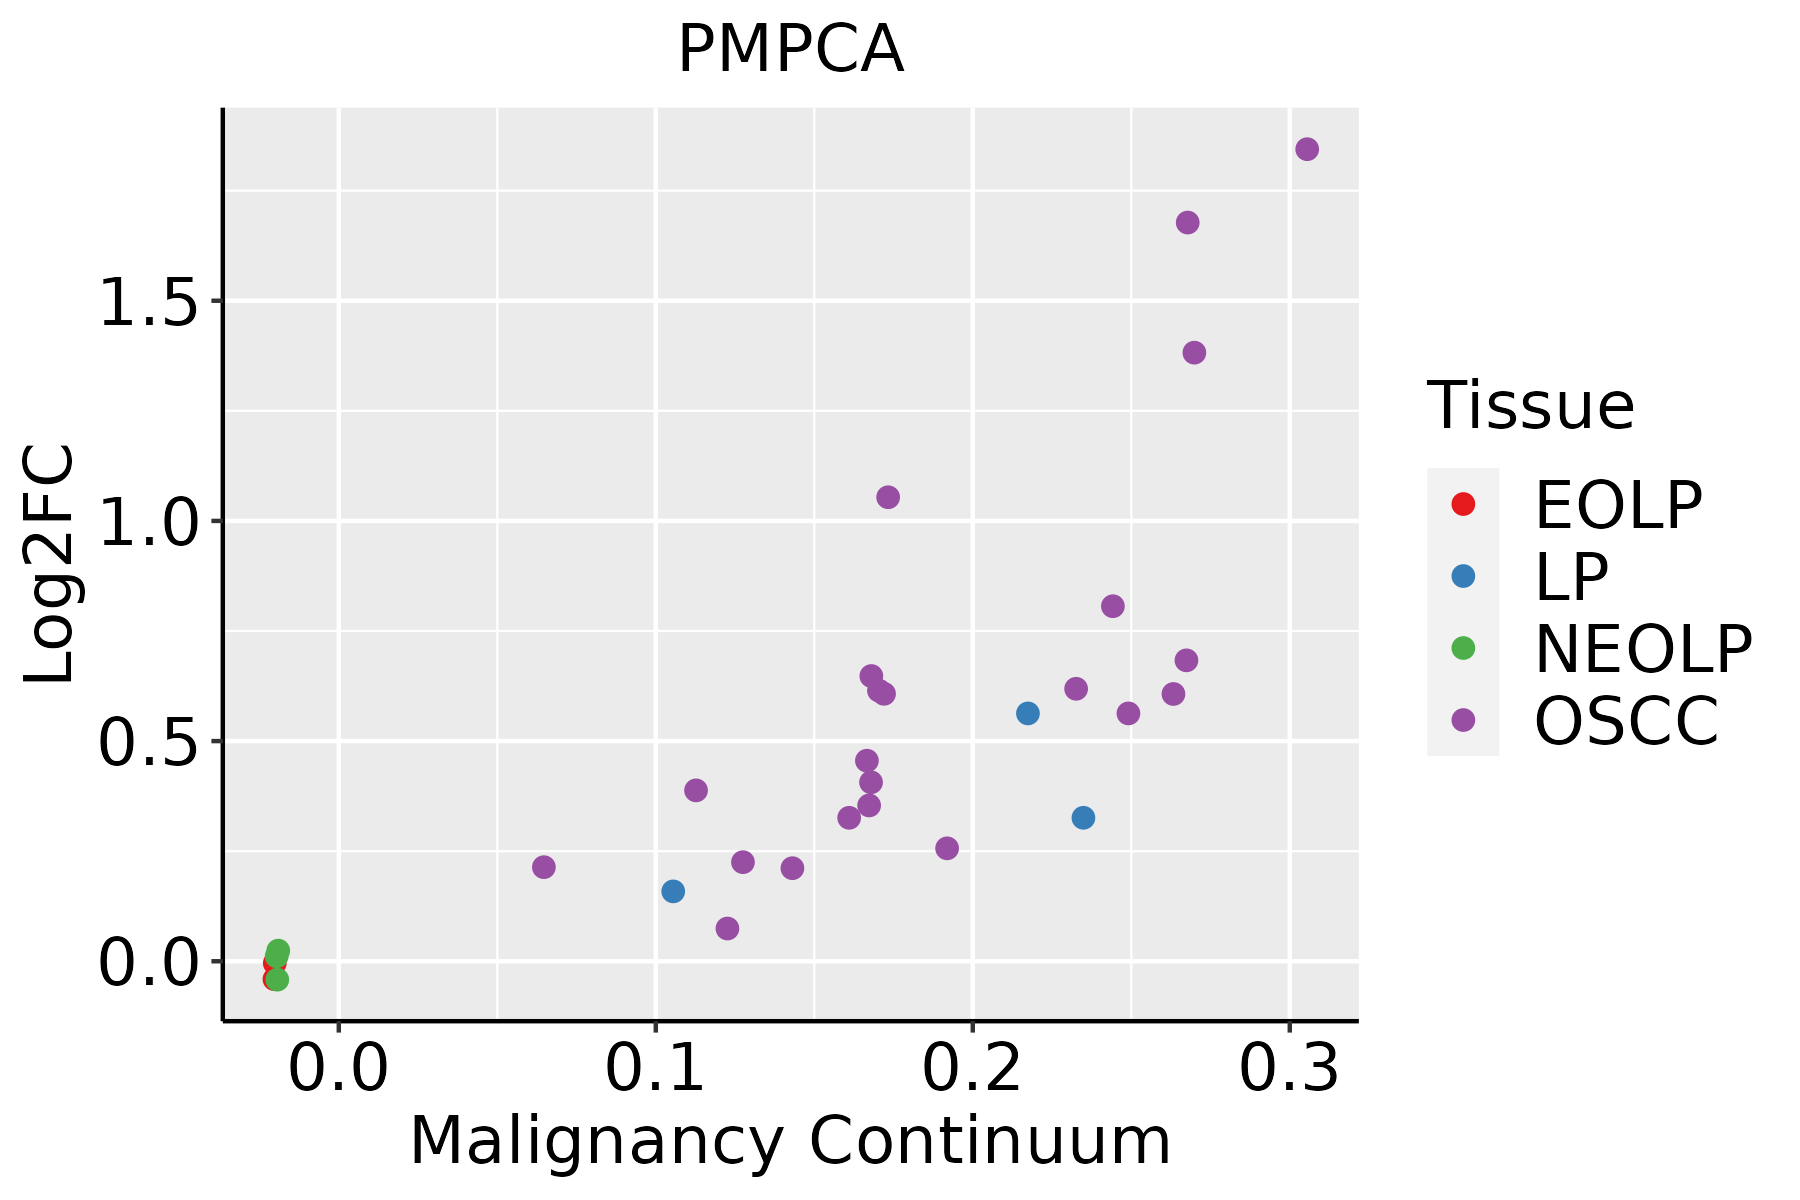
EOLP: Erosive Oral lichen planus
LP: leukoplakia
NEOLP: Non-erosive oral lichen planus
OSCC: Oral squamous cell carcinoma
SkinThe image shows the transcriptomic changes along malignancy continuum.log2FC in expression of this searched gene in stem-like cells from each diseased tissue sample relative to stem-like cells in normal samples in each tissue plotted against the malignancy continuum. Samples are colored based on if they are from different disease stage.AK: Actinic keratosis
cSCC: Cutaneous squamous cell carcinoma
SCCIS:squamous cell carcinoma in situ
ThyroidThe image shows the transcriptomic changes along malignancy continuum.log2FC in expression of this searched gene in stem-like cells from each diseased tissue sample relative to stem-like cells in normal samples in each tissue plotted against the malignancy continuum. Samples are colored based on if they are from different disease stage.ATC: Anaplastic thyroid cancer
HT: Hashimoto's thyroiditis
PTC: Papillary thyroid cancer
∗log2FC in expression of this searched gene in stem-like cells from each diseased tissue sample relative to stem-like cells in normal samples in each tissue plotted against the malignancy continuum. Samples are colored based on if they are from different disease stage.

Top

Malignant transformation related pathway analysis

check buttonFind out the enriched GO biological processes and KEGG pathways involved in transition from healthy to precancer to cancer
check button Figure of enriched GO biological processes.
TissueDisease StageEnriched GO biological Processes
ColorectumADGO analysis - Figure of enriched GO biological processes: Top 15 enriched GO BP terms are showed in the bar plot of each disease state in each tissue. Each row represents a significant GO biological process which is colored according to the -log10(p.adjust).
ColorectumSERGO analysis - Figure of enriched GO biological processes: Top 15 enriched GO BP terms are showed in the bar plot of each disease state in each tissue. Each row represents a significant GO biological process which is colored according to the -log10(p.adjust).
ColorectumMSSGO analysis - Figure of enriched GO biological processes: Top 15 enriched GO BP terms are showed in the bar plot of each disease state in each tissue. Each row represents a significant GO biological process which is colored according to the -log10(p.adjust).
ColorectumMSI-HGO analysis - Figure of enriched GO biological processes: Top 15 enriched GO BP terms are showed in the bar plot of each disease state in each tissue. Each row represents a significant GO biological process which is colored according to the -log10(p.adjust).
ColorectumFAPGO analysis - Figure of enriched GO biological processes: Top 15 enriched GO BP terms are showed in the bar plot of each disease state in each tissue. Each row represents a significant GO biological process which is colored according to the -log10(p.adjust).
∗Top 15 enriched GO BP terms are showed in the bar plot of each disease state in each tissue. Each row represents a significant GO biological process which is colored according to the -log10(p.adjust).
Page: 1 2 3 4 5 6 7 8 9 

check button Enriched GO biological processes.
GO IDTissueDisease StageDescriptionGene RatioBg Ratiopvaluep.adjustCount
GO:007259427SkincSCCestablishment of protein localization to organelle213/4864422/187231.40e-275.15e-25213
GO:000660527SkincSCCprotein targeting153/4864314/187232.62e-183.36e-16153
GO:000683927SkincSCCmitochondrial transport124/4864254/187233.54e-152.81e-13124
GO:007058525SkincSCCprotein localization to mitochondrion74/4864125/187233.95e-153.06e-1374
GO:007265525SkincSCCestablishment of protein localization to mitochondrion71/4864120/187231.48e-141.04e-1271
GO:000662624SkincSCCprotein targeting to mitochondrion61/4864100/187231.53e-139.32e-1261
GO:005160419SkincSCCprotein maturation117/4864294/187231.27e-072.93e-06117
GO:0034982SkincSCCmitochondrial protein processing9/486413/187231.33e-038.50e-039
GO:00164858SkincSCCprotein processing79/4864225/187231.43e-039.02e-0379
GO:0072594112ThyroidPTCestablishment of protein localization to organelle244/5968422/187231.18e-284.97e-26244
GO:0006605113ThyroidPTCprotein targeting180/5968314/187236.81e-211.19e-18180
GO:000683928ThyroidPTCmitochondrial transport150/5968254/187232.76e-193.34e-17150
GO:0070585112ThyroidPTCprotein localization to mitochondrion83/5968125/187232.15e-151.56e-1383
GO:0072655112ThyroidPTCestablishment of protein localization to mitochondrion80/5968120/187234.87e-153.30e-1380
GO:0006626111ThyroidPTCprotein targeting to mitochondrion67/5968100/187235.55e-132.74e-1167
GO:005160420ThyroidPTCprotein maturation132/5968294/187231.71e-062.39e-05132
GO:00164859ThyroidPTCprotein processing95/5968225/187236.60e-044.15e-0395
GO:00349822ThyroidPTCmitochondrial protein processing10/596813/187231.11e-036.51e-0310
GO:007259429ThyroidATCestablishment of protein localization to organelle247/6293422/187232.88e-261.40e-23247
GO:000660533ThyroidATCprotein targeting180/6293314/187233.54e-184.39e-16180
Page: 1 2 3 4 

check button Enriched KEGG pathways.
Pathway IDTissueDisease StageDescriptionGene RatioBg Ratiopvaluep.adjustqvalueCount
Page: 1 

Top

Cell-cell communication analysis

check buttonIdentification of potential cell-cell interactions between two cell types and their ligand-receptor pairs for different disease states
LigandReceptorLRpairPathwayTissueDisease Stage
Page: 1 

Top

Single-cell gene regulatory network inference analysis

check buttonFind out the significant the regulons (TFs) and the target genes of each regulon across cell types for different disease states
TFCell TypeTissueDisease StageTarget GeneRSSRegulon Activity
∗The dot plots of a searched regulon are shown for all cell subpopulations in each disease state of each tissue based on the regulon specific score inferred using pySCENIC and by calculating the average expression.
Page: 1 

Top

Somatic mutation of malignant transformation related genes

check buttonAnnotation of somatic variants for genes involved in malignant transformation
Hugo SymbolVariant ClassVariant ClassificationdbSNP RSHGVScHGVSpHGVSp ShortSWISSPROTBIOTYPESIFTPolyPhenTumor Sample BarcodeTissueHistologySexAgeStageTherapy TypesDrugsOutcome
PMPCASNVMissense_Mutationrs543713243c.466N>Ap.Asp156Asnp.D156NQ10713protein_codingtolerated(0.19)benign(0.142)TCGA-C8-A12Q-01Breastbreast invasive carcinomaFemale>=65III/IVUnknownUnknownPD
PMPCASNVMissense_Mutationrs143416740c.229N>Tp.Arg77Cysp.R77CQ10713protein_codingdeleterious(0)probably_damaging(0.996)TCGA-D8-A1J8-01Breastbreast invasive carcinomaFemale>=65I/IIHormone TherapynolvadexSD
PMPCASNVMissense_Mutationc.998N>Cp.Asp333Alap.D333AQ10713protein_codingdeleterious(0)probably_damaging(0.992)TCGA-D8-A27M-01Breastbreast invasive carcinomaFemale<65I/IIChemotherapymethotrexate+5SD
PMPCAinsertionFrame_Shift_Insnovelc.1342_1343insCCCGCCACCACGCCCAGCTAp.Asp448AlafsTer32p.D448Afs*32Q10713protein_codingTCGA-AN-A0FX-01Breastbreast invasive carcinomaFemale<65I/IIUnknownUnknownSD
PMPCAinsertionNonsense_Mutationnovelc.1344_1345insTTCTTTTTGTATTTTTAGTAGAGAAp.Val449PhefsTer6p.V449Ffs*6Q10713protein_codingTCGA-AN-A0FX-01Breastbreast invasive carcinomaFemale<65I/IIUnknownUnknownSD
PMPCASNVMissense_Mutationrs869025293c.1543G>Ap.Gly515Argp.G515RQ10713protein_codingtolerated(0.06)probably_damaging(0.999)TCGA-EA-A3HS-01Cervixcervical & endocervical cancerFemale<65I/IIUnknownUnknownSD
PMPCASNVMissense_Mutationc.546N>Cp.Glu182Aspp.E182DQ10713protein_codingtolerated(0.18)benign(0.077)TCGA-IR-A3LH-01Cervixcervical & endocervical cancerFemale<65I/IIChemotherapycisplatinCR
PMPCASNVMissense_Mutationnovelc.281N>Cp.Ile94Thrp.I94TQ10713protein_codingdeleterious(0)possibly_damaging(0.864)TCGA-MA-AA3X-01Cervixcervical & endocervical cancerFemale<65III/IVChemotherapycisplatinCR
PMPCASNVMissense_Mutationc.466G>Cp.Asp156Hisp.D156HQ10713protein_codingtolerated(0.31)benign(0.082)TCGA-MY-A5BD-01Cervixcervical & endocervical cancerFemale<65I/IIChemotherapycisplatinCR
PMPCASNVMissense_Mutationc.901G>Cp.Glu301Glnp.E301QQ10713protein_codingtolerated(0.23)benign(0.042)TCGA-Q1-A73O-01Cervixcervical & endocervical cancerFemale<65I/IIChemotherapycisplatinCR
Page: 1 2 3 4 5 6 

Top

Related drugs of malignant transformation related genes

check buttonIdentification of chemicals and drugs interact with genes involved in malignant transfromation
(DGIdb 4.0)
Entrez IDSymbolCategoryInteraction TypesDrug Claim NameDrug NamePMIDs
Page: 1