
|
|||||
|
 | |
| |
| |
| |
| |
| |
|
Gene: PLXND1 |
Gene summary for PLXND1 |
| Gene information | Species | Human | Gene symbol | PLXND1 | Gene ID | 23129 |
| Gene name | plexin D1 | |
| Gene Alias | PLEXD1 | |
| Cytomap | 3q22.1 | |
| Gene Type | protein-coding | GO ID | GO:0000902 | UniProtAcc | Q9Y4D7 |
Top |
Malignant transformation analysis |
| Identification of the aberrant gene expression in precancerous and cancerous lesions by comparing the gene expression of stem-like cells in diseased tissues with normal stem cells |
| Entrez ID | Symbol | Replicates | Species | Organ | Tissue | Adj P-value | Log2FC | Malignancy |
| 23129 | PLXND1 | HCC1_Meng | Human | Liver | HCC | 6.15e-15 | 4.14e-02 | 0.0246 |
| 23129 | PLXND1 | HCC2 | Human | Liver | HCC | 4.00e-18 | 3.03e+00 | 0.5341 |
| 23129 | PLXND1 | Pt13.b | Human | Liver | HCC | 3.18e-04 | 1.37e-01 | 0.0251 |
| 23129 | PLXND1 | Pt14.a | Human | Liver | HCC | 9.82e-05 | 3.44e-01 | 0.0169 |
| 23129 | PLXND1 | Pt14.d | Human | Liver | HCC | 6.59e-11 | 2.90e-01 | 0.0143 |
| 23129 | PLXND1 | S014 | Human | Liver | HCC | 2.93e-23 | 9.61e-01 | 0.2254 |
| 23129 | PLXND1 | S015 | Human | Liver | HCC | 1.29e-30 | 1.25e+00 | 0.2375 |
| 23129 | PLXND1 | S016 | Human | Liver | HCC | 3.38e-35 | 1.21e+00 | 0.2243 |
| 23129 | PLXND1 | S027 | Human | Liver | HCC | 5.50e-13 | 8.93e-01 | 0.2446 |
| 23129 | PLXND1 | S028 | Human | Liver | HCC | 6.91e-30 | 1.02e+00 | 0.2503 |
| 23129 | PLXND1 | S029 | Human | Liver | HCC | 1.75e-18 | 7.53e-01 | 0.2581 |
| 23129 | PLXND1 | male-WTA | Human | Thyroid | PTC | 4.42e-19 | 2.48e-01 | 0.1037 |
| 23129 | PLXND1 | PTC01 | Human | Thyroid | PTC | 1.25e-05 | 1.29e-01 | 0.1899 |
| 23129 | PLXND1 | PTC03 | Human | Thyroid | PTC | 3.54e-03 | 2.95e-01 | 0.1784 |
| 23129 | PLXND1 | PTC04 | Human | Thyroid | PTC | 2.77e-07 | 1.78e-01 | 0.1927 |
| 23129 | PLXND1 | PTC05 | Human | Thyroid | PTC | 5.53e-08 | 2.73e-01 | 0.2065 |
| 23129 | PLXND1 | PTC06 | Human | Thyroid | PTC | 3.45e-18 | 4.01e-01 | 0.2057 |
| 23129 | PLXND1 | PTC07 | Human | Thyroid | PTC | 2.31e-12 | 2.77e-01 | 0.2044 |
| 23129 | PLXND1 | ATC11 | Human | Thyroid | ATC | 2.02e-16 | 7.97e-01 | 0.3386 |
| 23129 | PLXND1 | ATC12 | Human | Thyroid | ATC | 6.38e-17 | 3.54e-01 | 0.34 |
| Page: 1 2 |
| Tissue | Expression Dynamics | Abbreviation |
| Liver | 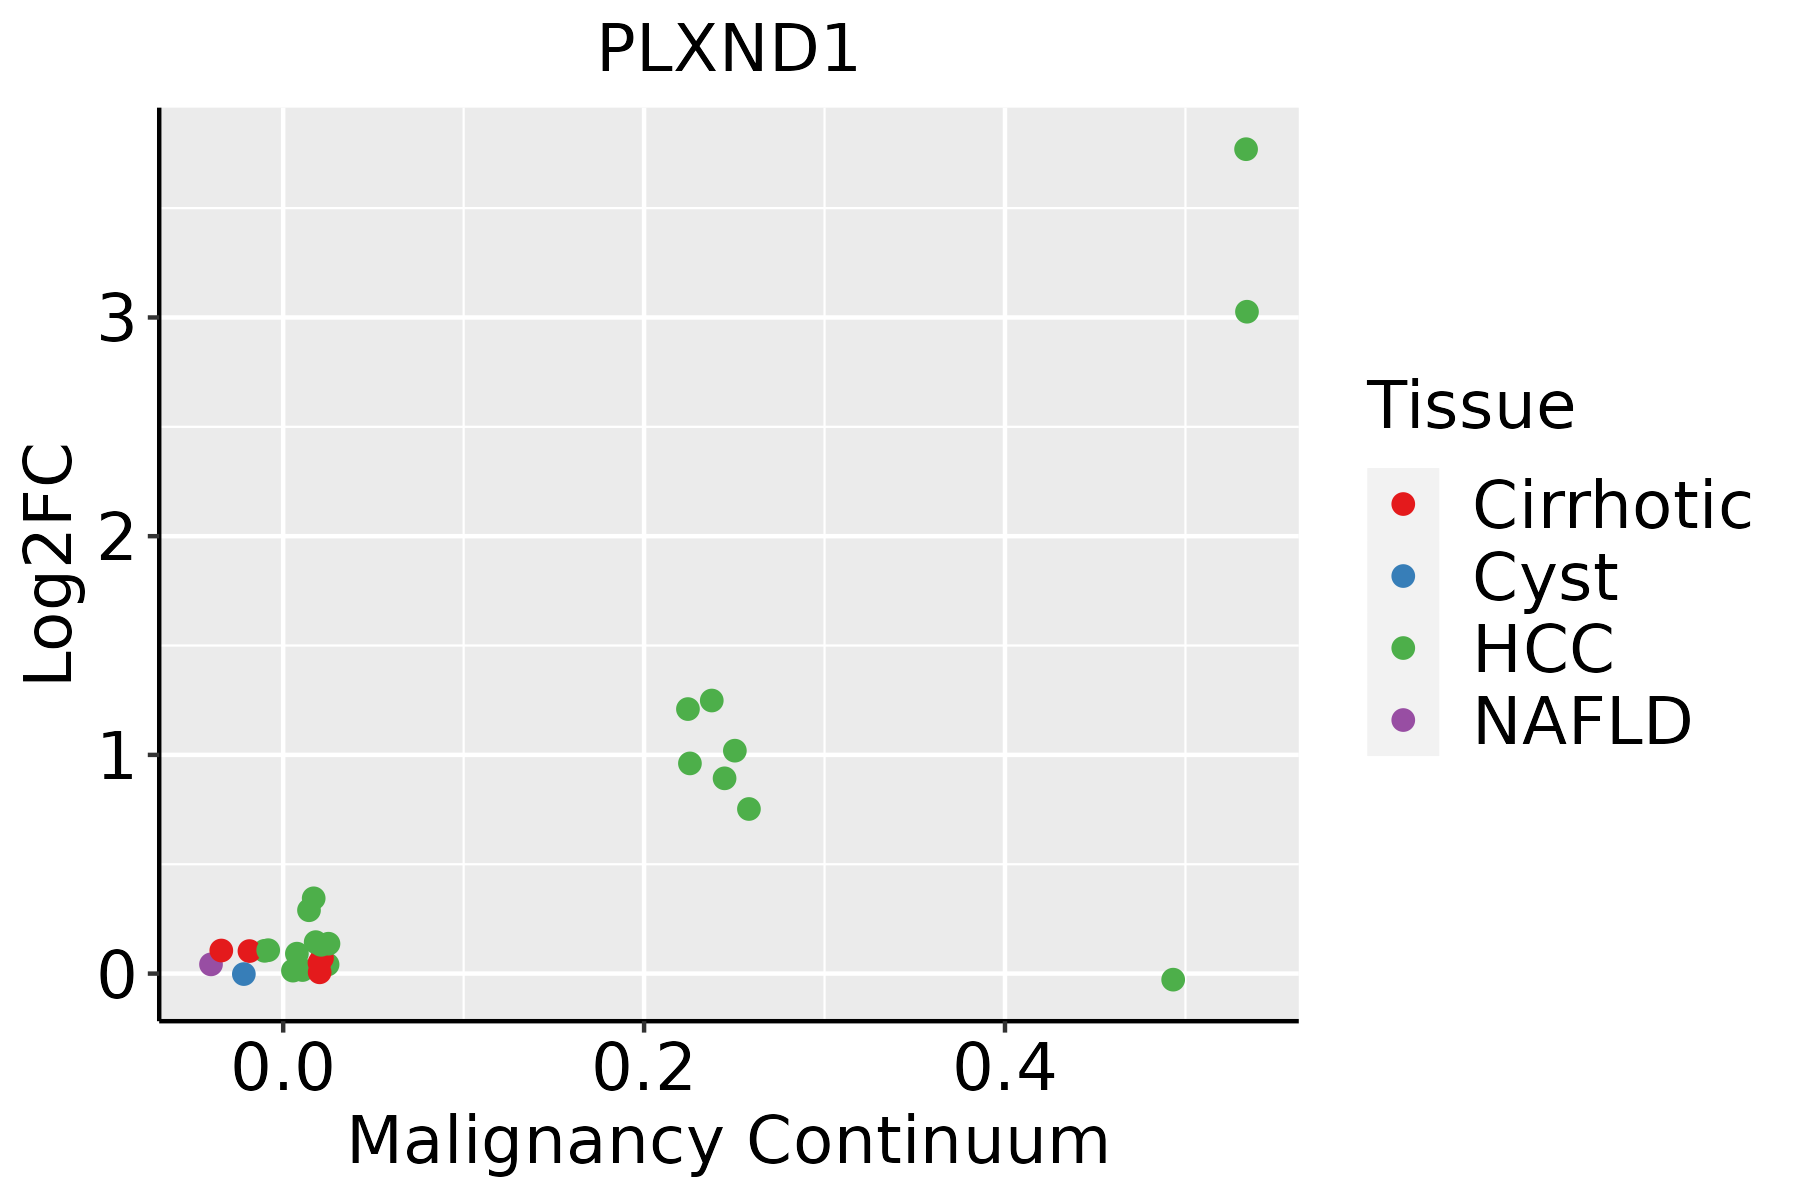 | HCC: Hepatocellular carcinoma |
| NAFLD: Non-alcoholic fatty liver disease | ||
| Thyroid | 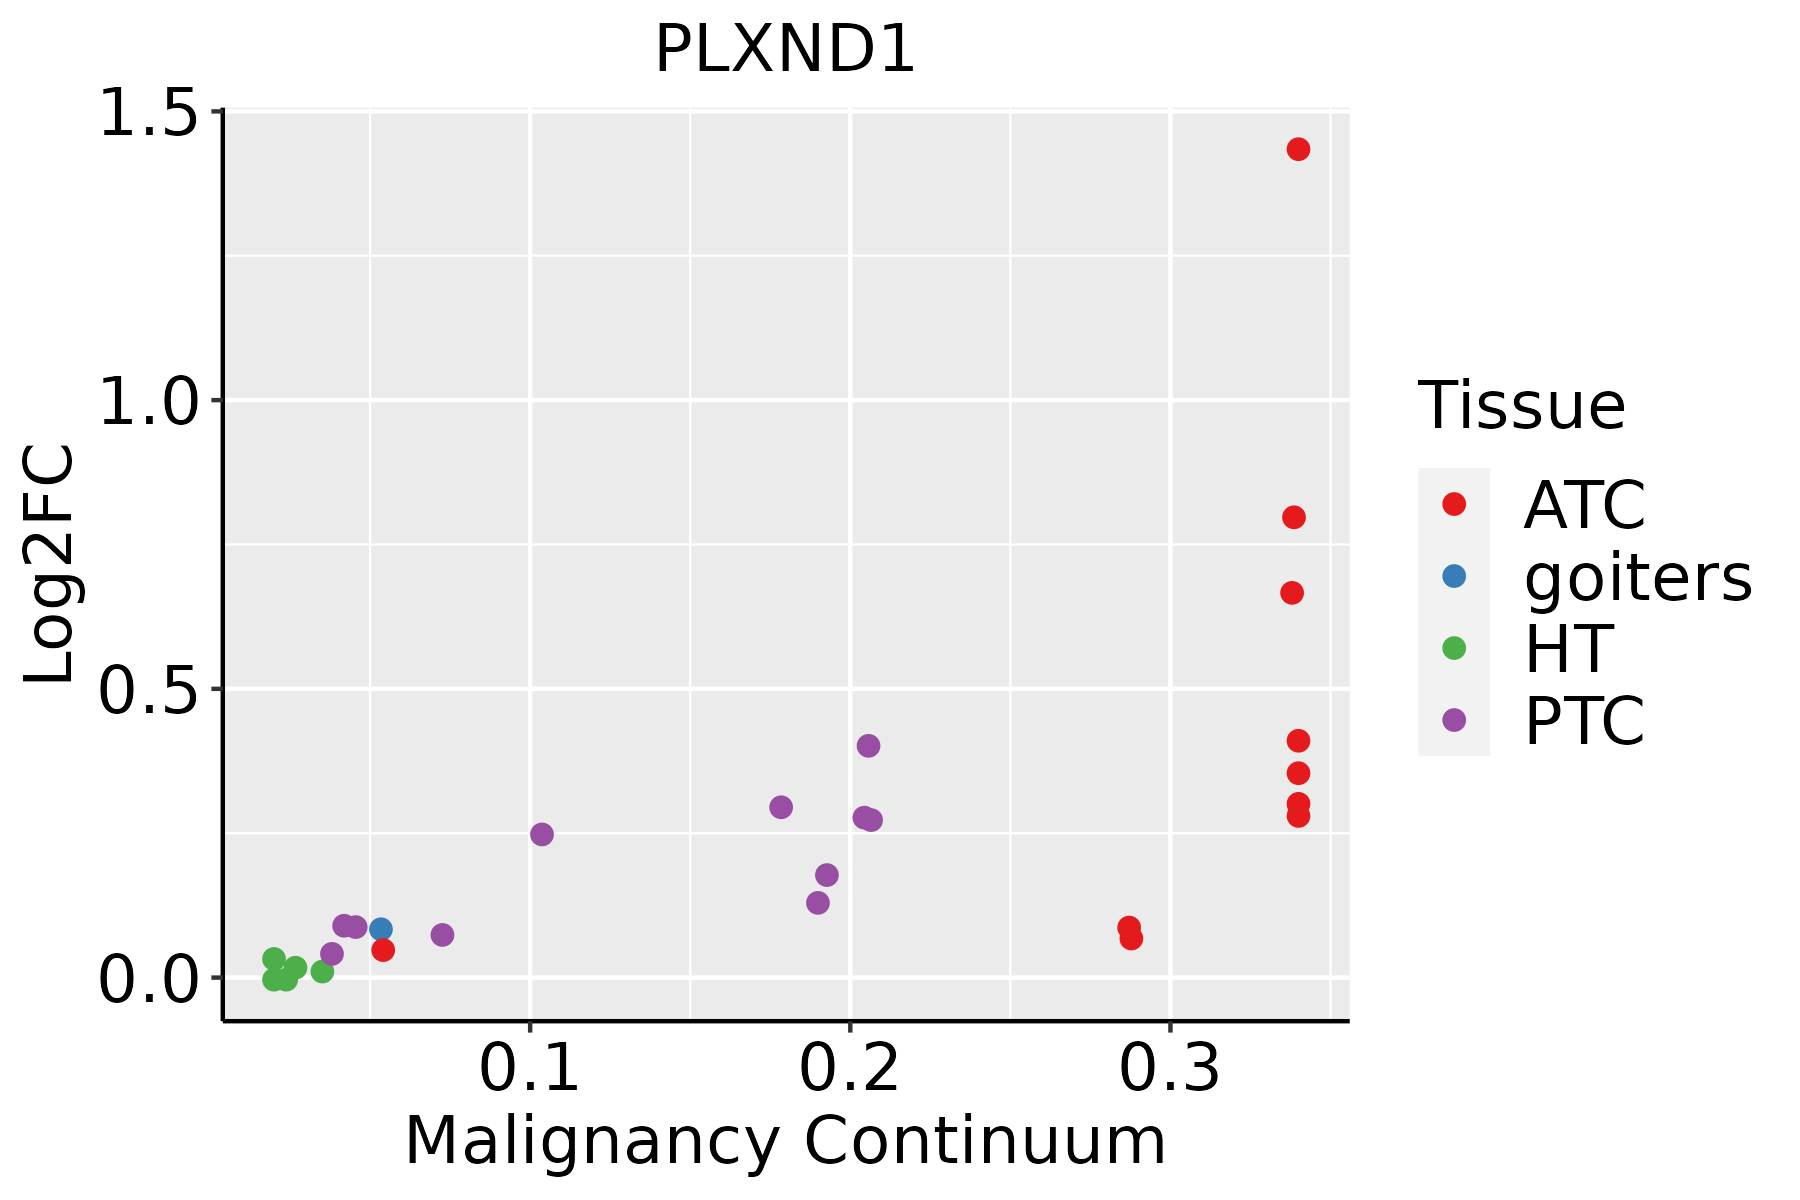 | ATC: Anaplastic thyroid cancer |
| HT: Hashimoto's thyroiditis | ||
| PTC: Papillary thyroid cancer |
| ∗log2FC in expression of this searched gene in stem-like cells from each diseased tissue sample relative to stem-like cells in normal samples in each tissue plotted against the malignancy continuum. Samples are colored based on if they are from different disease stage. |
Top |
Malignant transformation related pathway analysis |
| Find out the enriched GO biological processes and KEGG pathways involved in transition from healthy to precancer to cancer |
| Tissue | Disease Stage | Enriched GO biological Processes |
| Colorectum | AD |  |
| Colorectum | SER |  |
| Colorectum | MSS |  |
| Colorectum | MSI-H |  |
| Colorectum | FAP |  |
| ∗Top 15 enriched GO BP terms are showed in the bar plot of each disease state in each tissue. Each row represents a significant GO biological process which is colored according to the -log10(p.adjust). |
| Page: 1 2 3 4 5 6 7 8 9 |
| GO ID | Tissue | Disease Stage | Description | Gene Ratio | Bg Ratio | pvalue | p.adjust | Count |
| GO:0010631111 | Thyroid | PTC | epithelial cell migration | 149/5968 | 357/18723 | 4.83e-05 | 4.33e-04 | 149 |
| GO:005196214 | Thyroid | PTC | positive regulation of nervous system development | 117/5968 | 272/18723 | 6.72e-05 | 5.89e-04 | 117 |
| GO:0090132111 | Thyroid | PTC | epithelium migration | 149/5968 | 360/18723 | 7.89e-05 | 6.74e-04 | 149 |
| GO:0090130111 | Thyroid | PTC | tissue migration | 150/5968 | 365/18723 | 1.13e-04 | 9.01e-04 | 150 |
| GO:00519608 | Thyroid | PTC | regulation of nervous system development | 177/5968 | 443/18723 | 1.72e-04 | 1.32e-03 | 177 |
| GO:00032055 | Thyroid | PTC | cardiac chamber development | 72/5968 | 161/18723 | 4.13e-04 | 2.77e-03 | 72 |
| GO:004354219 | Thyroid | PTC | endothelial cell migration | 112/5968 | 279/18723 | 2.03e-03 | 1.09e-02 | 112 |
| GO:000176316 | Thyroid | PTC | morphogenesis of a branching structure | 81/5968 | 196/18723 | 3.20e-03 | 1.57e-02 | 81 |
| GO:002261219 | Thyroid | PTC | gland morphogenesis | 52/5968 | 118/18723 | 3.56e-03 | 1.72e-02 | 52 |
| GO:00508089 | Thyroid | PTC | synapse organization | 161/5968 | 426/18723 | 5.11e-03 | 2.36e-02 | 161 |
| GO:1902285 | Thyroid | PTC | semaphorin-plexin signaling pathway involved in neuron projection guidance | 9/5968 | 13/18723 | 6.33e-03 | 2.79e-02 | 9 |
| GO:000716219 | Thyroid | PTC | negative regulation of cell adhesion | 117/5968 | 303/18723 | 7.28e-03 | 3.12e-02 | 117 |
| GO:00611387 | Thyroid | PTC | morphogenesis of a branching epithelium | 74/5968 | 182/18723 | 7.45e-03 | 3.18e-02 | 74 |
| GO:00608402 | Thyroid | PTC | artery development | 43/5968 | 100/18723 | 1.25e-02 | 4.88e-02 | 43 |
| GO:005109834 | Thyroid | ATC | regulation of binding | 203/6293 | 363/18723 | 1.18e-18 | 1.55e-16 | 203 |
| GO:002260429 | Thyroid | ATC | regulation of cell morphogenesis | 171/6293 | 309/18723 | 2.36e-15 | 1.70e-13 | 171 |
| GO:003134623 | Thyroid | ATC | positive regulation of cell projection organization | 186/6293 | 353/18723 | 7.99e-14 | 4.23e-12 | 186 |
| GO:005109934 | Thyroid | ATC | positive regulation of binding | 103/6293 | 173/18723 | 2.19e-12 | 9.05e-11 | 103 |
| GO:000166731 | Thyroid | ATC | ameboidal-type cell migration | 228/6293 | 475/18723 | 3.72e-11 | 1.22e-09 | 228 |
| GO:004339327 | Thyroid | ATC | regulation of protein binding | 110/6293 | 196/18723 | 6.99e-11 | 2.22e-09 | 110 |
| Page: 1 2 3 4 5 6 |
| Pathway ID | Tissue | Disease Stage | Description | Gene Ratio | Bg Ratio | pvalue | p.adjust | qvalue | Count |
| Page: 1 |
Top |
Cell-cell communication analysis |
| Identification of potential cell-cell interactions between two cell types and their ligand-receptor pairs for different disease states |
| Ligand | Receptor | LRpair | Pathway | Tissue | Disease Stage |
| SEMA3C | PLXND1 | SEMA3C_PLXND1 | SEMA3 | Breast | DCIS |
| SEMA3C | PLXND1 | SEMA3C_PLXND1 | SEMA3 | Breast | Healthy |
| SEMA3C | PLXND1 | SEMA3C_PLXND1 | SEMA3 | Cervix | ADJ |
| SEMA3C | PLXND1 | SEMA3C_PLXND1 | SEMA3 | Cervix | CC |
| SEMA3C | PLXND1 | SEMA3C_PLXND1 | SEMA3 | Cervix | Precancer |
| SEMA3C | PLXND1 | SEMA3C_PLXND1 | SEMA3 | CRC | AD |
| SEMA3C | PLXND1 | SEMA3C_PLXND1 | SEMA3 | CRC | CRC |
| SEMA3C | PLXND1 | SEMA3C_PLXND1 | SEMA3 | CRC | FAP |
| SEMA3C | PLXND1 | SEMA3C_PLXND1 | SEMA3 | CRC | MSI-H |
| SEMA3E | PLXND1 | SEMA3E_PLXND1 | SEMA3 | CRC | MSI-H |
| SEMA3C | PLXND1 | SEMA3C_PLXND1 | SEMA3 | CRC | MSS |
| SEMA3E | PLXND1 | SEMA3E_PLXND1 | SEMA3 | CRC | MSS |
| SEMA3C | PLXND1 | SEMA3C_PLXND1 | SEMA3 | CRC | SER |
| SEMA3C | PLXND1 | SEMA3C_PLXND1 | SEMA3 | Endometrium | ADJ |
| SEMA3C | PLXND1 | SEMA3C_PLXND1 | SEMA3 | Endometrium | AEH |
| SEMA3C | PLXND1 | SEMA3C_PLXND1 | SEMA3 | Esophagus | ESCC |
| SEMA3E | PLXND1 | SEMA3E_PLXND1 | SEMA3 | Esophagus | ESCC |
| SEMA3C | PLXND1 | SEMA3C_PLXND1 | SEMA3 | GC | ADJ |
| SEMA3C | PLXND1 | SEMA3C_PLXND1 | SEMA3 | HNSCC | ADJ |
| SEMA3C | PLXND1 | SEMA3C_PLXND1 | SEMA3 | HNSCC | OSCC |
| Page: 1 |
Top |
Single-cell gene regulatory network inference analysis |
| Find out the significant the regulons (TFs) and the target genes of each regulon across cell types for different disease states |
| TF | Cell Type | Tissue | Disease Stage | Target Gene | RSS | Regulon Activity |
| ∗The dot plots of a searched regulon are shown for all cell subpopulations in each disease state of each tissue based on the regulon specific score inferred using pySCENIC and by calculating the average expression. |
| Page: 1 |
Top |
Somatic mutation of malignant transformation related genes |
| Annotation of somatic variants for genes involved in malignant transformation |
| Hugo Symbol | Variant Class | Variant Classification | dbSNP RS | HGVSc | HGVSp | HGVSp Short | SWISSPROT | BIOTYPE | SIFT | PolyPhen | Tumor Sample Barcode | Tissue | Histology | Sex | Age | Stage | Therapy Types | Drugs | Outcome |
| PLXND1 | SNV | Missense_Mutation | c.3667N>A | p.Asp1223Asn | p.D1223N | Q9Y4D7 | protein_coding | tolerated(0.4) | benign(0) | TCGA-E2-A14O-01 | Breast | breast invasive carcinoma | Female | >=65 | III/IV | Hormone Therapy | arimidex | SD | |
| PLXND1 | SNV | Missense_Mutation | c.4069C>T | p.Arg1357Cys | p.R1357C | Q9Y4D7 | protein_coding | deleterious(0) | probably_damaging(0.999) | TCGA-E9-A1RF-01 | Breast | breast invasive carcinoma | Female | >=65 | III/IV | Hormone Therapy | tamoxiphen | SD | |
| PLXND1 | SNV | Missense_Mutation | novel | c.441N>A | p.Phe147Leu | p.F147L | Q9Y4D7 | protein_coding | tolerated(0.38) | benign(0.011) | TCGA-LL-A8F5-01 | Breast | breast invasive carcinoma | Female | <65 | I/II | Chemotherapy | cyclophosphamide | SD |
| PLXND1 | deletion | In_Frame_Del | c.4453_4461delNNNNNNNNN | p.Arg1485_Glu1487del | p.R1485_E1487del | Q9Y4D7 | protein_coding | TCGA-A8-A08L-01 | Breast | breast invasive carcinoma | Female | >=65 | III/IV | Unknown | Unknown | SD | |||
| PLXND1 | SNV | Missense_Mutation | rs748102549 | c.3277C>T | p.Arg1093Cys | p.R1093C | Q9Y4D7 | protein_coding | deleterious(0.02) | probably_damaging(0.938) | TCGA-2W-A8YY-01 | Cervix | cervical & endocervical cancer | Female | <65 | I/II | Chemotherapy | cisplatin | CR |
| PLXND1 | SNV | Missense_Mutation | rs781053507 | c.3725N>T | p.Ala1242Val | p.A1242V | Q9Y4D7 | protein_coding | tolerated(0.22) | benign(0.015) | TCGA-C5-A7X8-01 | Cervix | cervical & endocervical cancer | Female | <65 | I/II | Chemotherapy | cisplatin | SD |
| PLXND1 | SNV | Missense_Mutation | rs372693427 | c.3278G>A | p.Arg1093His | p.R1093H | Q9Y4D7 | protein_coding | tolerated(0.12) | probably_damaging(0.938) | TCGA-EA-A3HS-01 | Cervix | cervical & endocervical cancer | Female | <65 | I/II | Unknown | Unknown | SD |
| PLXND1 | SNV | Missense_Mutation | rs377455226 | c.4526N>T | p.Thr1509Met | p.T1509M | Q9Y4D7 | protein_coding | deleterious(0) | probably_damaging(1) | TCGA-EA-A410-01 | Cervix | cervical & endocervical cancer | Female | <65 | I/II | Unknown | Unknown | SD |
| PLXND1 | SNV | Missense_Mutation | c.3901G>A | p.Glu1301Lys | p.E1301K | Q9Y4D7 | protein_coding | deleterious(0.02) | probably_damaging(0.994) | TCGA-Q1-A73O-01 | Cervix | cervical & endocervical cancer | Female | <65 | I/II | Chemotherapy | cisplatin | CR | |
| PLXND1 | SNV | Missense_Mutation | novel | c.3431G>T | p.Arg1144Leu | p.R1144L | Q9Y4D7 | protein_coding | tolerated(0.75) | benign(0.001) | TCGA-Q1-A73R-01 | Cervix | cervical & endocervical cancer | Female | <65 | I/II | Unknown | Unknown | SD |
| Page: 1 2 3 4 5 6 7 8 9 10 11 12 13 14 15 16 17 18 |
Top |
Related drugs of malignant transformation related genes |
| Identification of chemicals and drugs interact with genes involved in malignant transfromation |
| (DGIdb 4.0) |
| Entrez ID | Symbol | Category | Interaction Types | Drug Claim Name | Drug Name | PMIDs |
| Page: 1 |

Copyright 2023-Present -The University of Texas Health Science Center at Houston |