
|
|||||
|
 | |
| |
| |
| |
| |
| |
|
Gene: PIM2 |
Gene summary for PIM2 |
| Gene information | Species | Human | Gene symbol | PIM2 | Gene ID | 11040 |
| Gene name | Pim-2 proto-oncogene, serine/threonine kinase | |
| Gene Alias | PIM2 | |
| Cytomap | Xp11.23 | |
| Gene Type | protein-coding | GO ID | GO:0000082 | UniProtAcc | A0A024QYW7 |
Top |
Malignant transformation analysis |
| Identification of the aberrant gene expression in precancerous and cancerous lesions by comparing the gene expression of stem-like cells in diseased tissues with normal stem cells |
| Entrez ID | Symbol | Replicates | Species | Organ | Tissue | Adj P-value | Log2FC | Malignancy |
| 11040 | PIM2 | LZE4T | Human | Esophagus | ESCC | 6.44e-05 | 2.95e-01 | 0.0811 |
| 11040 | PIM2 | LZE7T | Human | Esophagus | ESCC | 3.68e-10 | 5.88e-01 | 0.0667 |
| 11040 | PIM2 | LZE8T | Human | Esophagus | ESCC | 1.53e-05 | 3.15e-01 | 0.067 |
| 11040 | PIM2 | LZE20T | Human | Esophagus | ESCC | 4.72e-04 | 1.98e-01 | 0.0662 |
| 11040 | PIM2 | LZE22D1 | Human | Esophagus | HGIN | 1.34e-02 | 3.28e-01 | 0.0595 |
| 11040 | PIM2 | LZE24T | Human | Esophagus | ESCC | 7.64e-03 | 1.25e-01 | 0.0596 |
| 11040 | PIM2 | LZE21T | Human | Esophagus | ESCC | 6.08e-05 | 3.55e-01 | 0.0655 |
| 11040 | PIM2 | LZE6T | Human | Esophagus | ESCC | 2.28e-05 | 3.79e-01 | 0.0845 |
| 11040 | PIM2 | P1T-E | Human | Esophagus | ESCC | 4.45e-03 | 1.53e-01 | 0.0875 |
| 11040 | PIM2 | P2T-E | Human | Esophagus | ESCC | 7.65e-20 | 3.38e-01 | 0.1177 |
| 11040 | PIM2 | P4T-E | Human | Esophagus | ESCC | 1.12e-13 | 3.08e-01 | 0.1323 |
| 11040 | PIM2 | P5T-E | Human | Esophagus | ESCC | 1.83e-12 | 3.14e-01 | 0.1327 |
| 11040 | PIM2 | P8T-E | Human | Esophagus | ESCC | 1.19e-09 | 1.82e-01 | 0.0889 |
| 11040 | PIM2 | P9T-E | Human | Esophagus | ESCC | 4.18e-06 | 1.57e-01 | 0.1131 |
| 11040 | PIM2 | P10T-E | Human | Esophagus | ESCC | 1.09e-10 | 1.51e-01 | 0.116 |
| 11040 | PIM2 | P11T-E | Human | Esophagus | ESCC | 9.53e-12 | 4.71e-01 | 0.1426 |
| 11040 | PIM2 | P12T-E | Human | Esophagus | ESCC | 3.22e-13 | 2.36e-01 | 0.1122 |
| 11040 | PIM2 | P15T-E | Human | Esophagus | ESCC | 7.78e-15 | 2.84e-01 | 0.1149 |
| 11040 | PIM2 | P16T-E | Human | Esophagus | ESCC | 2.16e-17 | 3.18e-01 | 0.1153 |
| 11040 | PIM2 | P17T-E | Human | Esophagus | ESCC | 5.73e-03 | 1.91e-01 | 0.1278 |
| Page: 1 2 3 4 |
| Tissue | Expression Dynamics | Abbreviation |
| Esophagus | 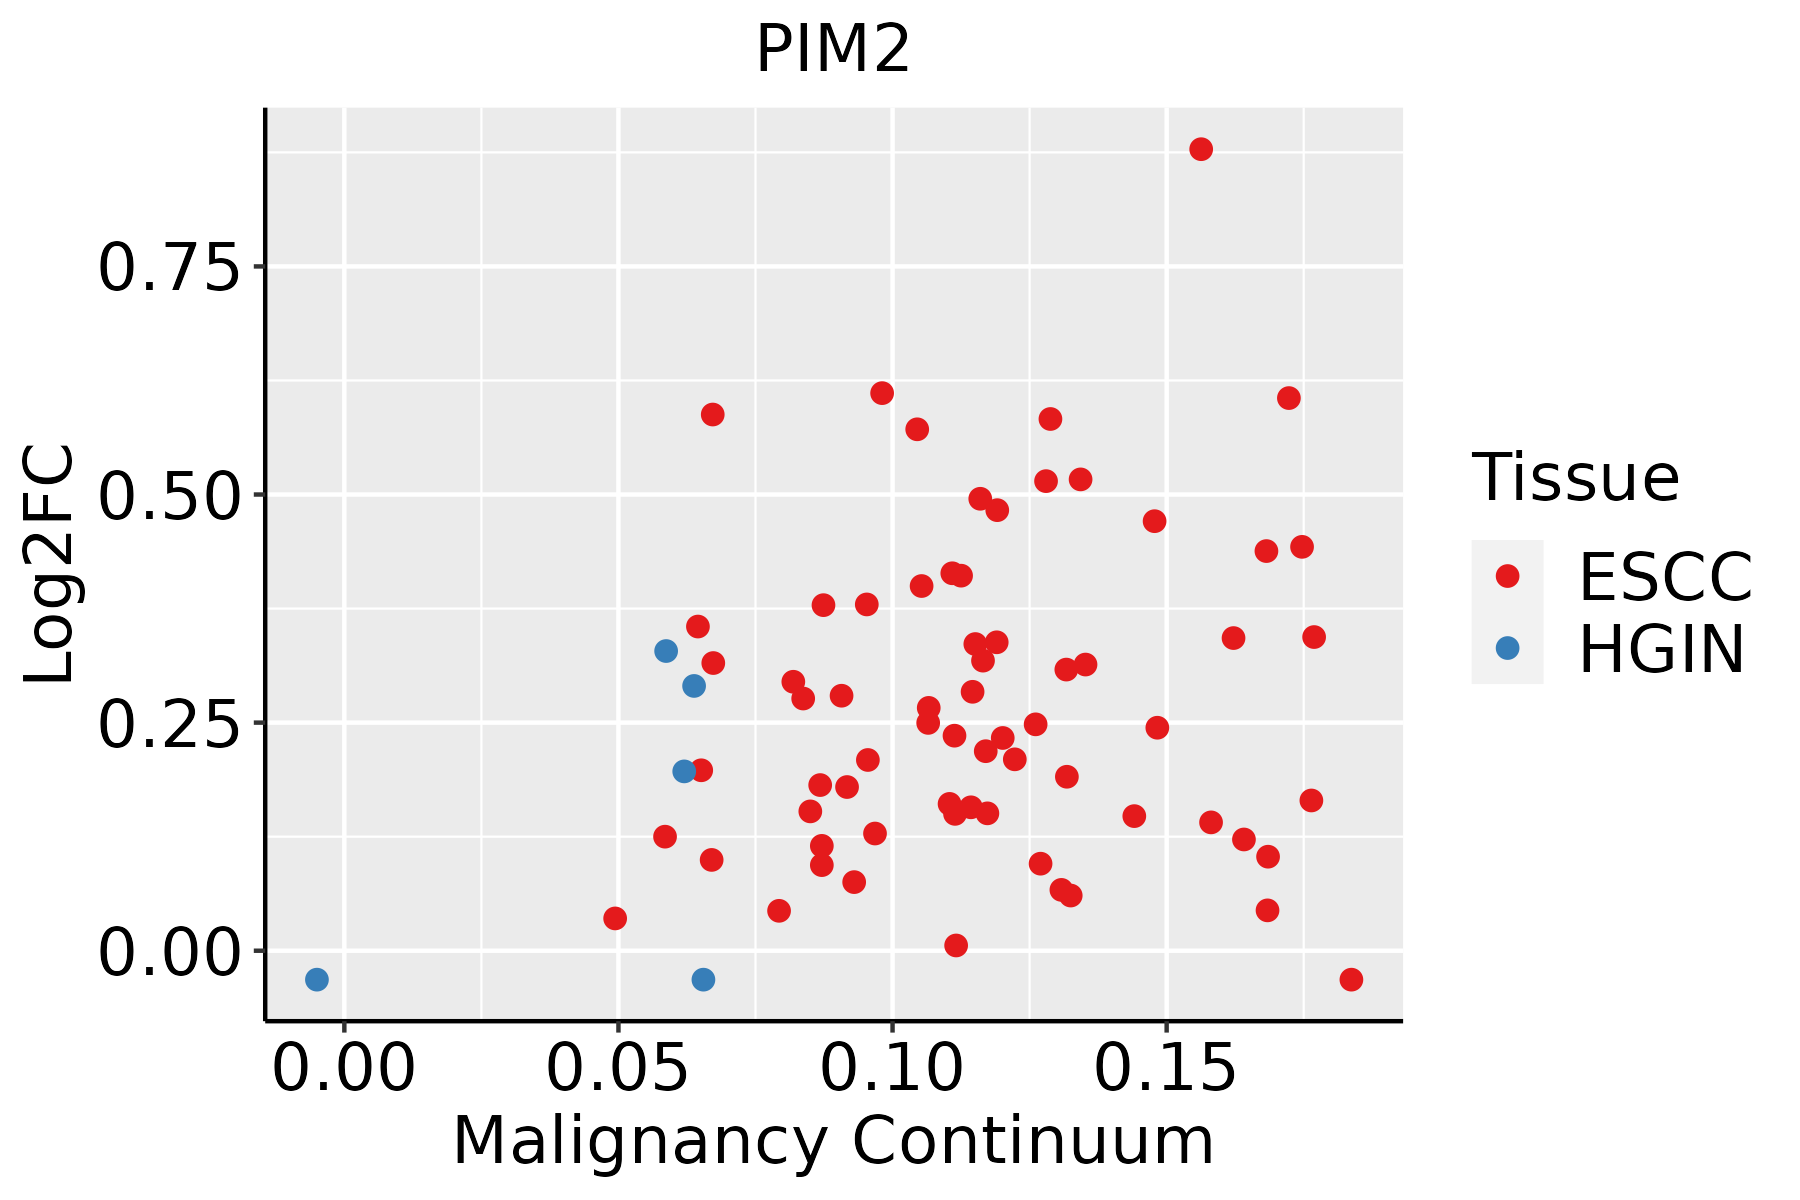 | ESCC: Esophageal squamous cell carcinoma |
| HGIN: High-grade intraepithelial neoplasias | ||
| LGIN: Low-grade intraepithelial neoplasias | ||
| Oral Cavity | 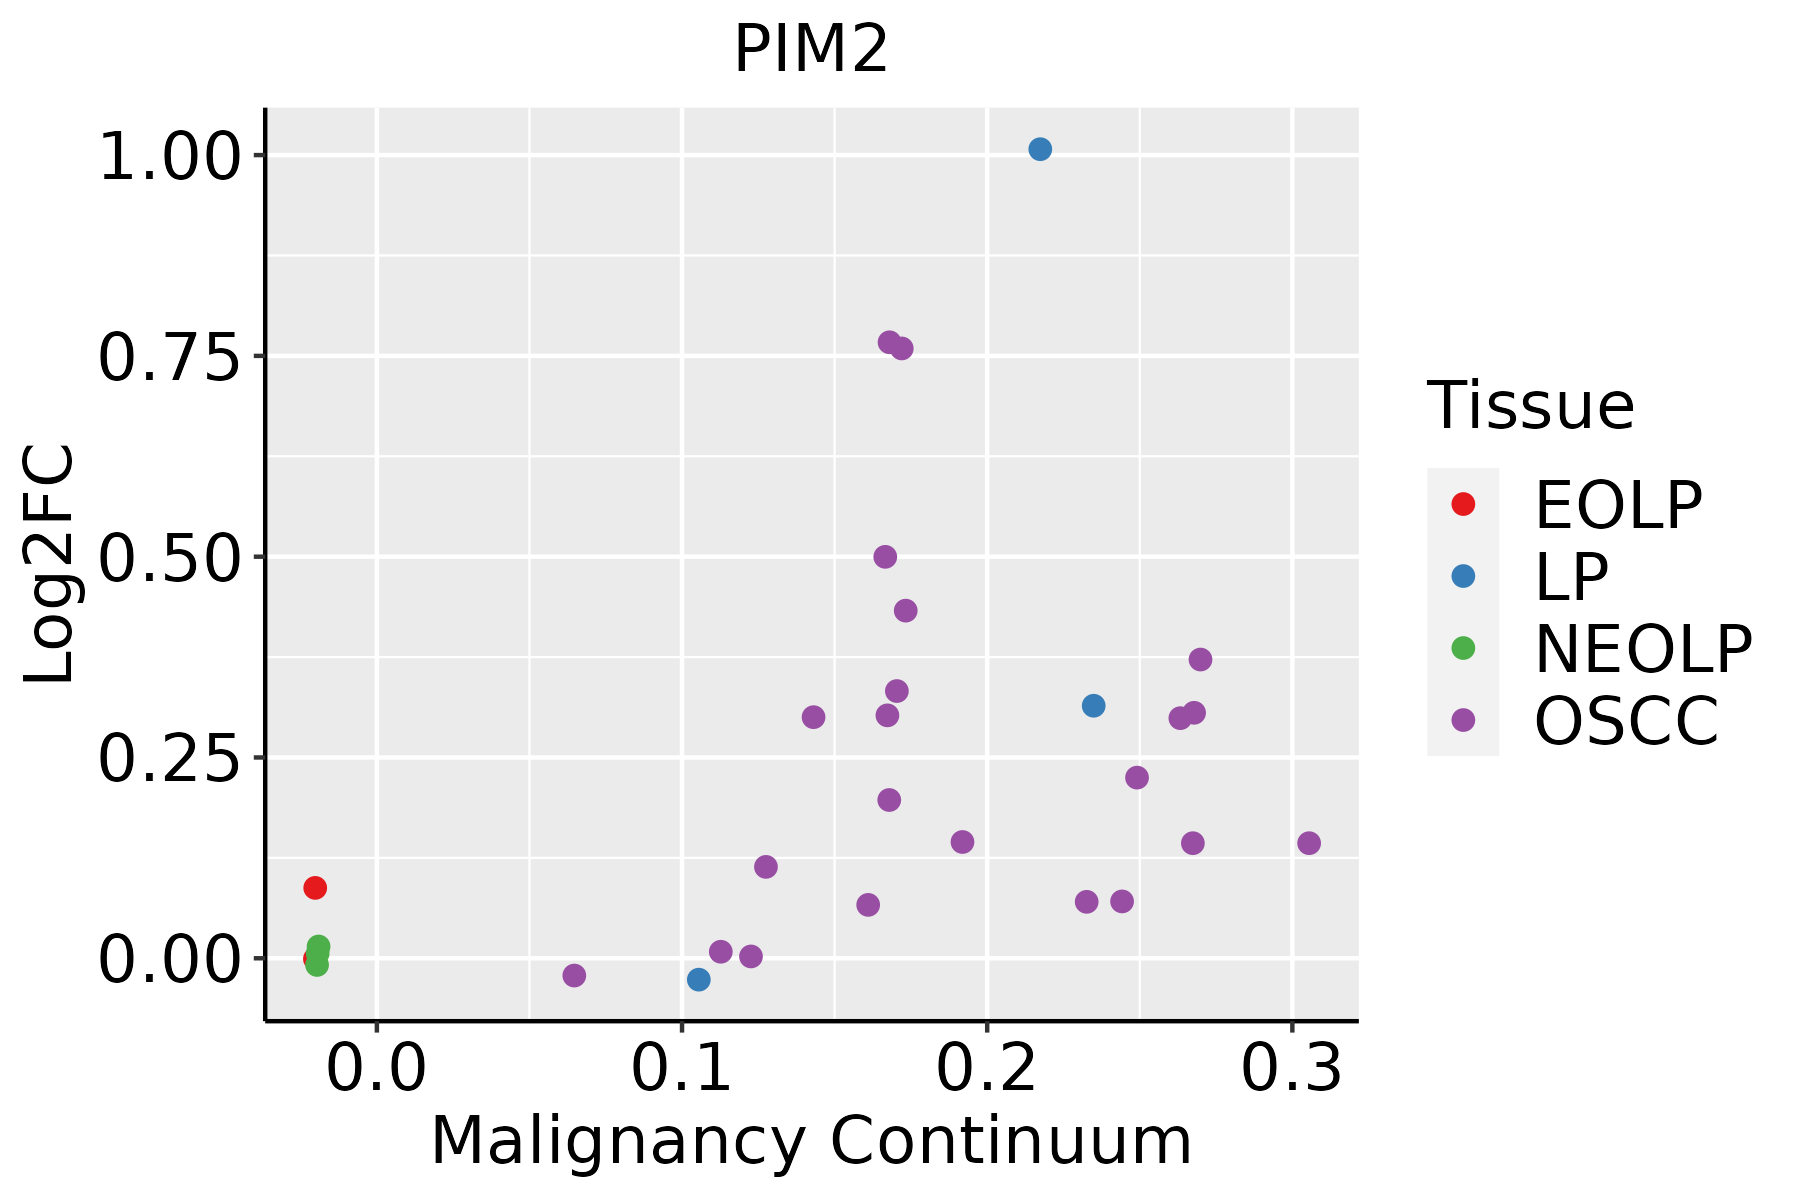 | EOLP: Erosive Oral lichen planus |
| LP: leukoplakia | ||
| NEOLP: Non-erosive oral lichen planus | ||
| OSCC: Oral squamous cell carcinoma |
| ∗log2FC in expression of this searched gene in stem-like cells from each diseased tissue sample relative to stem-like cells in normal samples in each tissue plotted against the malignancy continuum. Samples are colored based on if they are from different disease stage. |
Top |
Malignant transformation related pathway analysis |
| Find out the enriched GO biological processes and KEGG pathways involved in transition from healthy to precancer to cancer |
| Tissue | Disease Stage | Enriched GO biological Processes |
| Colorectum | AD |  |
| Colorectum | SER |  |
| Colorectum | MSS |  |
| Colorectum | MSI-H |  |
| Colorectum | FAP |  |
| ∗Top 15 enriched GO BP terms are showed in the bar plot of each disease state in each tissue. Each row represents a significant GO biological process which is colored according to the -log10(p.adjust). |
| Page: 1 2 3 4 5 6 7 8 9 |
| GO ID | Tissue | Disease Stage | Description | Gene Ratio | Bg Ratio | pvalue | p.adjust | Count |
| GO:00105087 | Oral cavity | OSCC | positive regulation of autophagy | 77/7305 | 124/18723 | 1.59e-07 | 2.61e-06 | 77 |
| GO:00000826 | Oral cavity | OSCC | G1/S transition of mitotic cell cycle | 120/7305 | 214/18723 | 2.86e-07 | 4.40e-06 | 120 |
| GO:00448436 | Oral cavity | OSCC | cell cycle G1/S phase transition | 131/7305 | 241/18723 | 8.77e-07 | 1.20e-05 | 131 |
| GO:00467779 | Oral cavity | OSCC | protein autophosphorylation | 123/7305 | 227/18723 | 2.31e-06 | 2.93e-05 | 123 |
| GO:0031647110 | Oral cavity | LP | regulation of protein stability | 132/4623 | 298/18723 | 8.16e-14 | 7.99e-12 | 132 |
| GO:004312316 | Oral cavity | LP | positive regulation of I-kappaB kinase/NF-kappaB signaling | 88/4623 | 186/18723 | 1.58e-11 | 1.13e-09 | 88 |
| GO:001050615 | Oral cavity | LP | regulation of autophagy | 132/4623 | 317/18723 | 1.82e-11 | 1.28e-09 | 132 |
| GO:0009896110 | Oral cavity | LP | positive regulation of catabolic process | 187/4623 | 492/18723 | 2.30e-11 | 1.58e-09 | 187 |
| GO:0050821110 | Oral cavity | LP | protein stabilization | 88/4623 | 191/18723 | 9.15e-11 | 5.51e-09 | 88 |
| GO:0031331110 | Oral cavity | LP | positive regulation of cellular catabolic process | 163/4623 | 427/18723 | 3.03e-10 | 1.59e-08 | 163 |
| GO:000961516 | Oral cavity | LP | response to virus | 143/4623 | 367/18723 | 7.42e-10 | 3.52e-08 | 143 |
| GO:004312219 | Oral cavity | LP | regulation of I-kappaB kinase/NF-kappaB signaling | 103/4623 | 249/18723 | 4.48e-09 | 1.90e-07 | 103 |
| GO:000724917 | Oral cavity | LP | I-kappaB kinase/NF-kappaB signaling | 110/4623 | 281/18723 | 4.94e-08 | 1.70e-06 | 110 |
| GO:000734614 | Oral cavity | LP | regulation of mitotic cell cycle | 163/4623 | 457/18723 | 7.64e-08 | 2.56e-06 | 163 |
| GO:004477215 | Oral cavity | LP | mitotic cell cycle phase transition | 150/4623 | 424/18723 | 4.38e-07 | 1.23e-05 | 150 |
| GO:000008213 | Oral cavity | LP | G1/S transition of mitotic cell cycle | 80/4623 | 214/18723 | 2.30e-05 | 3.74e-04 | 80 |
| GO:004484313 | Oral cavity | LP | cell cycle G1/S phase transition | 88/4623 | 241/18723 | 2.62e-05 | 4.21e-04 | 88 |
| GO:001050815 | Oral cavity | LP | positive regulation of autophagy | 44/4623 | 124/18723 | 4.61e-03 | 2.93e-02 | 44 |
| Page: 1 2 3 |
| Pathway ID | Tissue | Disease Stage | Description | Gene Ratio | Bg Ratio | pvalue | p.adjust | qvalue | Count |
| hsa052215 | Esophagus | ESCC | Acute myeloid leukemia | 49/4205 | 67/8465 | 7.43e-05 | 3.07e-04 | 1.57e-04 | 49 |
| hsa0522113 | Esophagus | ESCC | Acute myeloid leukemia | 49/4205 | 67/8465 | 7.43e-05 | 3.07e-04 | 1.57e-04 | 49 |
| hsa052214 | Oral cavity | OSCC | Acute myeloid leukemia | 42/3704 | 67/8465 | 1.34e-03 | 3.75e-03 | 1.91e-03 | 42 |
| hsa0522112 | Oral cavity | OSCC | Acute myeloid leukemia | 42/3704 | 67/8465 | 1.34e-03 | 3.75e-03 | 1.91e-03 | 42 |
| Page: 1 |
Top |
Cell-cell communication analysis |
| Identification of potential cell-cell interactions between two cell types and their ligand-receptor pairs for different disease states |
| Ligand | Receptor | LRpair | Pathway | Tissue | Disease Stage |
| Page: 1 |
Top |
Single-cell gene regulatory network inference analysis |
| Find out the significant the regulons (TFs) and the target genes of each regulon across cell types for different disease states |
| TF | Cell Type | Tissue | Disease Stage | Target Gene | RSS | Regulon Activity |
| ∗The dot plots of a searched regulon are shown for all cell subpopulations in each disease state of each tissue based on the regulon specific score inferred using pySCENIC and by calculating the average expression. |
| Page: 1 |
Top |
Somatic mutation of malignant transformation related genes |
| Annotation of somatic variants for genes involved in malignant transformation |
| Hugo Symbol | Variant Class | Variant Classification | dbSNP RS | HGVSc | HGVSp | HGVSp Short | SWISSPROT | BIOTYPE | SIFT | PolyPhen | Tumor Sample Barcode | Tissue | Histology | Sex | Age | Stage | Therapy Types | Drugs | Outcome |
| PIM2 | SNV | Missense_Mutation | c.915N>C | p.Leu305Phe | p.L305F | Q9P1W9 | protein_coding | tolerated_low_confidence(0.08) | possibly_damaging(0.69) | TCGA-A2-A0SY-01 | Breast | breast invasive carcinoma | Female | <65 | III/IV | Hormone Therapy | arimidex | SD | |
| PIM2 | SNV | Missense_Mutation | rs782277942 | c.520N>T | p.Arg174Cys | p.R174C | Q9P1W9 | protein_coding | tolerated(0.07) | benign(0.02) | TCGA-BH-A0HL-01 | Breast | breast invasive carcinoma | Female | <65 | I/II | Chemotherapy | cyclophosphamide | SD |
| PIM2 | SNV | Missense_Mutation | novel | c.97C>G | p.Arg33Gly | p.R33G | Q9P1W9 | protein_coding | deleterious(0.01) | benign(0.262) | TCGA-C8-A8HQ-01 | Breast | breast invasive carcinoma | Female | <65 | I/II | Unknown | Unknown | SD |
| PIM2 | SNV | Missense_Mutation | novel | c.208G>T | p.Gly70Cys | p.G70C | Q9P1W9 | protein_coding | deleterious(0.04) | benign(0.06) | TCGA-E9-A22E-01 | Breast | breast invasive carcinoma | Female | <65 | III/IV | Chemotherapy | cyclophosphane | SD |
| PIM2 | insertion | Frame_Shift_Ins | novel | c.329_330insACTGCCAAAAAGT | p.Gly111LeufsTer21 | p.G111Lfs*21 | Q9P1W9 | protein_coding | TCGA-A8-A07G-01 | Breast | breast invasive carcinoma | Female | >=65 | I/II | Chemotherapy | 5-fluorouracil | CR | ||
| PIM2 | insertion | Frame_Shift_Ins | novel | c.327_328insAT | p.Glu110MetfsTer39 | p.E110Mfs*39 | Q9P1W9 | protein_coding | TCGA-A8-A07G-01 | Breast | breast invasive carcinoma | Female | >=65 | I/II | Chemotherapy | 5-fluorouracil | CR | ||
| PIM2 | deletion | Frame_Shift_Del | novel | c.486delT | p.Asp163ThrfsTer8 | p.D163Tfs*8 | Q9P1W9 | protein_coding | TCGA-D8-A27V-01 | Breast | breast invasive carcinoma | Female | <65 | I/II | Hormone Therapy | tamoxiphen | SD | ||
| PIM2 | SNV | Missense_Mutation | novel | c.574N>C | p.Glu192Gln | p.E192Q | Q9P1W9 | protein_coding | tolerated(0.07) | benign(0.066) | TCGA-UC-A7PD-01 | Cervix | cervical & endocervical cancer | Female | <65 | I/II | Unknown | Unknown | PD |
| PIM2 | SNV | Missense_Mutation | novel | c.362N>T | p.Pro121Leu | p.P121L | Q9P1W9 | protein_coding | tolerated(0.32) | benign(0.18) | TCGA-VS-A8Q8-01 | Cervix | cervical & endocervical cancer | Female | <65 | I/II | Unknown | Unknown | PD |
| PIM2 | SNV | Missense_Mutation | c.364N>A | p.Ala122Thr | p.A122T | Q9P1W9 | protein_coding | tolerated(0.13) | benign(0.071) | TCGA-AA-3855-01 | Colorectum | colon adenocarcinoma | Male | >=65 | I/II | Unknown | Unknown | SD |
| Page: 1 2 3 4 |
Top |
Related drugs of malignant transformation related genes |
| Identification of chemicals and drugs interact with genes involved in malignant transfromation |
| (DGIdb 4.0) |
| Entrez ID | Symbol | Category | Interaction Types | Drug Claim Name | Drug Name | PMIDs |
| 11040 | PIM2 | SERINE THREONINE KINASE, KINASE, DRUGGABLE GENOME, ENZYME | inhibitor | 178101947 | RUBOXISTAURIN | |
| 11040 | PIM2 | SERINE THREONINE KINASE, KINASE, DRUGGABLE GENOME, ENZYME | BAY-613606 | CHEMBL541400 | ||
| 11040 | PIM2 | SERINE THREONINE KINASE, KINASE, DRUGGABLE GENOME, ENZYME | inhibitor | CHEMBL3545194 | LGH-447 | |
| 11040 | PIM2 | SERINE THREONINE KINASE, KINASE, DRUGGABLE GENOME, ENZYME | inhibitor | 381118905 | ||
| 11040 | PIM2 | SERINE THREONINE KINASE, KINASE, DRUGGABLE GENOME, ENZYME | inhibitor | CHEMBL3545423 | AZD-1208 | |
| 11040 | PIM2 | SERINE THREONINE KINASE, KINASE, DRUGGABLE GENOME, ENZYME | inhibitor | 404859073 | ||
| 11040 | PIM2 | SERINE THREONINE KINASE, KINASE, DRUGGABLE GENOME, ENZYME | inhibitor | 223366031 | ||
| 11040 | PIM2 | SERINE THREONINE KINASE, KINASE, DRUGGABLE GENOME, ENZYME | inhibitor | 354702263 | ||
| 11040 | PIM2 | SERINE THREONINE KINASE, KINASE, DRUGGABLE GENOME, ENZYME | inhibitor | CHEMBL1952329 | SGI-1776 | |
| 11040 | PIM2 | SERINE THREONINE KINASE, KINASE, DRUGGABLE GENOME, ENZYME | inhibitor | 252827442 | SGI-1776 |
| Page: 1 2 |

Copyright 2023-Present -The University of Texas Health Science Center at Houston |