
|
|||||
|
 | |
| |
| |
| |
| |
| |
|
Gene: PHYH |
Gene summary for PHYH |
| Gene information | Species | Human | Gene symbol | PHYH | Gene ID | 5264 |
| Gene name | phytanoyl-CoA 2-hydroxylase | |
| Gene Alias | LN1 | |
| Cytomap | 10p13 | |
| Gene Type | protein-coding | GO ID | GO:0001561 | UniProtAcc | O14832 |
Top |
Malignant transformation analysis |
| Identification of the aberrant gene expression in precancerous and cancerous lesions by comparing the gene expression of stem-like cells in diseased tissues with normal stem cells |
| Entrez ID | Symbol | Replicates | Species | Organ | Tissue | Adj P-value | Log2FC | Malignancy |
| 5264 | PHYH | LZE3D | Human | Esophagus | HGIN | 4.40e-02 | 3.61e-01 | 0.0668 |
| 5264 | PHYH | LZE4T | Human | Esophagus | ESCC | 1.98e-12 | 2.82e-01 | 0.0811 |
| 5264 | PHYH | LZE7T | Human | Esophagus | ESCC | 3.52e-02 | 8.89e-02 | 0.0667 |
| 5264 | PHYH | LZE24T | Human | Esophagus | ESCC | 5.88e-05 | 2.52e-02 | 0.0596 |
| 5264 | PHYH | LZE6T | Human | Esophagus | ESCC | 1.42e-05 | 2.44e-01 | 0.0845 |
| 5264 | PHYH | P2T-E | Human | Esophagus | ESCC | 4.01e-15 | 1.21e-01 | 0.1177 |
| 5264 | PHYH | P4T-E | Human | Esophagus | ESCC | 1.05e-17 | 3.02e-01 | 0.1323 |
| 5264 | PHYH | P5T-E | Human | Esophagus | ESCC | 1.16e-06 | 1.52e-01 | 0.1327 |
| 5264 | PHYH | P8T-E | Human | Esophagus | ESCC | 5.14e-10 | 1.93e-01 | 0.0889 |
| 5264 | PHYH | P9T-E | Human | Esophagus | ESCC | 3.88e-11 | 1.41e-01 | 0.1131 |
| 5264 | PHYH | P10T-E | Human | Esophagus | ESCC | 8.60e-17 | 1.68e-01 | 0.116 |
| 5264 | PHYH | P11T-E | Human | Esophagus | ESCC | 4.20e-14 | 4.26e-01 | 0.1426 |
| 5264 | PHYH | P12T-E | Human | Esophagus | ESCC | 1.80e-60 | 1.05e+00 | 0.1122 |
| 5264 | PHYH | P15T-E | Human | Esophagus | ESCC | 1.16e-07 | 1.49e-01 | 0.1149 |
| 5264 | PHYH | P16T-E | Human | Esophagus | ESCC | 2.89e-17 | 3.63e-01 | 0.1153 |
| 5264 | PHYH | P19T-E | Human | Esophagus | ESCC | 1.72e-06 | 3.10e-01 | 0.1662 |
| 5264 | PHYH | P20T-E | Human | Esophagus | ESCC | 6.16e-09 | 5.32e-02 | 0.1124 |
| 5264 | PHYH | P21T-E | Human | Esophagus | ESCC | 4.80e-31 | 5.79e-01 | 0.1617 |
| 5264 | PHYH | P22T-E | Human | Esophagus | ESCC | 4.91e-36 | 5.13e-01 | 0.1236 |
| 5264 | PHYH | P24T-E | Human | Esophagus | ESCC | 6.85e-07 | 8.95e-02 | 0.1287 |
| Page: 1 2 3 4 5 |
| Tissue | Expression Dynamics | Abbreviation |
| Esophagus | 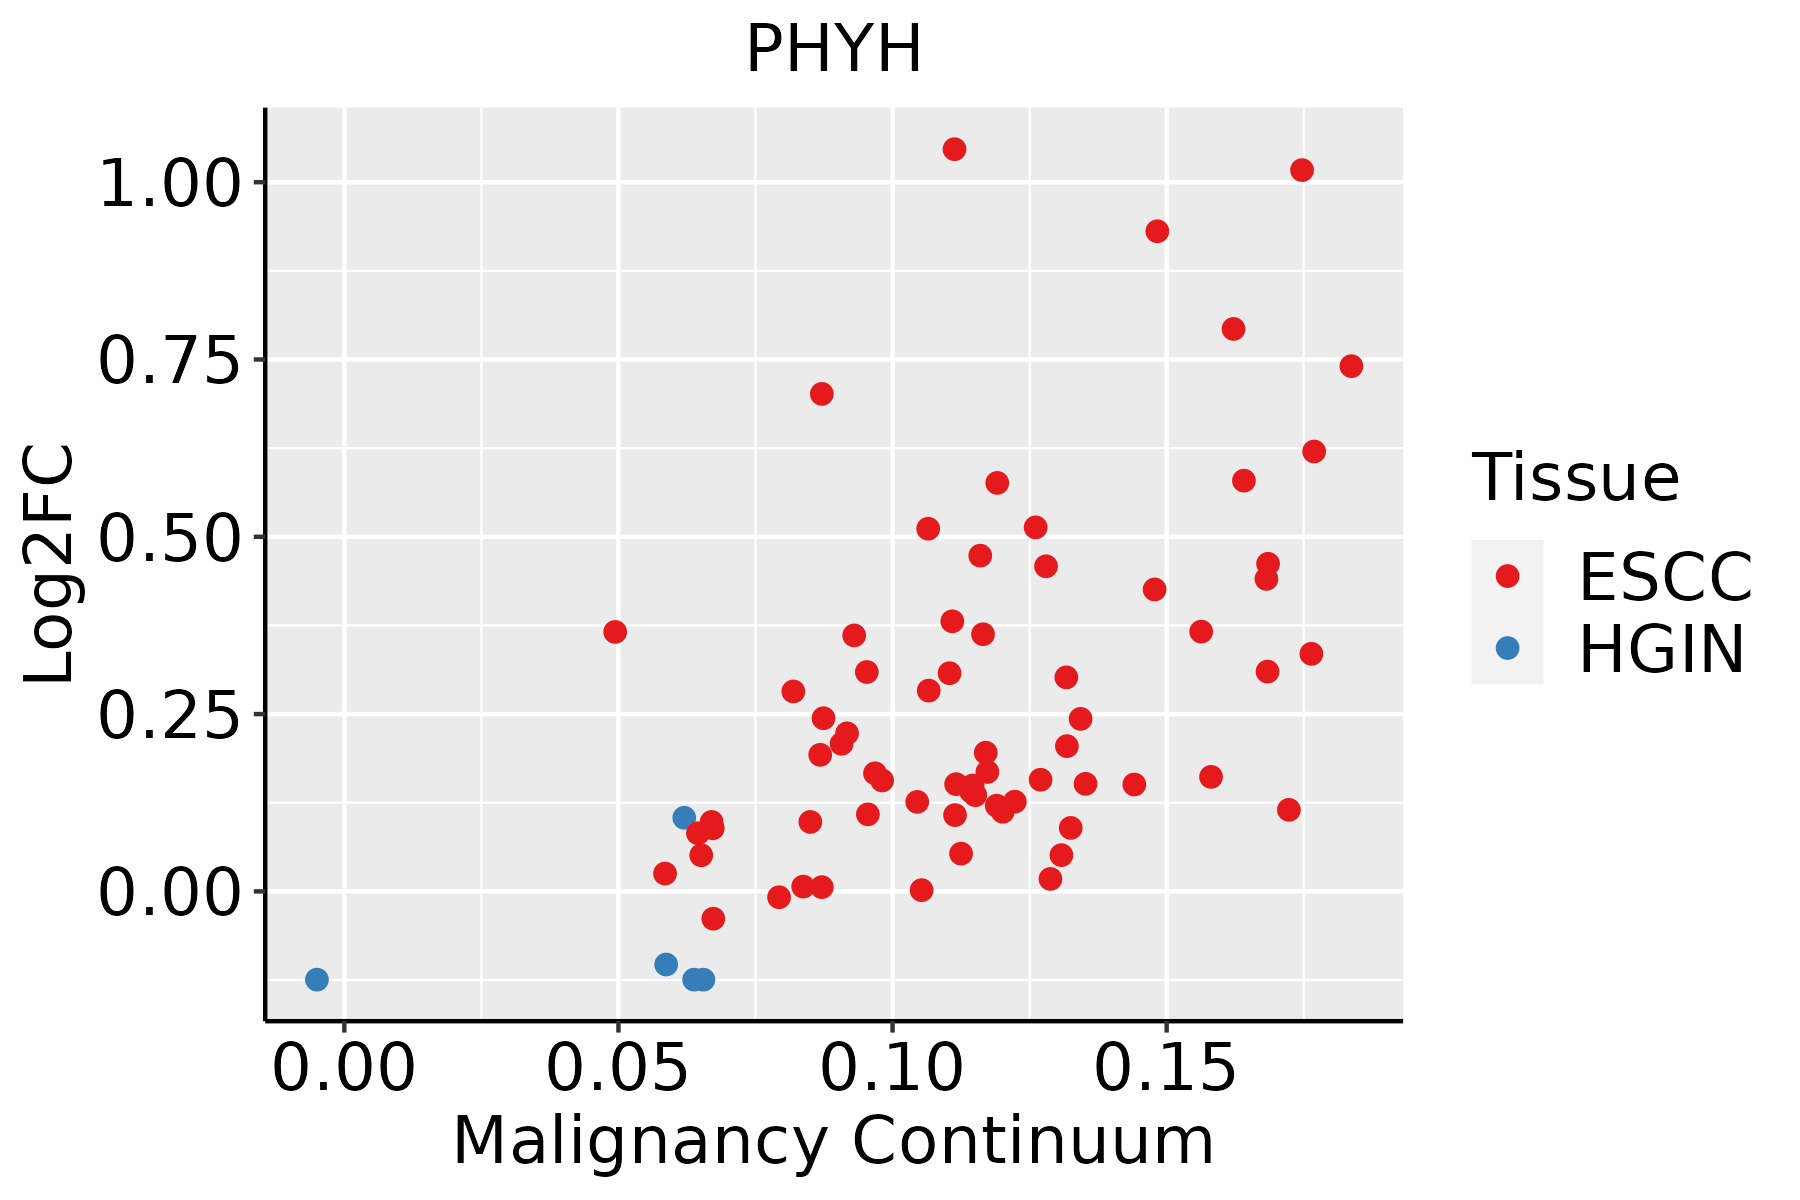 | ESCC: Esophageal squamous cell carcinoma |
| HGIN: High-grade intraepithelial neoplasias | ||
| LGIN: Low-grade intraepithelial neoplasias | ||
| Liver | 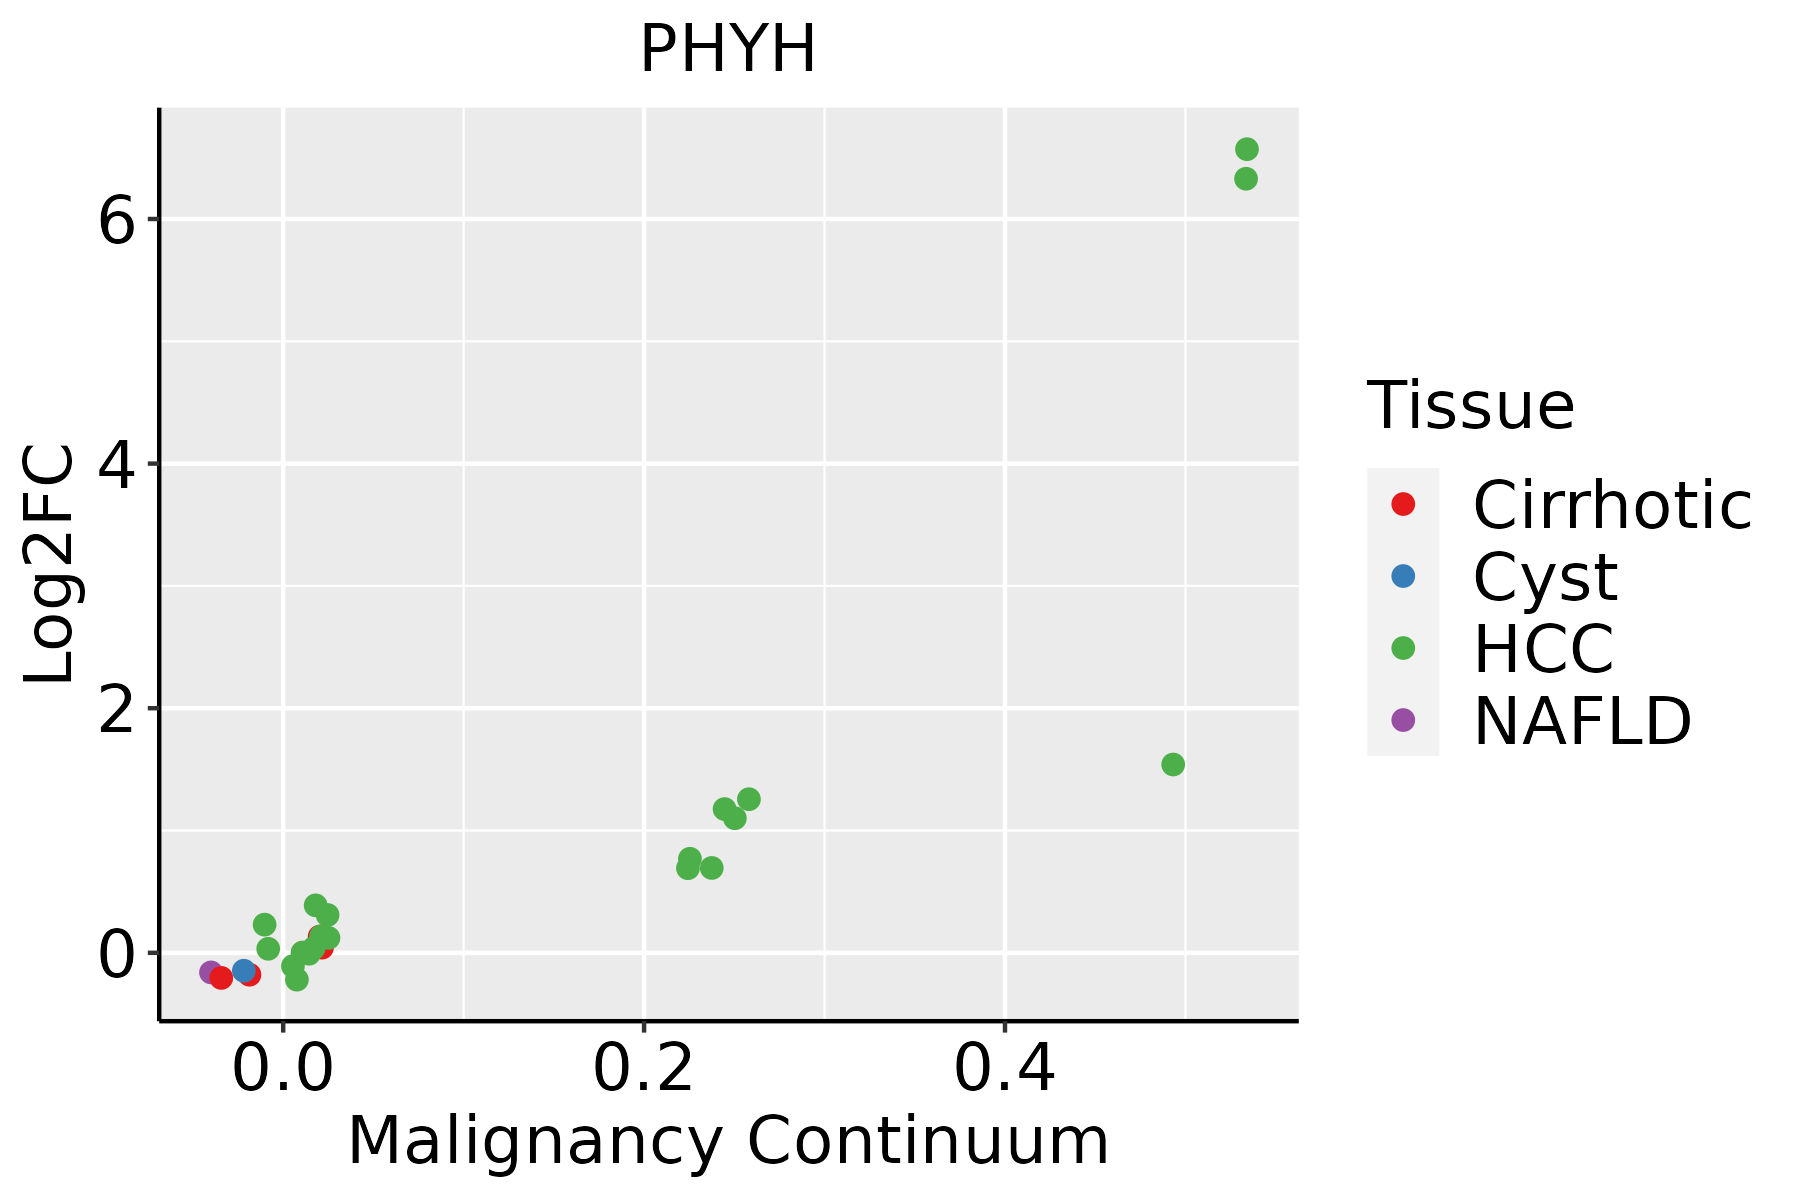 | HCC: Hepatocellular carcinoma |
| NAFLD: Non-alcoholic fatty liver disease | ||
| Oral Cavity | 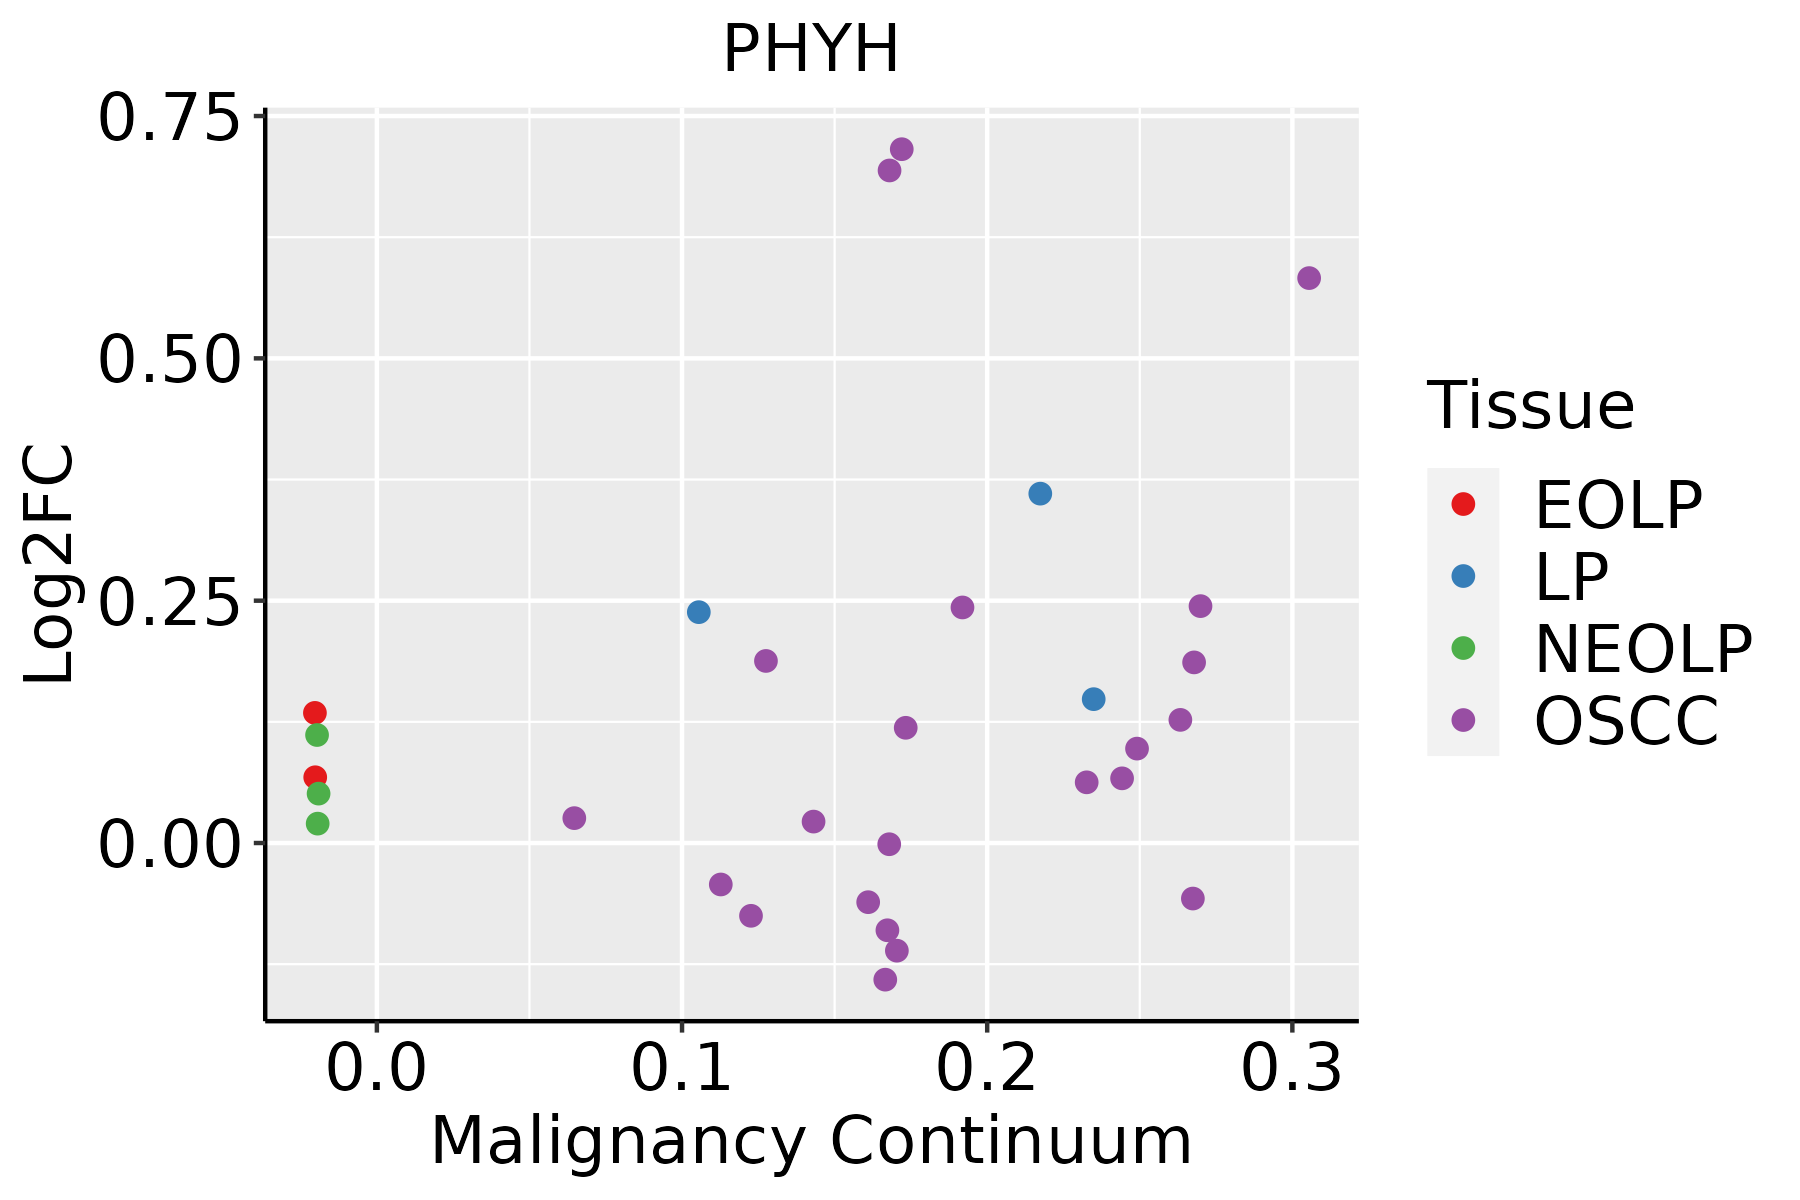 | EOLP: Erosive Oral lichen planus |
| LP: leukoplakia | ||
| NEOLP: Non-erosive oral lichen planus | ||
| OSCC: Oral squamous cell carcinoma | ||
| Thyroid | 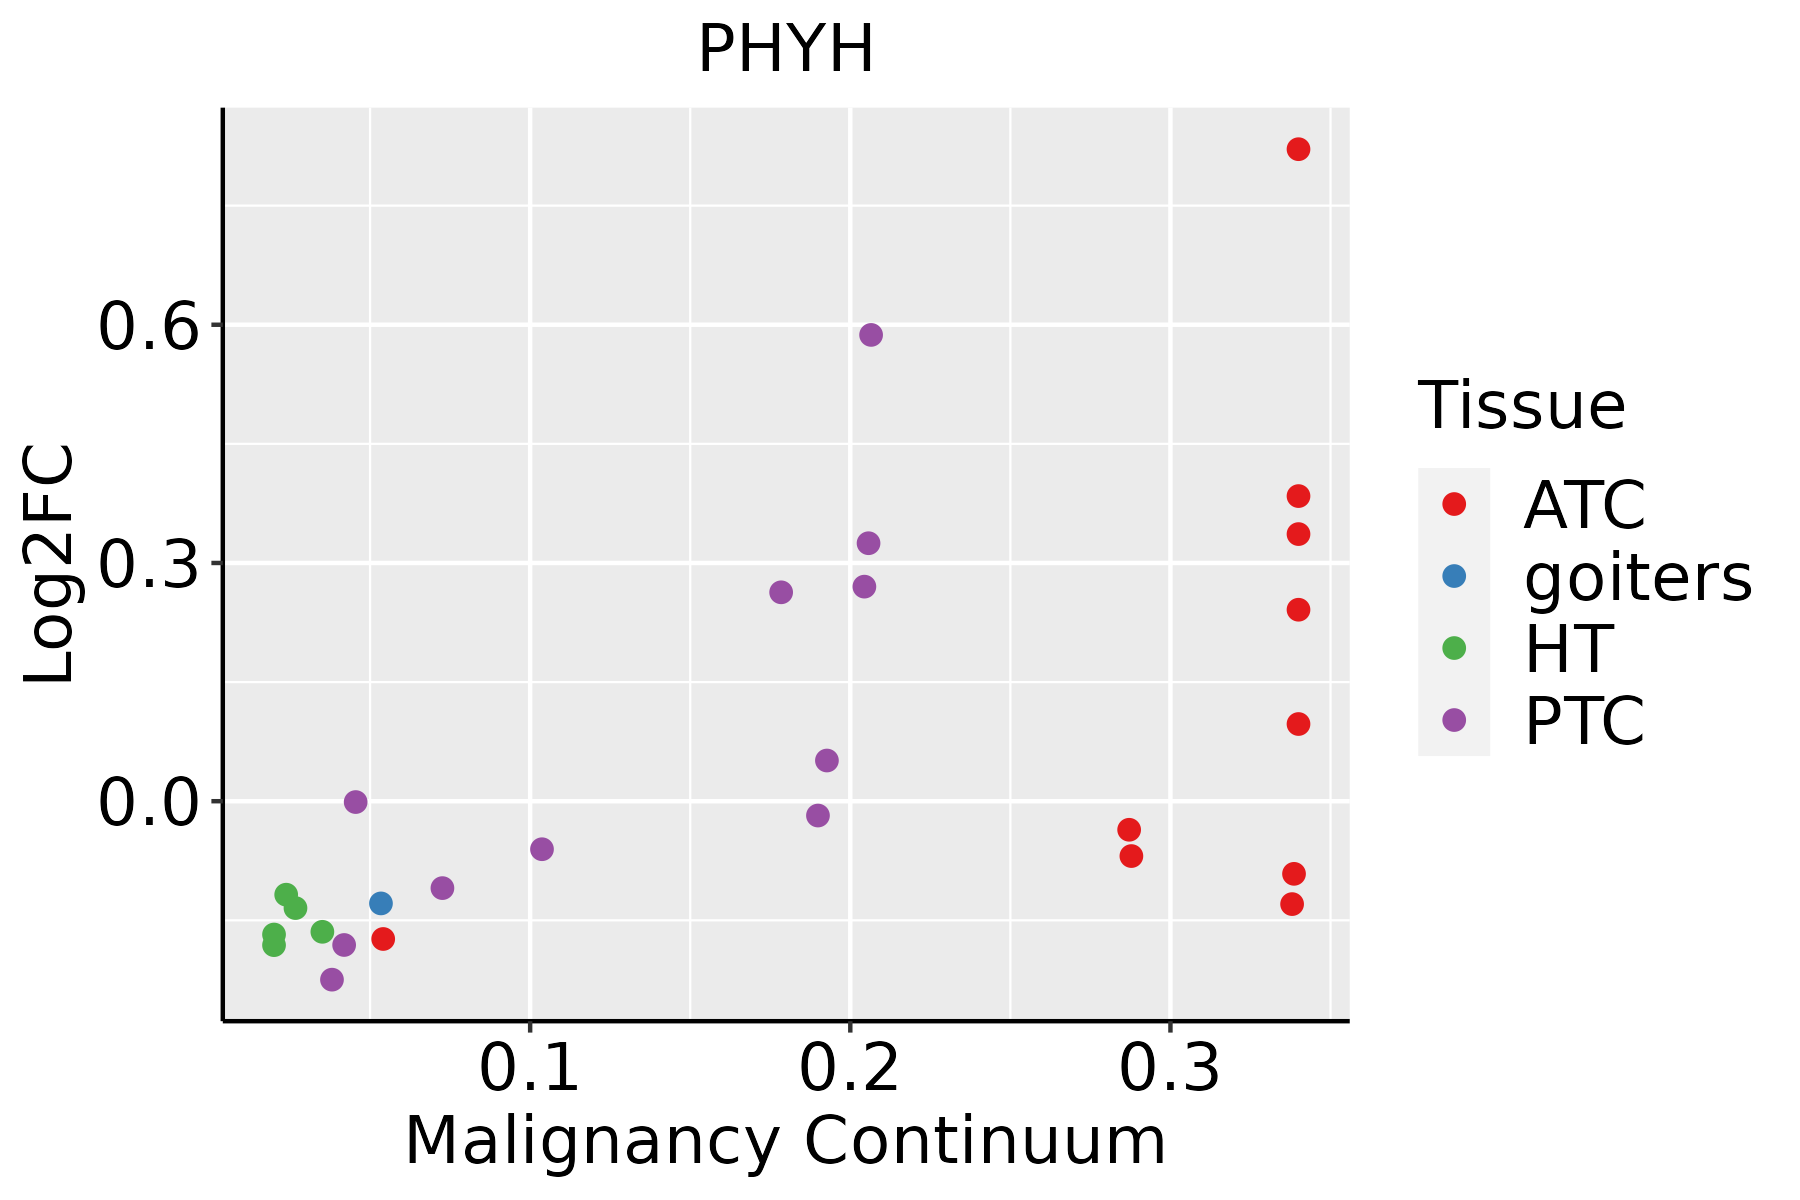 | ATC: Anaplastic thyroid cancer |
| HT: Hashimoto's thyroiditis | ||
| PTC: Papillary thyroid cancer |
| ∗log2FC in expression of this searched gene in stem-like cells from each diseased tissue sample relative to stem-like cells in normal samples in each tissue plotted against the malignancy continuum. Samples are colored based on if they are from different disease stage. |
Top |
Malignant transformation related pathway analysis |
| Find out the enriched GO biological processes and KEGG pathways involved in transition from healthy to precancer to cancer |
| Tissue | Disease Stage | Enriched GO biological Processes |
| Colorectum | AD |  |
| Colorectum | SER |  |
| Colorectum | MSS |  |
| Colorectum | MSI-H |  |
| Colorectum | FAP |  |
| ∗Top 15 enriched GO BP terms are showed in the bar plot of each disease state in each tissue. Each row represents a significant GO biological process which is colored according to the -log10(p.adjust). |
| Page: 1 2 3 4 5 6 7 8 9 |
| GO ID | Tissue | Disease Stage | Description | Gene Ratio | Bg Ratio | pvalue | p.adjust | Count |
| GO:00193957 | Oral cavity | OSCC | fatty acid oxidation | 57/7305 | 103/18723 | 5.58e-04 | 3.23e-03 | 57 |
| GO:00344406 | Oral cavity | OSCC | lipid oxidation | 59/7305 | 108/18723 | 7.01e-04 | 3.89e-03 | 59 |
| GO:00442826 | Oral cavity | OSCC | small molecule catabolic process | 174/7305 | 376/18723 | 2.25e-03 | 1.00e-02 | 174 |
| GO:00442426 | Oral cavity | OSCC | cellular lipid catabolic process | 104/7305 | 214/18723 | 2.61e-03 | 1.15e-02 | 104 |
| GO:00067203 | Oral cavity | OSCC | isoprenoid metabolic process | 59/7305 | 116/18723 | 6.18e-03 | 2.33e-02 | 59 |
| GO:00436484 | Oral cavity | OSCC | dicarboxylic acid metabolic process | 50/7305 | 96/18723 | 6.24e-03 | 2.35e-02 | 50 |
| GO:00193959 | Thyroid | ATC | fatty acid oxidation | 46/6293 | 103/18723 | 1.26e-02 | 4.42e-02 | 46 |
| Page: 1 2 3 |
| Pathway ID | Tissue | Disease Stage | Description | Gene Ratio | Bg Ratio | pvalue | p.adjust | qvalue | Count |
| hsa041467 | Esophagus | ESCC | Peroxisome | 55/4205 | 82/8465 | 1.04e-03 | 3.27e-03 | 1.68e-03 | 55 |
| hsa0414612 | Esophagus | ESCC | Peroxisome | 55/4205 | 82/8465 | 1.04e-03 | 3.27e-03 | 1.68e-03 | 55 |
| hsa041462 | Liver | Cirrhotic | Peroxisome | 36/2530 | 82/8465 | 4.79e-03 | 1.74e-02 | 1.07e-02 | 36 |
| hsa041463 | Liver | Cirrhotic | Peroxisome | 36/2530 | 82/8465 | 4.79e-03 | 1.74e-02 | 1.07e-02 | 36 |
| hsa041464 | Liver | HCC | Peroxisome | 58/4020 | 82/8465 | 1.57e-05 | 1.05e-04 | 5.85e-05 | 58 |
| hsa041465 | Liver | HCC | Peroxisome | 58/4020 | 82/8465 | 1.57e-05 | 1.05e-04 | 5.85e-05 | 58 |
| hsa041466 | Oral cavity | OSCC | Peroxisome | 47/3704 | 82/8465 | 9.01e-03 | 2.01e-02 | 1.03e-02 | 47 |
| hsa0414611 | Oral cavity | OSCC | Peroxisome | 47/3704 | 82/8465 | 9.01e-03 | 2.01e-02 | 1.03e-02 | 47 |
| Page: 1 |
Top |
Cell-cell communication analysis |
| Identification of potential cell-cell interactions between two cell types and their ligand-receptor pairs for different disease states |
| Ligand | Receptor | LRpair | Pathway | Tissue | Disease Stage |
| Page: 1 |
Top |
Single-cell gene regulatory network inference analysis |
| Find out the significant the regulons (TFs) and the target genes of each regulon across cell types for different disease states |
| TF | Cell Type | Tissue | Disease Stage | Target Gene | RSS | Regulon Activity |
| ∗The dot plots of a searched regulon are shown for all cell subpopulations in each disease state of each tissue based on the regulon specific score inferred using pySCENIC and by calculating the average expression. |
| Page: 1 |
Top |
Somatic mutation of malignant transformation related genes |
| Annotation of somatic variants for genes involved in malignant transformation |
| Hugo Symbol | Variant Class | Variant Classification | dbSNP RS | HGVSc | HGVSp | HGVSp Short | SWISSPROT | BIOTYPE | SIFT | PolyPhen | Tumor Sample Barcode | Tissue | Histology | Sex | Age | Stage | Therapy Types | Drugs | Outcome |
| PHYH | SNV | Missense_Mutation | c.1012C>G | p.Leu338Val | p.L338V | O14832 | protein_coding | deleterious(0) | possibly_damaging(0.708) | TCGA-E2-A14V-01 | Breast | breast invasive carcinoma | Female | <65 | I/II | Chemotherapy | cyclophosphamide | SD | |
| PHYH | deletion | Frame_Shift_Del | c.683delG | p.Gly228GlufsTer22 | p.G228Efs*22 | O14832 | protein_coding | TCGA-AN-A0AK-01 | Breast | breast invasive carcinoma | Female | >=65 | I/II | Unknown | Unknown | SD | |||
| PHYH | insertion | Frame_Shift_Ins | novel | c.278_279insAAAACCC | p.Leu96GlufsTer22 | p.L96Efs*22 | O14832 | protein_coding | TCGA-B6-A0IK-01 | Breast | breast invasive carcinoma | Female | <65 | III/IV | Unknown | Unknown | PD | ||
| PHYH | insertion | Frame_Shift_Ins | novel | c.276_277insCTTTGCGTCGGCTTAATTGCCAGTGTGTATGTCTGCCT | p.Val93LeufsTer14 | p.V93Lfs*14 | O14832 | protein_coding | TCGA-B6-A0IK-01 | Breast | breast invasive carcinoma | Female | <65 | III/IV | Unknown | Unknown | PD | ||
| PHYH | insertion | Frame_Shift_Ins | novel | c.262dupA | p.Ile88AsnfsTer28 | p.I88Nfs*28 | O14832 | protein_coding | TCGA-BH-A18G-01 | Breast | breast invasive carcinoma | Female | >=65 | I/II | Unknown | Unknown | SD | ||
| PHYH | deletion | Frame_Shift_Del | novel | c.330delA | p.Glu110AspfsTer8 | p.E110Dfs*8 | O14832 | protein_coding | TCGA-EW-A2FV-01 | Breast | breast invasive carcinoma | Female | <65 | III/IV | Chemotherapy | docetaxel | SD | ||
| PHYH | SNV | Missense_Mutation | rs150982538 | c.476N>C | p.Ile159Thr | p.I159T | O14832 | protein_coding | deleterious(0) | probably_damaging(0.999) | TCGA-C5-A3HE-01 | Cervix | cervical & endocervical cancer | Female | <65 | I/II | Unknown | Unknown | PD |
| PHYH | SNV | Missense_Mutation | rs752028596 | c.512N>A | p.Arg171His | p.R171H | O14832 | protein_coding | deleterious(0) | probably_damaging(0.996) | TCGA-A6-5661-01 | Colorectum | colon adenocarcinoma | Female | >=65 | I/II | Unknown | Unknown | SD |
| PHYH | SNV | Missense_Mutation | rs764637574 | c.173N>T | p.Arg58Ile | p.R58I | O14832 | protein_coding | deleterious(0.01) | benign(0.248) | TCGA-AA-A00N-01 | Colorectum | colon adenocarcinoma | Male | >=65 | I/II | Unknown | Unknown | PD |
| PHYH | SNV | Missense_Mutation | c.933N>A | p.Phe311Leu | p.F311L | O14832 | protein_coding | tolerated(0.81) | benign(0) | TCGA-CA-6718-01 | Colorectum | colon adenocarcinoma | Male | <65 | I/II | Unknown | Unknown | PD |
| Page: 1 2 3 4 5 6 |
Top |
Related drugs of malignant transformation related genes |
| Identification of chemicals and drugs interact with genes involved in malignant transfromation |
| (DGIdb 4.0) |
| Entrez ID | Symbol | Category | Interaction Types | Drug Claim Name | Drug Name | PMIDs |
| Page: 1 |

Copyright 2023-Present -The University of Texas Health Science Center at Houston |