
|
|||||
|
 | |
| |
| |
| |
| |
| |
|
Gene: PHF20 |
Gene summary for PHF20 |
| Gene information | Species | Human | Gene symbol | PHF20 | Gene ID | 51230 |
| Gene name | PHD finger protein 20 | |
| Gene Alias | C20orf104 | |
| Cytomap | 20q11.22-q11.23 | |
| Gene Type | protein-coding | GO ID | GO:0006139 | UniProtAcc | Q9BVI0 |
Top |
Malignant transformation analysis |
| Identification of the aberrant gene expression in precancerous and cancerous lesions by comparing the gene expression of stem-like cells in diseased tissues with normal stem cells |
| Entrez ID | Symbol | Replicates | Species | Organ | Tissue | Adj P-value | Log2FC | Malignancy |
| 51230 | PHF20 | AEH-subject2 | Human | Endometrium | AEH | 3.91e-05 | 3.04e-03 | -0.2525 |
| 51230 | PHF20 | EEC-subject1 | Human | Endometrium | EEC | 6.03e-04 | 1.04e-01 | -0.2682 |
| 51230 | PHF20 | EEC-subject3 | Human | Endometrium | EEC | 5.94e-08 | 2.21e-02 | -0.2525 |
| 51230 | PHF20 | GSM6177620_NYU_UCEC1_lib1_lib1 | Human | Endometrium | EEC | 3.37e-15 | -8.38e-02 | -0.1869 |
| 51230 | PHF20 | GSM6177620_NYU_UCEC1_lib2_lib2 | Human | Endometrium | EEC | 2.34e-17 | -1.71e-01 | -0.1875 |
| 51230 | PHF20 | GSM6177620_NYU_UCEC1_lib3_lib3 | Human | Endometrium | EEC | 1.83e-18 | -1.37e-01 | -0.1883 |
| 51230 | PHF20 | GSM6177621_NYU_UCEC2_lib1_lib1 | Human | Endometrium | EEC | 1.03e-14 | -1.01e-01 | -0.1934 |
| 51230 | PHF20 | GSM6177622_NYU_UCEC3_lib1_lib1 | Human | Endometrium | EEC | 9.25e-24 | -8.07e-02 | -0.1917 |
| 51230 | PHF20 | GSM6177622_NYU_UCEC3_lib2_lib2 | Human | Endometrium | EEC | 2.09e-21 | -1.40e-01 | -0.1916 |
| 51230 | PHF20 | GSM6177623_NYU_UCEC3_Vis | Human | Endometrium | EEC | 4.76e-04 | -1.04e-01 | -0.1269 |
| 51230 | PHF20 | LZE2T | Human | Esophagus | ESCC | 4.64e-02 | 1.70e-01 | 0.082 |
| 51230 | PHF20 | LZE4T | Human | Esophagus | ESCC | 1.19e-26 | 5.85e-01 | 0.0811 |
| 51230 | PHF20 | LZE5T | Human | Esophagus | ESCC | 1.67e-02 | 5.99e-01 | 0.0514 |
| 51230 | PHF20 | LZE7T | Human | Esophagus | ESCC | 6.81e-14 | 6.96e-01 | 0.0667 |
| 51230 | PHF20 | LZE8T | Human | Esophagus | ESCC | 7.21e-08 | 2.09e-01 | 0.067 |
| 51230 | PHF20 | LZE20T | Human | Esophagus | ESCC | 1.16e-10 | 2.71e-01 | 0.0662 |
| 51230 | PHF20 | LZE22D1 | Human | Esophagus | HGIN | 6.53e-03 | 1.54e-01 | 0.0595 |
| 51230 | PHF20 | LZE22T | Human | Esophagus | ESCC | 4.25e-11 | 4.70e-01 | 0.068 |
| 51230 | PHF20 | LZE24T | Human | Esophagus | ESCC | 3.02e-26 | 8.74e-01 | 0.0596 |
| 51230 | PHF20 | LZE21T | Human | Esophagus | ESCC | 1.09e-05 | 1.16e-01 | 0.0655 |
| Page: 1 2 3 4 5 6 7 8 |
| Tissue | Expression Dynamics | Abbreviation |
| Endometrium | 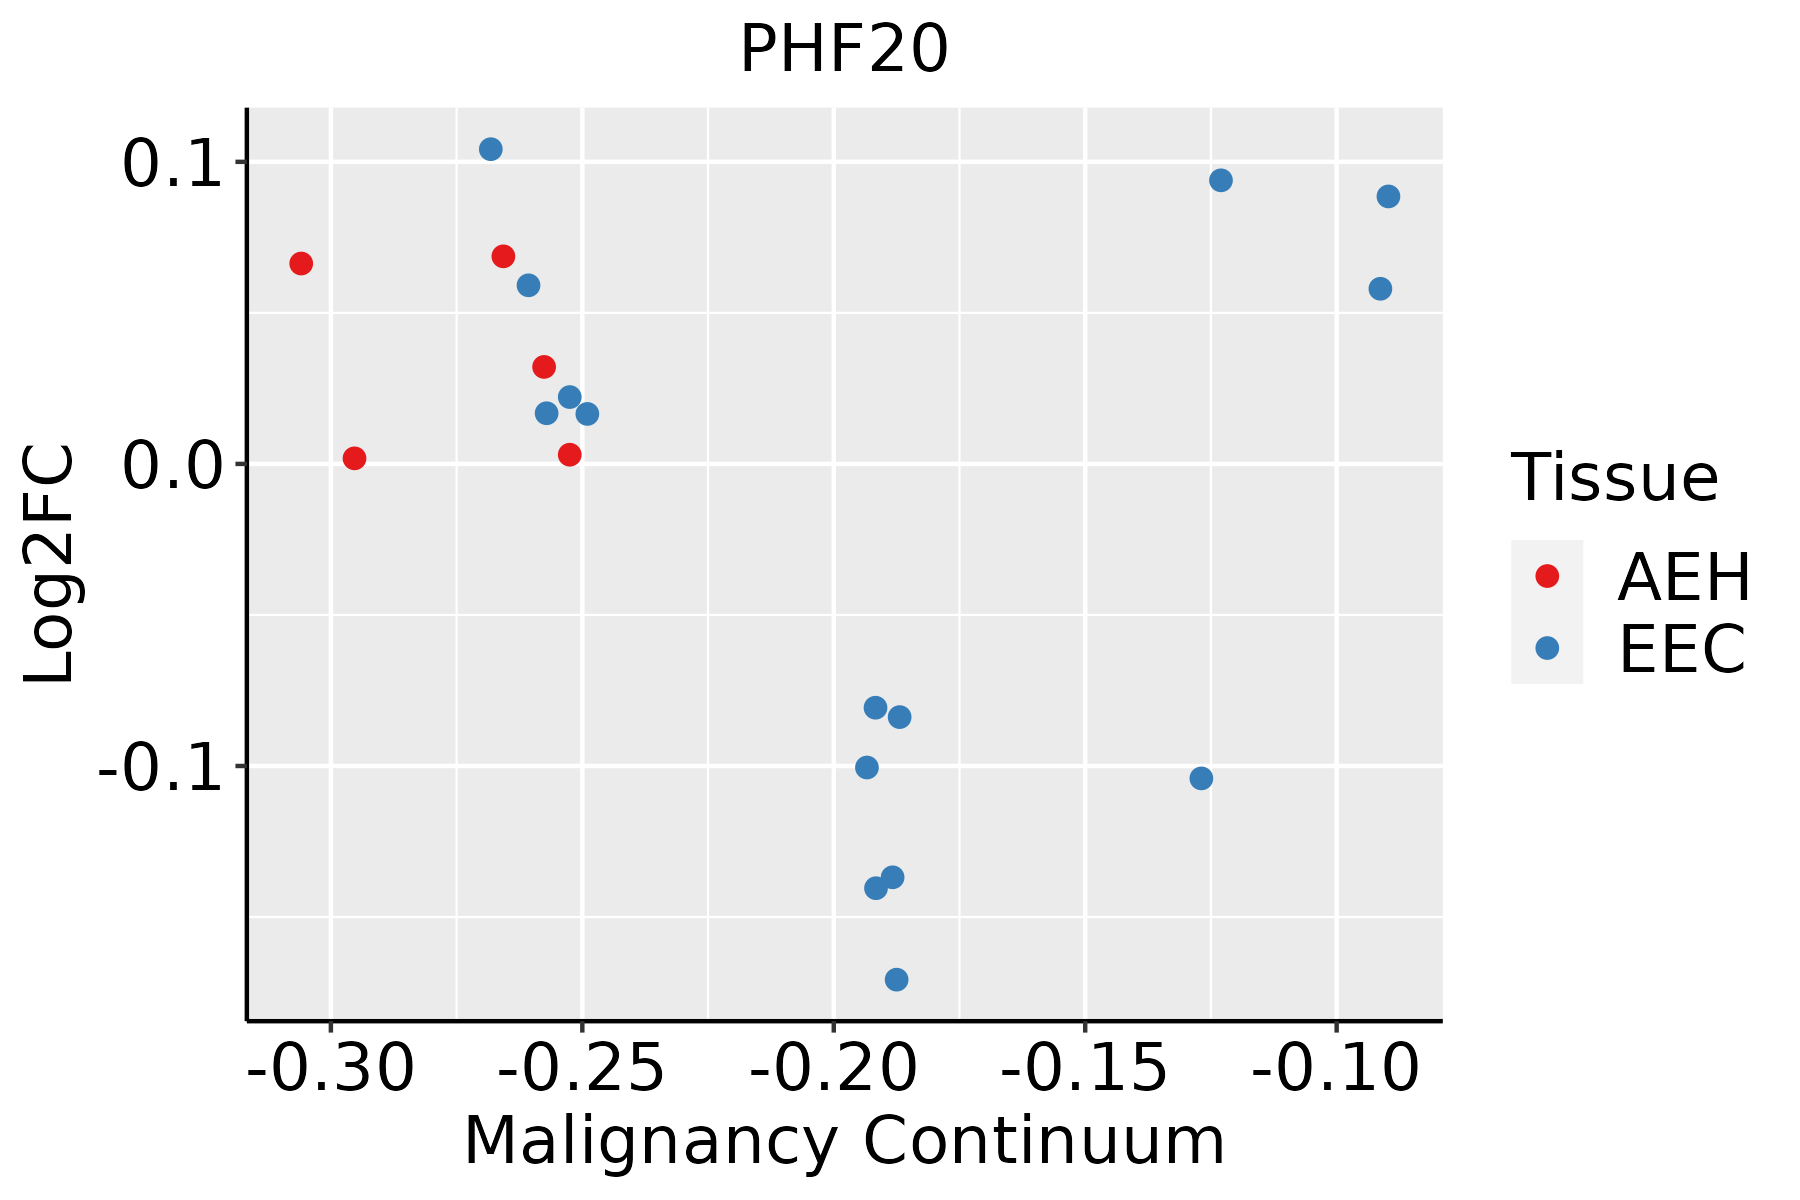 | AEH: Atypical endometrial hyperplasia |
| EEC: Endometrioid Cancer | ||
| Esophagus | 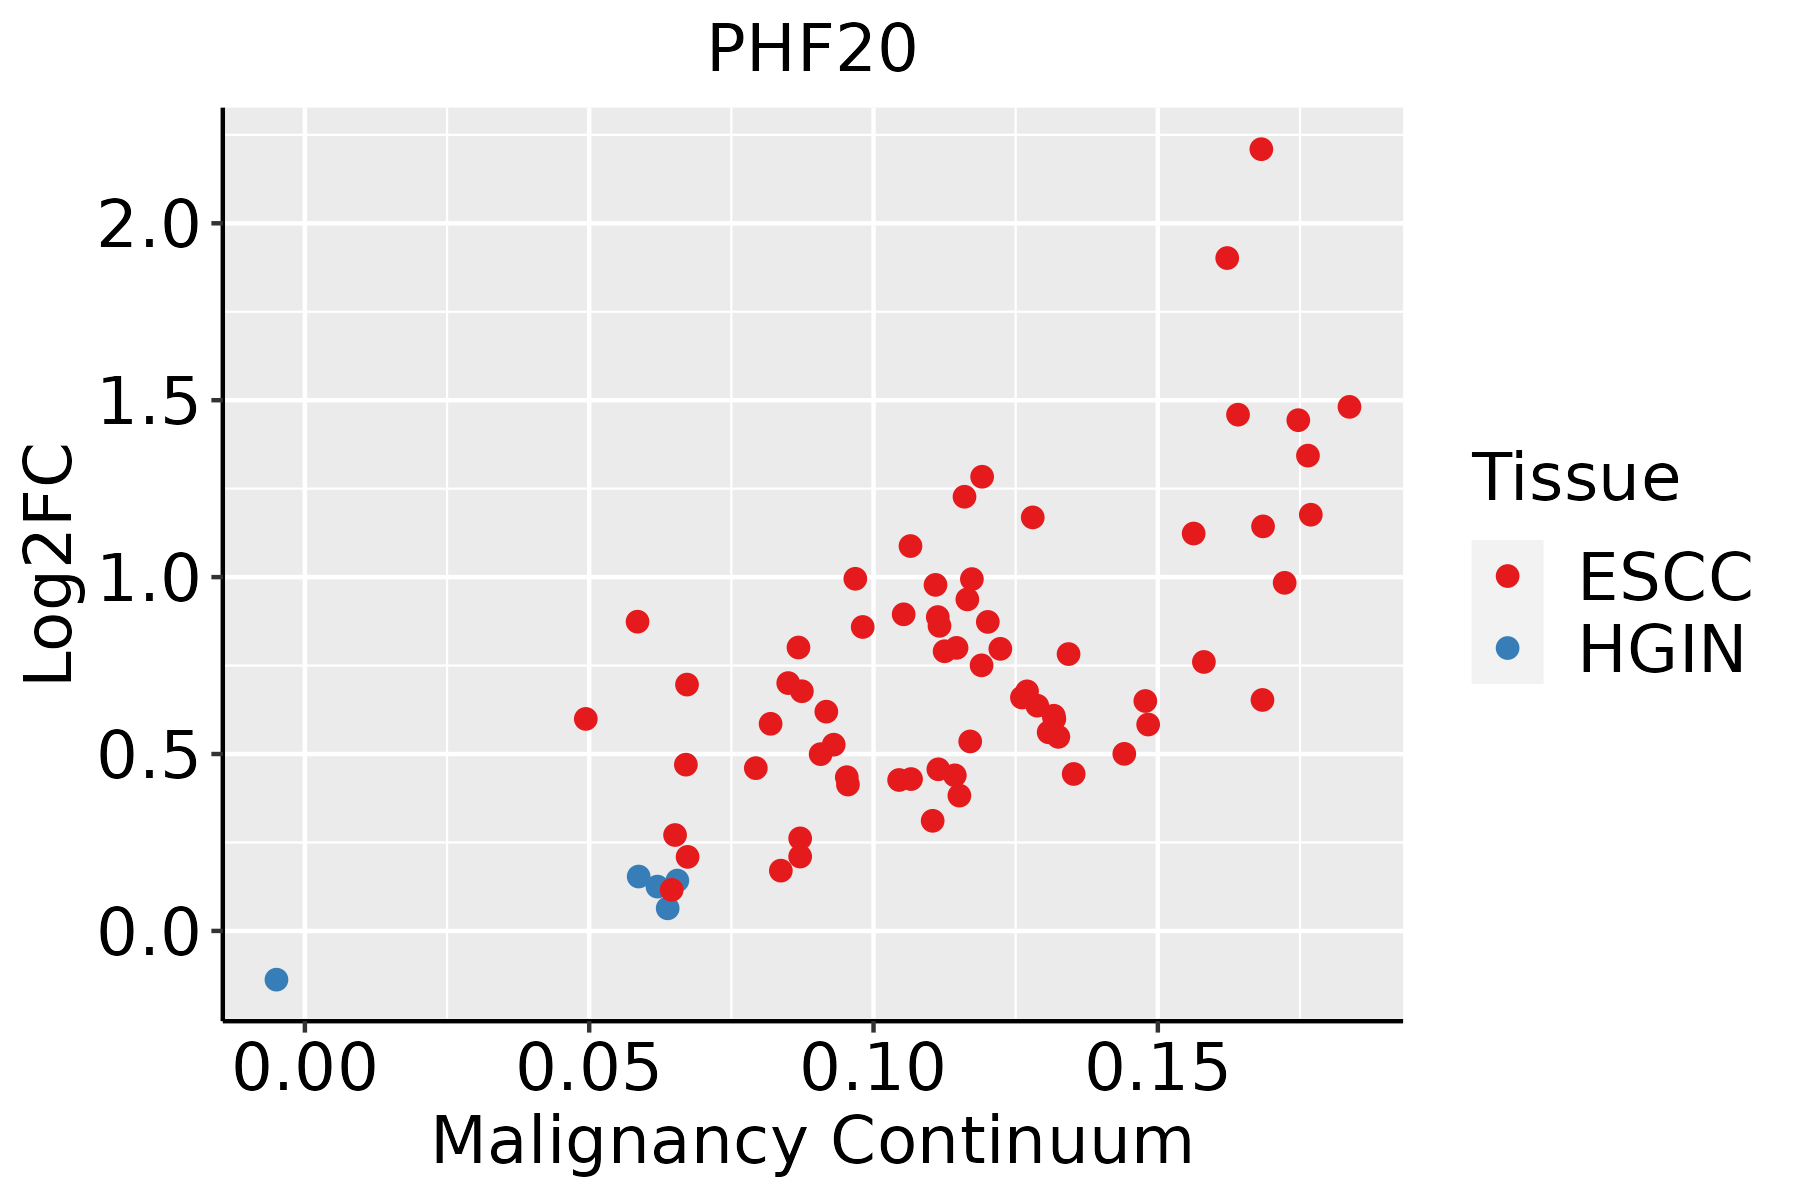 | ESCC: Esophageal squamous cell carcinoma |
| HGIN: High-grade intraepithelial neoplasias | ||
| LGIN: Low-grade intraepithelial neoplasias | ||
| Liver |  | HCC: Hepatocellular carcinoma |
| NAFLD: Non-alcoholic fatty liver disease | ||
| Lung | 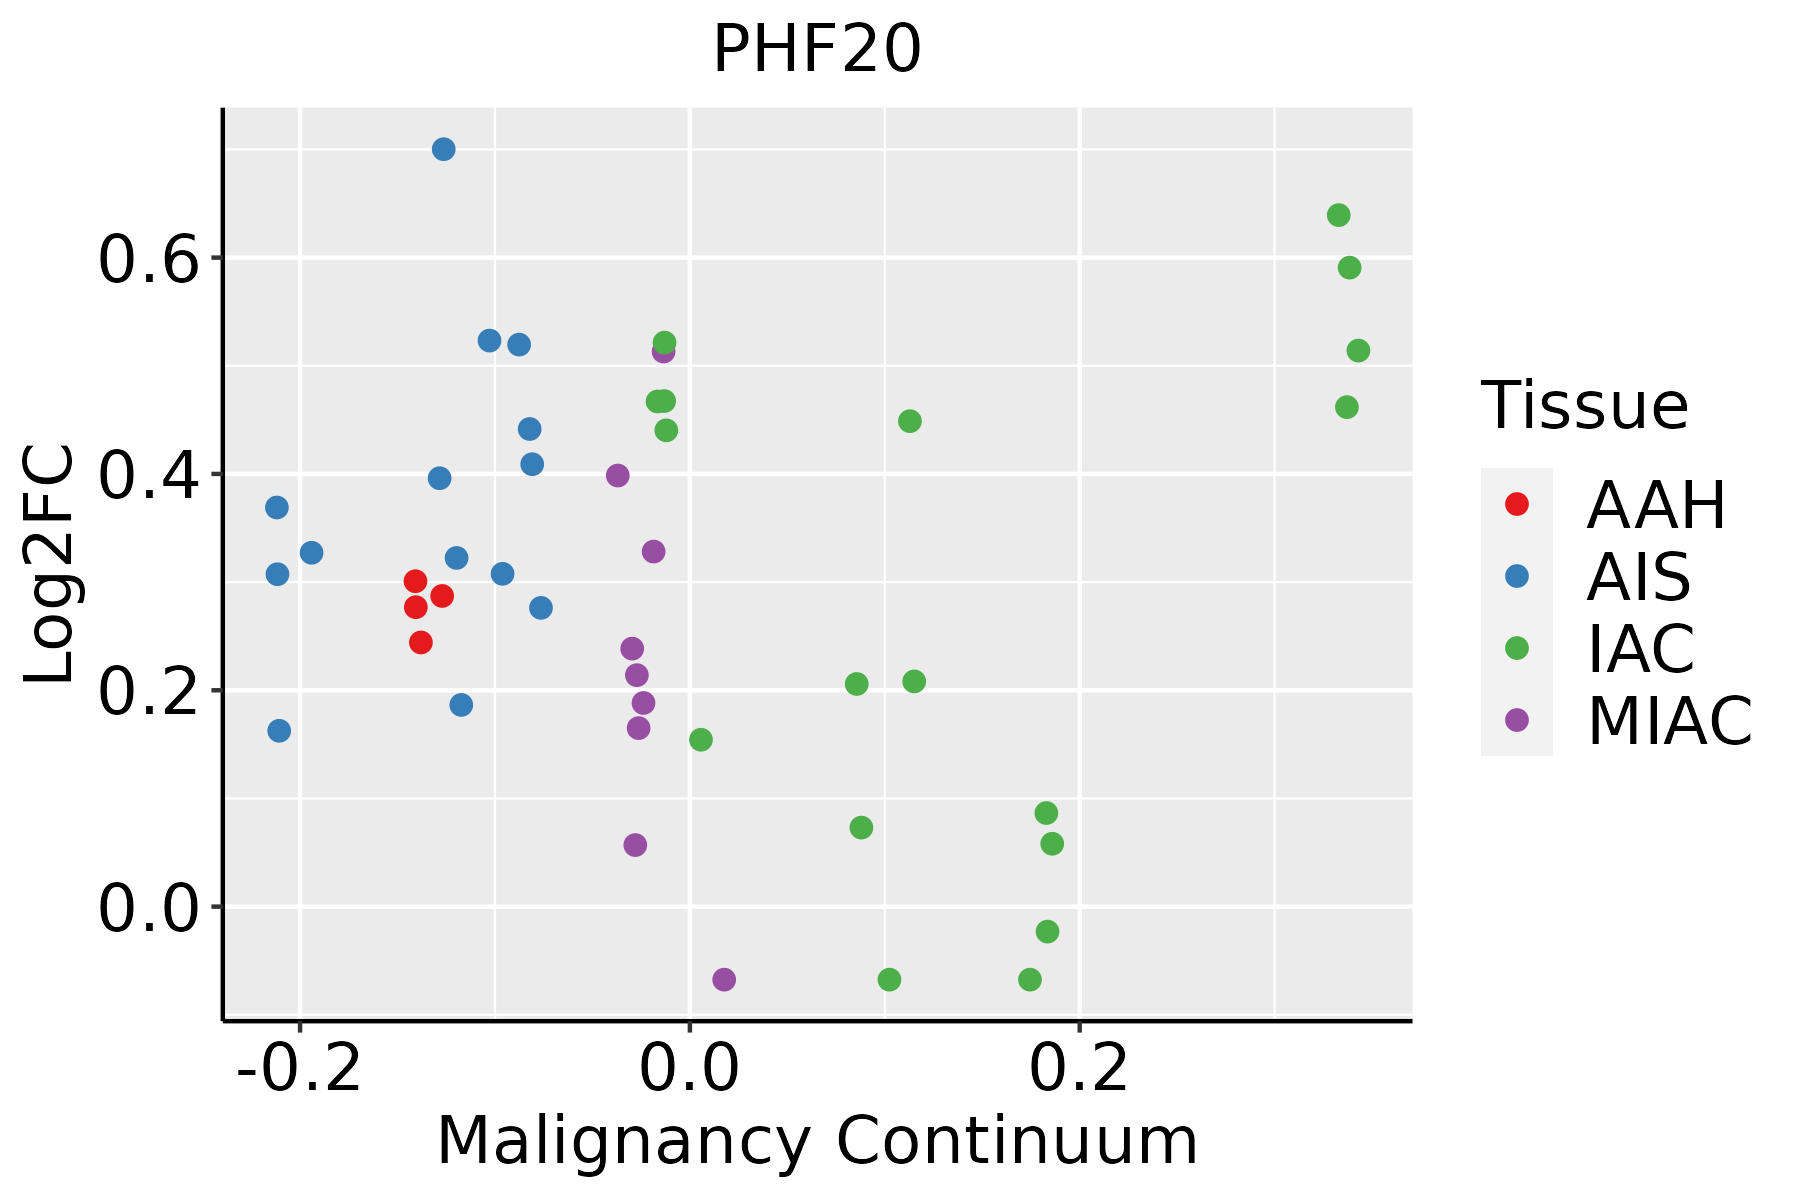 | AAH: Atypical adenomatous hyperplasia |
| AIS: Adenocarcinoma in situ | ||
| IAC: Invasive lung adenocarcinoma | ||
| MIA: Minimally invasive adenocarcinoma | ||
| Oral Cavity |  | EOLP: Erosive Oral lichen planus |
| LP: leukoplakia | ||
| NEOLP: Non-erosive oral lichen planus | ||
| OSCC: Oral squamous cell carcinoma | ||
| Prostate |  | BPH: Benign Prostatic Hyperplasia |
| Thyroid | 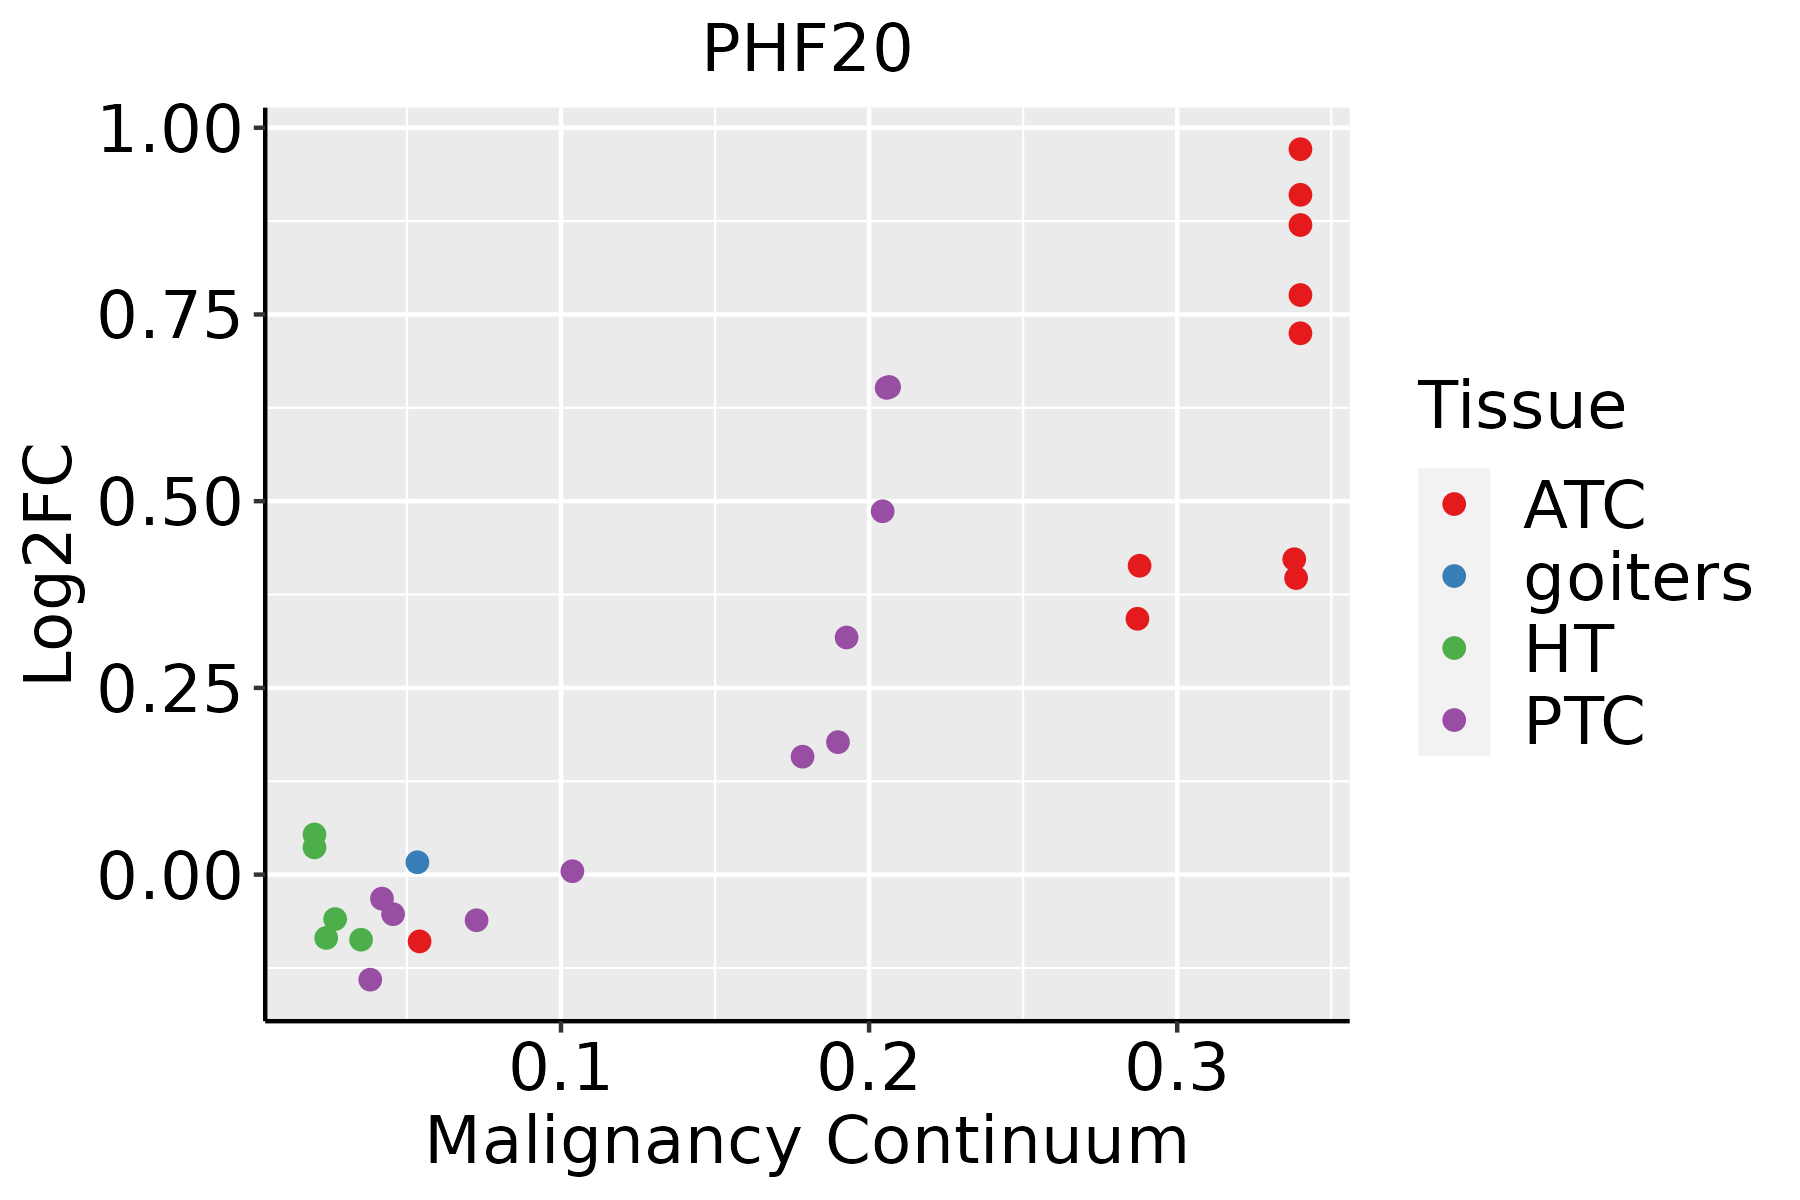 | ATC: Anaplastic thyroid cancer |
| HT: Hashimoto's thyroiditis | ||
| PTC: Papillary thyroid cancer |
| ∗log2FC in expression of this searched gene in stem-like cells from each diseased tissue sample relative to stem-like cells in normal samples in each tissue plotted against the malignancy continuum. Samples are colored based on if they are from different disease stage. |
Top |
Malignant transformation related pathway analysis |
| Find out the enriched GO biological processes and KEGG pathways involved in transition from healthy to precancer to cancer |
| Tissue | Disease Stage | Enriched GO biological Processes |
| Colorectum | AD |  |
| Colorectum | SER |  |
| Colorectum | MSS |  |
| Colorectum | MSI-H |  |
| Colorectum | FAP |  |
| ∗Top 15 enriched GO BP terms are showed in the bar plot of each disease state in each tissue. Each row represents a significant GO biological process which is colored according to the -log10(p.adjust). |
| Page: 1 2 3 4 5 6 7 8 9 |
| GO ID | Tissue | Disease Stage | Description | Gene Ratio | Bg Ratio | pvalue | p.adjust | Count |
| GO:0043967 | Liver | Cirrhotic | histone H4 acetylation | 31/4634 | 67/18723 | 1.03e-04 | 1.06e-03 | 31 |
| GO:001657021 | Liver | HCC | histone modification | 283/7958 | 463/18723 | 2.68e-16 | 2.33e-14 | 283 |
| GO:00182052 | Liver | HCC | peptidyl-lysine modification | 230/7958 | 376/18723 | 1.51e-13 | 8.32e-12 | 230 |
| GO:00064732 | Liver | HCC | protein acetylation | 135/7958 | 201/18723 | 1.20e-12 | 5.92e-11 | 135 |
| GO:00435432 | Liver | HCC | protein acylation | 157/7958 | 243/18723 | 2.40e-12 | 1.12e-10 | 157 |
| GO:00183942 | Liver | HCC | peptidyl-lysine acetylation | 116/7958 | 169/18723 | 5.11e-12 | 2.23e-10 | 116 |
| GO:00064752 | Liver | HCC | internal protein amino acid acetylation | 107/7958 | 160/18723 | 3.77e-10 | 1.23e-08 | 107 |
| GO:00183932 | Liver | HCC | internal peptidyl-lysine acetylation | 105/7958 | 158/18723 | 9.48e-10 | 2.90e-08 | 105 |
| GO:00165732 | Liver | HCC | histone acetylation | 101/7958 | 152/18723 | 1.99e-09 | 5.63e-08 | 101 |
| GO:00439671 | Liver | HCC | histone H4 acetylation | 50/7958 | 67/18723 | 9.14e-08 | 1.82e-06 | 50 |
| GO:0043984 | Liver | HCC | histone H4-K16 acetylation | 16/7958 | 20/18723 | 7.15e-04 | 4.37e-03 | 16 |
| GO:00165704 | Lung | IAC | histone modification | 93/2061 | 463/18723 | 5.41e-09 | 8.03e-07 | 93 |
| GO:00182053 | Lung | IAC | peptidyl-lysine modification | 62/2061 | 376/18723 | 7.55e-04 | 9.82e-03 | 62 |
| GO:001657012 | Lung | AIS | histone modification | 81/1849 | 463/18723 | 2.30e-07 | 2.16e-05 | 81 |
| GO:00165707 | Oral cavity | OSCC | histone modification | 270/7305 | 463/18723 | 1.59e-17 | 1.50e-15 | 270 |
| GO:00182056 | Oral cavity | OSCC | peptidyl-lysine modification | 216/7305 | 376/18723 | 2.32e-13 | 1.16e-11 | 216 |
| GO:00435434 | Oral cavity | OSCC | protein acylation | 149/7305 | 243/18723 | 1.33e-12 | 5.80e-11 | 149 |
| GO:00183944 | Oral cavity | OSCC | peptidyl-lysine acetylation | 108/7305 | 169/18723 | 4.55e-11 | 1.45e-09 | 108 |
| GO:00064734 | Oral cavity | OSCC | protein acetylation | 124/7305 | 201/18723 | 5.59e-11 | 1.74e-09 | 124 |
| GO:00165734 | Oral cavity | OSCC | histone acetylation | 96/7305 | 152/18723 | 1.35e-09 | 3.29e-08 | 96 |
| Page: 1 2 3 4 5 6 7 8 |
| Pathway ID | Tissue | Disease Stage | Description | Gene Ratio | Bg Ratio | pvalue | p.adjust | qvalue | Count |
| Page: 1 |
Top |
Cell-cell communication analysis |
| Identification of potential cell-cell interactions between two cell types and their ligand-receptor pairs for different disease states |
| Ligand | Receptor | LRpair | Pathway | Tissue | Disease Stage |
| Page: 1 |
Top |
Single-cell gene regulatory network inference analysis |
| Find out the significant the regulons (TFs) and the target genes of each regulon across cell types for different disease states |
| TF | Cell Type | Tissue | Disease Stage | Target Gene | RSS | Regulon Activity |
| ∗The dot plots of a searched regulon are shown for all cell subpopulations in each disease state of each tissue based on the regulon specific score inferred using pySCENIC and by calculating the average expression. |
| Page: 1 |
Top |
Somatic mutation of malignant transformation related genes |
| Annotation of somatic variants for genes involved in malignant transformation |
| Hugo Symbol | Variant Class | Variant Classification | dbSNP RS | HGVSc | HGVSp | HGVSp Short | SWISSPROT | BIOTYPE | SIFT | PolyPhen | Tumor Sample Barcode | Tissue | Histology | Sex | Age | Stage | Therapy Types | Drugs | Outcome |
| PHF20 | SNV | Missense_Mutation | rs780164709 | c.1271C>T | p.Ser424Leu | p.S424L | Q9BVI0 | protein_coding | deleterious(0.01) | benign(0.122) | TCGA-AC-A23H-01 | Breast | breast invasive carcinoma | Female | >=65 | I/II | Unknown | Unknown | PD |
| PHF20 | SNV | Missense_Mutation | c.2249A>T | p.Gln750Leu | p.Q750L | Q9BVI0 | protein_coding | tolerated(0.1) | possibly_damaging(0.728) | TCGA-B6-A0X0-01 | Breast | breast invasive carcinoma | Female | <65 | I/II | Unknown | Unknown | SD | |
| PHF20 | SNV | Missense_Mutation | c.1998G>T | p.Met666Ile | p.M666I | Q9BVI0 | protein_coding | deleterious(0) | probably_damaging(0.977) | TCGA-D8-A1XZ-01 | Breast | breast invasive carcinoma | Female | >=65 | III/IV | Hormone Therapy | tamoxiphen+anastrozolum | SD | |
| PHF20 | SNV | Missense_Mutation | c.368N>C | p.Gly123Ala | p.G123A | Q9BVI0 | protein_coding | deleterious(0) | probably_damaging(0.997) | TCGA-D8-A27G-01 | Breast | breast invasive carcinoma | Female | >=65 | I/II | Unknown | Unknown | SD | |
| PHF20 | SNV | Missense_Mutation | novel | c.2945N>T | p.Pro982Leu | p.P982L | Q9BVI0 | protein_coding | deleterious(0) | probably_damaging(0.998) | TCGA-S3-AA17-01 | Breast | breast invasive carcinoma | Female | <65 | I/II | Hormone Therapy | anastrozole | SD |
| PHF20 | insertion | Frame_Shift_Ins | novel | c.319_320insTATCTATAATGGTCCTGCTGCTTTTGGATCTGAC | p.Thr108SerfsTer15 | p.T108Sfs*15 | Q9BVI0 | protein_coding | TCGA-A8-A095-01 | Breast | breast invasive carcinoma | Female | <65 | I/II | Chemotherapy | 5-fluorouracil | CR | ||
| PHF20 | insertion | In_Frame_Ins | novel | c.189_190insACTGGCCGGGCACAGTGGTTCACCCTTGTAATC | p.Pro63_Tyr64insThrGlyArgAlaGlnTrpPheThrLeuValIle | p.P63_Y64insTGRAQWFTLVI | Q9BVI0 | protein_coding | TCGA-AO-A03R-01 | Breast | breast invasive carcinoma | Female | <65 | I/II | Chemotherapy | doxorubicin | SD | ||
| PHF20 | insertion | Frame_Shift_Ins | novel | c.2379_2380insGTGGTCTCCT | p.Asn794ValfsTer4 | p.N794Vfs*4 | Q9BVI0 | protein_coding | TCGA-AO-A0J5-01 | Breast | breast invasive carcinoma | Female | <65 | III/IV | Other, specify in notesBisphosphonate | zoledronic | PD | ||
| PHF20 | SNV | Missense_Mutation | rs200315522 | c.2600N>T | p.Ala867Val | p.A867V | Q9BVI0 | protein_coding | deleterious(0.04) | benign(0.038) | TCGA-2W-A8YY-01 | Cervix | cervical & endocervical cancer | Female | <65 | I/II | Chemotherapy | cisplatin | CR |
| PHF20 | SNV | Missense_Mutation | novel | c.2845N>T | p.Leu949Phe | p.L949F | Q9BVI0 | protein_coding | deleterious(0.01) | probably_damaging(0.975) | TCGA-C5-A8XJ-01 | Cervix | cervical & endocervical cancer | Female | >=65 | I/II | Chemotherapy | cisplatin | SD |
| Page: 1 2 3 4 5 6 7 8 9 10 |
Top |
Related drugs of malignant transformation related genes |
| Identification of chemicals and drugs interact with genes involved in malignant transfromation |
| (DGIdb 4.0) |
| Entrez ID | Symbol | Category | Interaction Types | Drug Claim Name | Drug Name | PMIDs |
| Page: 1 |

Copyright 2023-Present -The University of Texas Health Science Center at Houston |