
|
|||||
|
 | |
| |
| |
| |
| |
| |
|
Gene: PHF14 |
Gene summary for PHF14 |
| Gene information | Species | Human | Gene symbol | PHF14 | Gene ID | 9678 |
| Gene name | PHD finger protein 14 | |
| Gene Alias | PHF14 | |
| Cytomap | 7p21.3 | |
| Gene Type | protein-coding | GO ID | GO:0006139 | UniProtAcc | B4DG57 |
Top |
Malignant transformation analysis |
| Identification of the aberrant gene expression in precancerous and cancerous lesions by comparing the gene expression of stem-like cells in diseased tissues with normal stem cells |
| Entrez ID | Symbol | Replicates | Species | Organ | Tissue | Adj P-value | Log2FC | Malignancy |
| 9678 | PHF14 | CA_HPV_1 | Human | Cervix | CC | 9.97e-04 | -1.68e-01 | 0.0264 |
| 9678 | PHF14 | CA_HPV_3 | Human | Cervix | CC | 1.34e-02 | 1.94e-01 | 0.0414 |
| 9678 | PHF14 | CCI_1 | Human | Cervix | CC | 1.77e-03 | 6.78e-01 | 0.528 |
| 9678 | PHF14 | CCI_3 | Human | Cervix | CC | 8.06e-03 | 5.61e-01 | 0.516 |
| 9678 | PHF14 | HTA11_3410_2000001011 | Human | Colorectum | AD | 3.08e-13 | -4.80e-01 | 0.0155 |
| 9678 | PHF14 | HTA11_3361_2000001011 | Human | Colorectum | AD | 1.96e-04 | -4.76e-01 | -0.1207 |
| 9678 | PHF14 | HTA11_696_2000001011 | Human | Colorectum | AD | 1.91e-06 | -2.88e-01 | -0.1464 |
| 9678 | PHF14 | HTA11_866_2000001011 | Human | Colorectum | AD | 1.23e-02 | -2.77e-01 | -0.1001 |
| 9678 | PHF14 | HTA11_5212_2000001011 | Human | Colorectum | AD | 6.97e-05 | -5.89e-01 | -0.2061 |
| 9678 | PHF14 | HTA11_99999965062_69753 | Human | Colorectum | MSI-H | 1.60e-06 | 9.75e-01 | 0.3487 |
| 9678 | PHF14 | HTA11_99999965104_69814 | Human | Colorectum | MSS | 6.94e-03 | 5.24e-01 | 0.281 |
| 9678 | PHF14 | A002-C-010 | Human | Colorectum | FAP | 1.94e-02 | 1.71e-01 | 0.242 |
| 9678 | PHF14 | A015-C-203 | Human | Colorectum | FAP | 1.61e-27 | -2.16e-01 | -0.1294 |
| 9678 | PHF14 | A015-C-204 | Human | Colorectum | FAP | 4.66e-04 | -9.87e-02 | -0.0228 |
| 9678 | PHF14 | A014-C-040 | Human | Colorectum | FAP | 9.56e-07 | -1.53e-01 | -0.1184 |
| 9678 | PHF14 | A002-C-201 | Human | Colorectum | FAP | 4.81e-12 | -1.59e-01 | 0.0324 |
| 9678 | PHF14 | A002-C-203 | Human | Colorectum | FAP | 1.65e-03 | 1.77e-01 | 0.2786 |
| 9678 | PHF14 | A001-C-119 | Human | Colorectum | FAP | 2.55e-04 | 2.11e-02 | -0.1557 |
| 9678 | PHF14 | A001-C-108 | Human | Colorectum | FAP | 6.85e-11 | -5.98e-02 | -0.0272 |
| 9678 | PHF14 | A002-C-205 | Human | Colorectum | FAP | 4.16e-27 | 1.44e-02 | -0.1236 |
| Page: 1 2 3 4 5 6 7 8 9 10 11 12 |
| Tissue | Expression Dynamics | Abbreviation |
| Cervix |  | CC: Cervix cancer |
| HSIL_HPV: HPV-infected high-grade squamous intraepithelial lesions | ||
| N_HPV: HPV-infected normal cervix | ||
| Colorectum (GSE201348) |  | FAP: Familial adenomatous polyposis |
| CRC: Colorectal cancer | ||
| Colorectum (HTA11) | 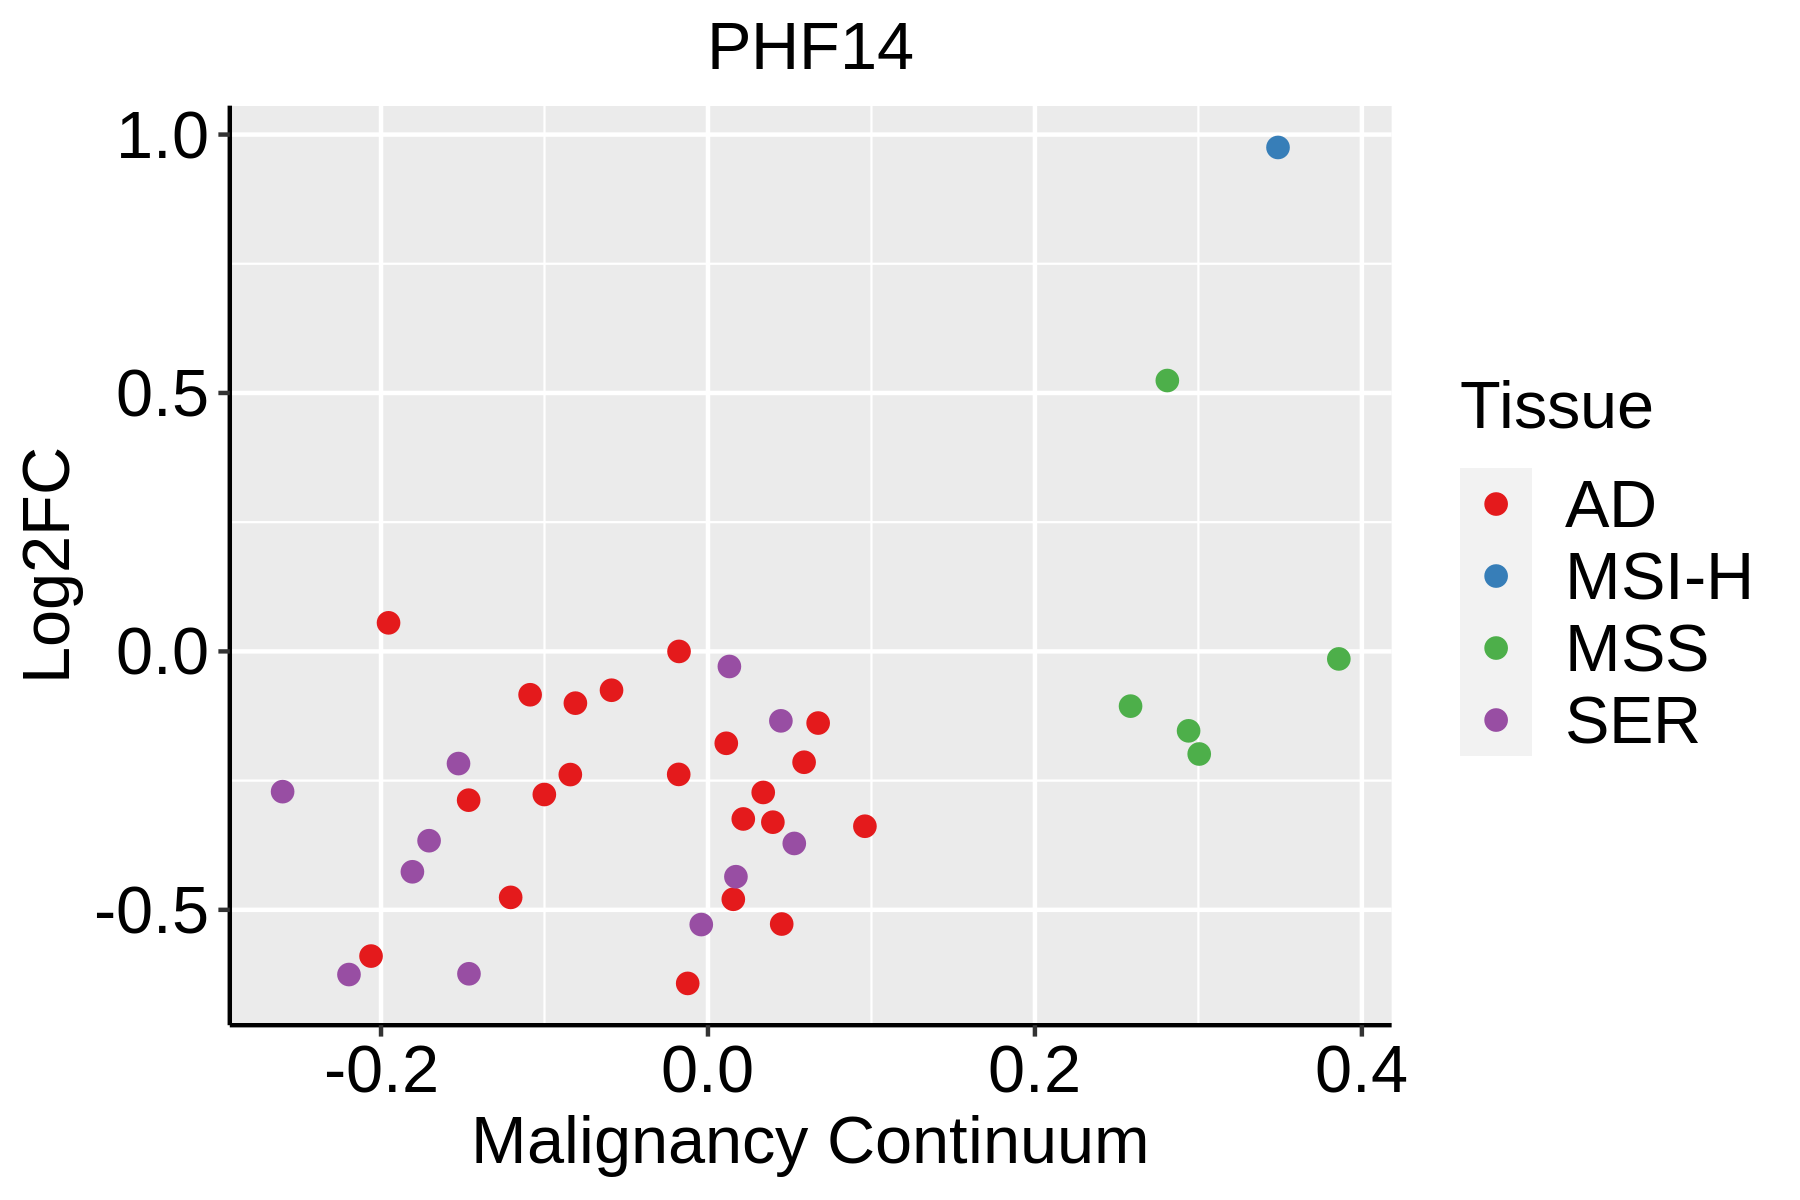 | AD: Adenomas |
| SER: Sessile serrated lesions | ||
| MSI-H: Microsatellite-high colorectal cancer | ||
| MSS: Microsatellite stable colorectal cancer | ||
| Esophagus | 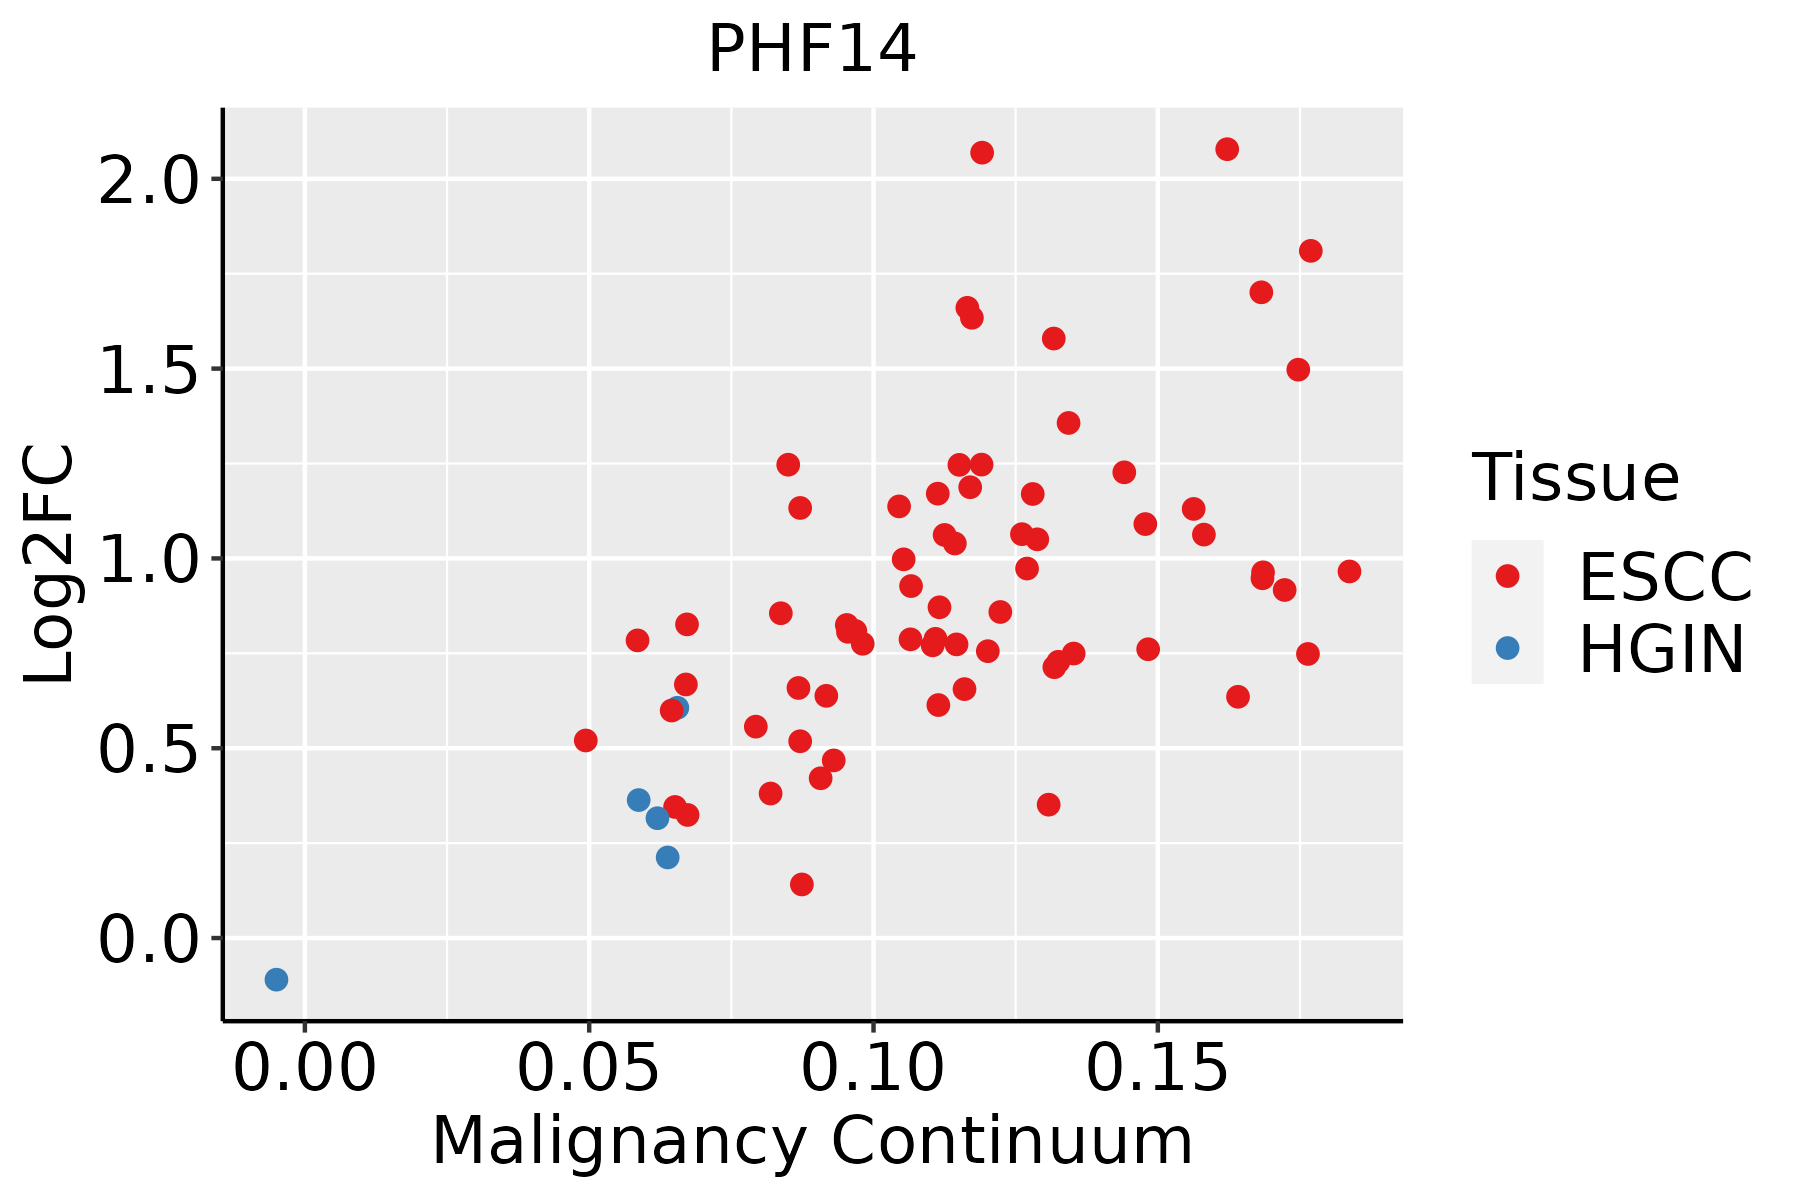 | ESCC: Esophageal squamous cell carcinoma |
| HGIN: High-grade intraepithelial neoplasias | ||
| LGIN: Low-grade intraepithelial neoplasias | ||
| GC |  | CAG: Chronic atrophic gastritis |
| CAG with IM: Chronic atrophic gastritis with intestinal metaplasia | ||
| CSG: Chronic superficial gastritis | ||
| GC: Gastric cancer | ||
| SIM: Severe intestinal metaplasia | ||
| WIM: Wild intestinal metaplasia | ||
| Liver |  | HCC: Hepatocellular carcinoma |
| NAFLD: Non-alcoholic fatty liver disease | ||
| Lung | 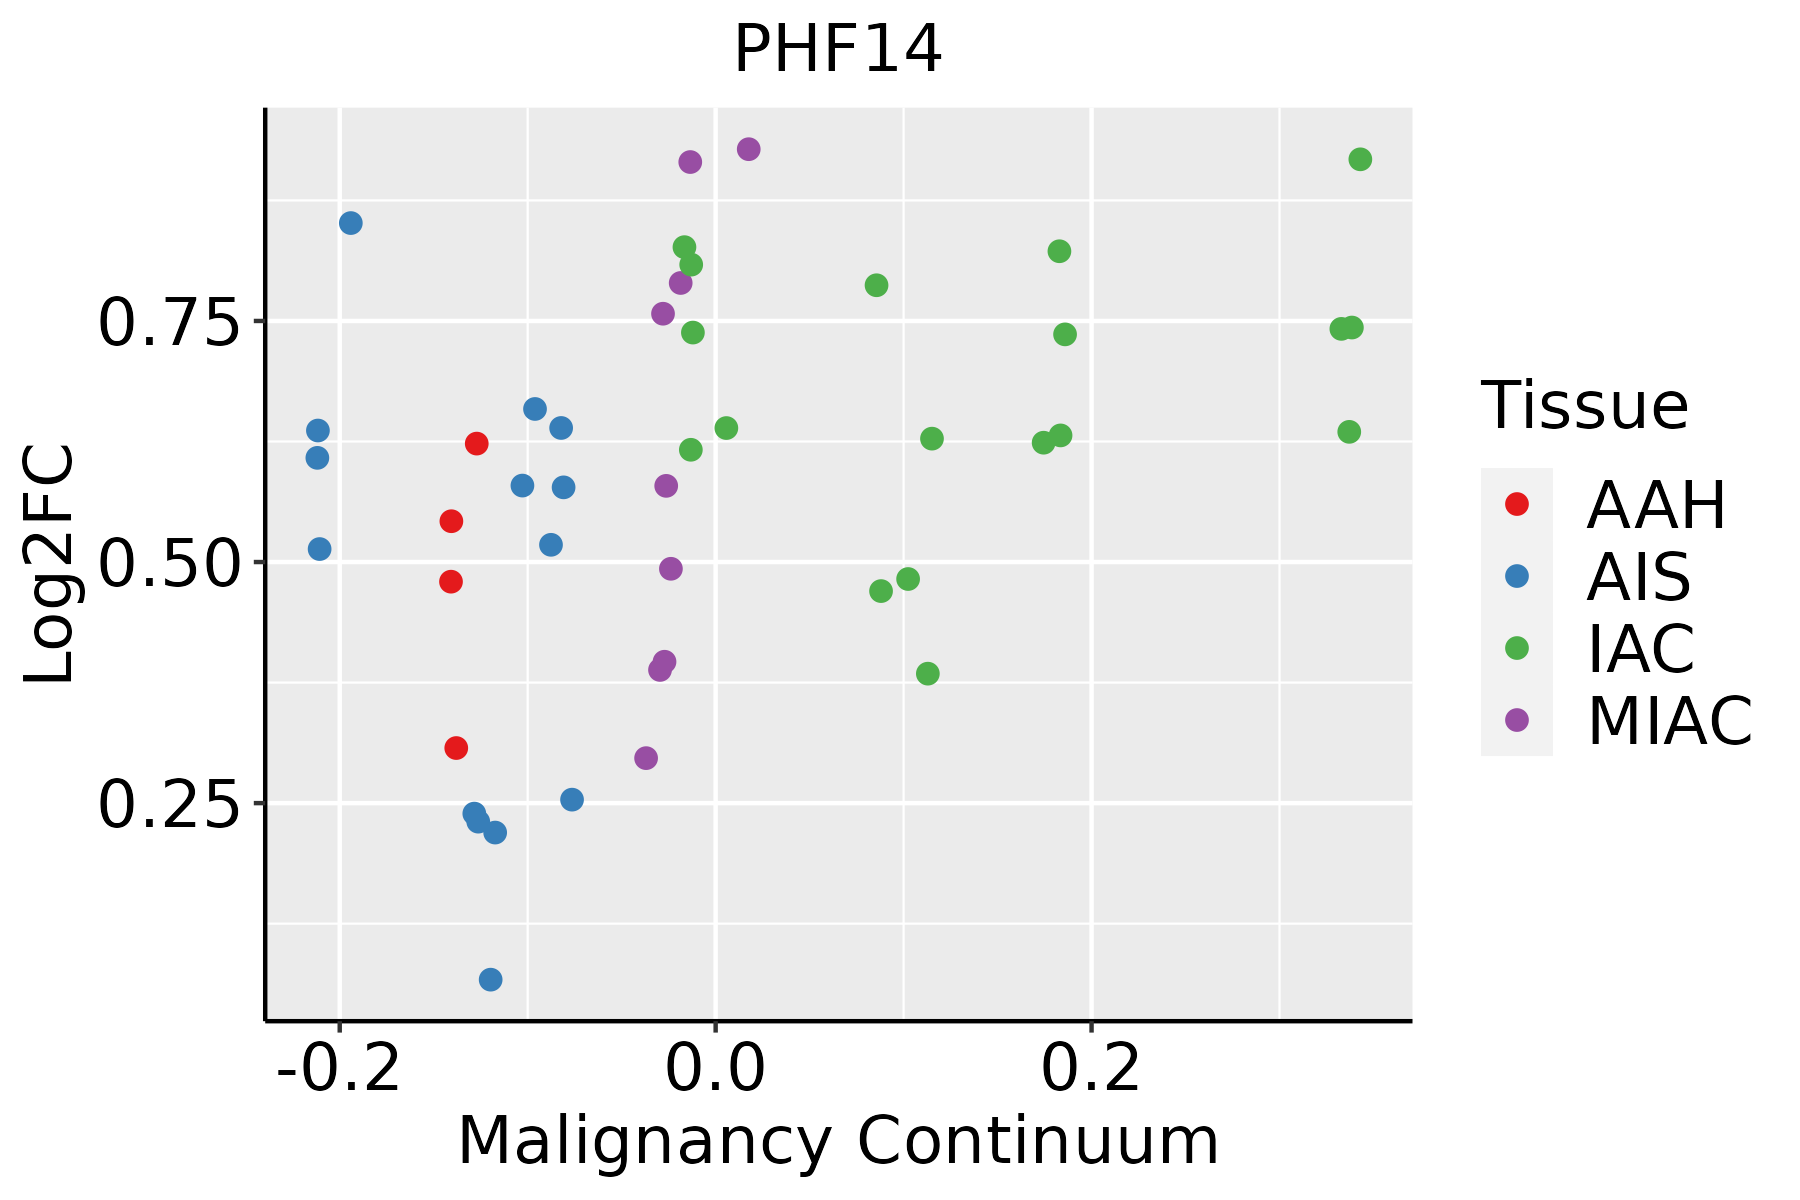 | AAH: Atypical adenomatous hyperplasia |
| AIS: Adenocarcinoma in situ | ||
| IAC: Invasive lung adenocarcinoma | ||
| MIA: Minimally invasive adenocarcinoma | ||
| Oral Cavity | 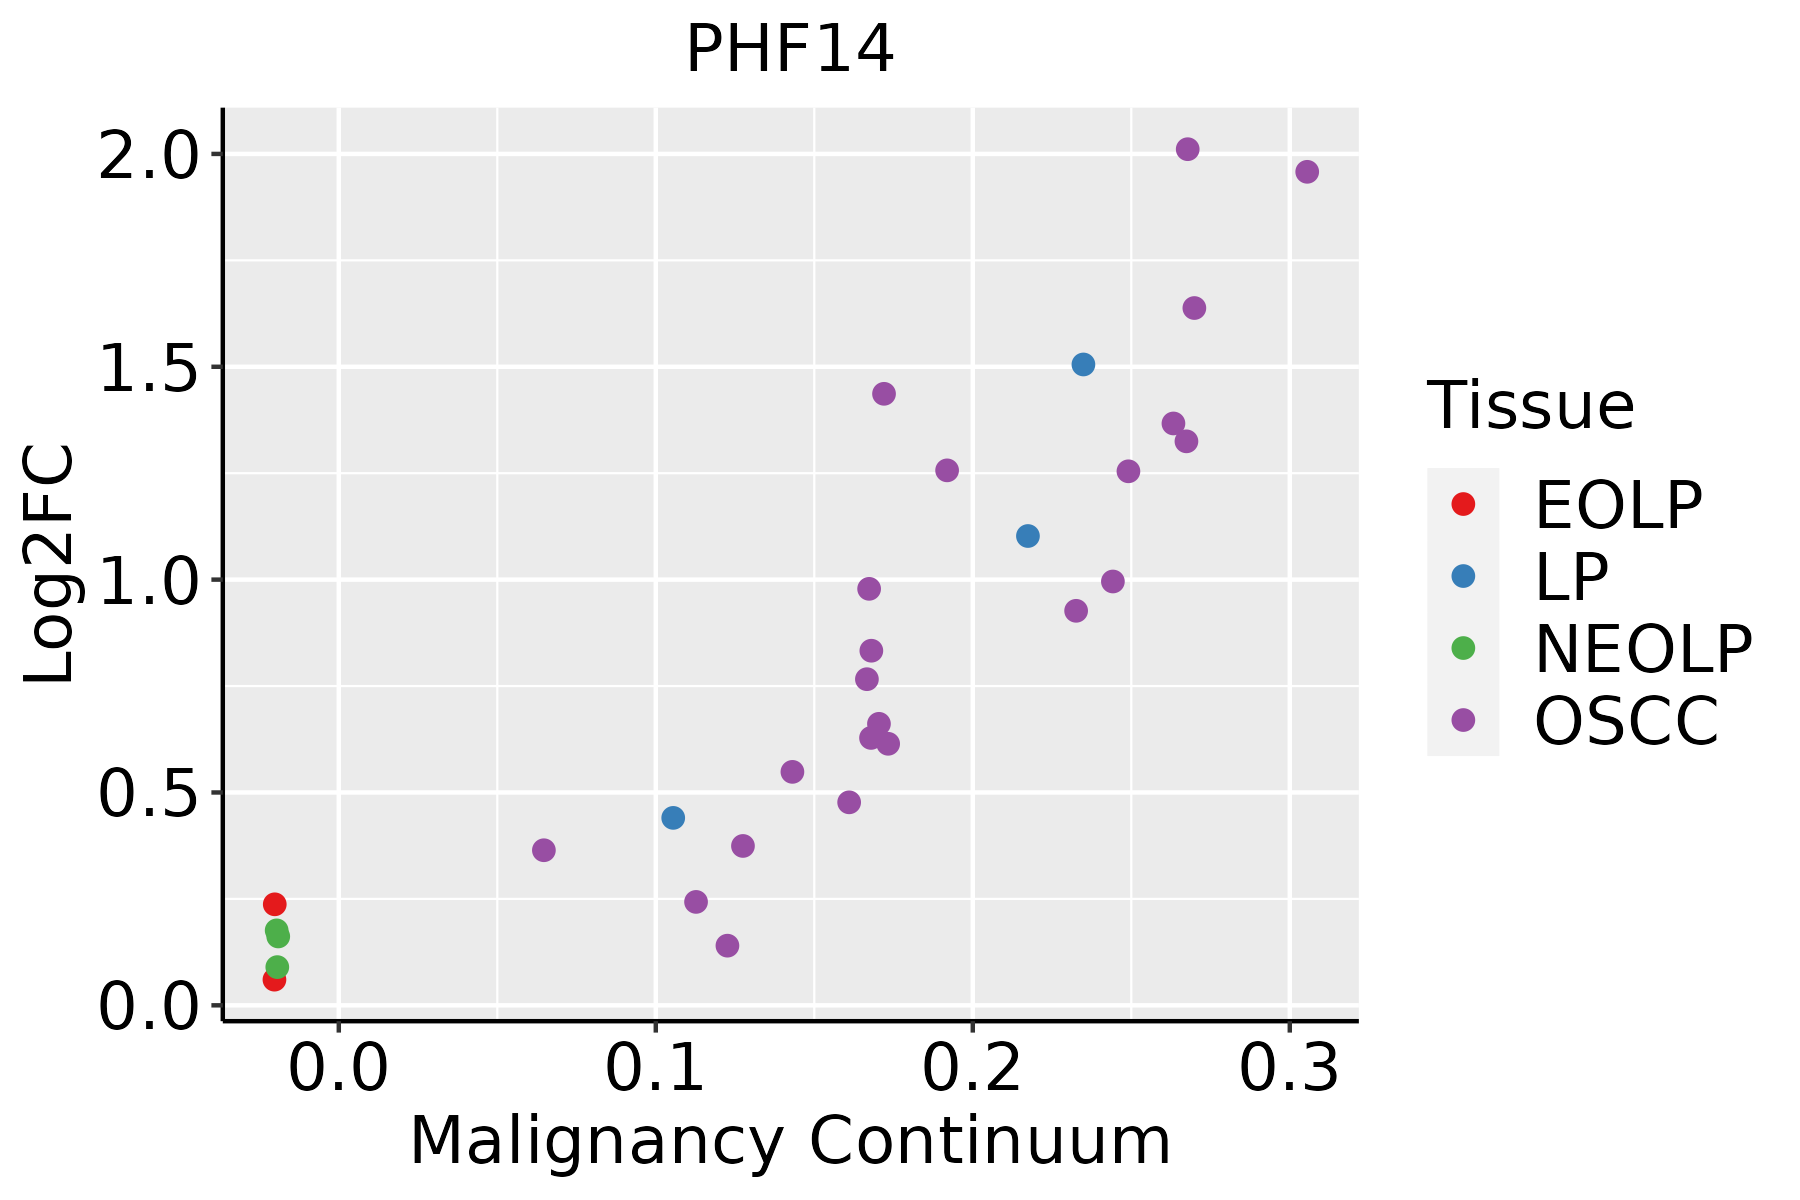 | EOLP: Erosive Oral lichen planus |
| LP: leukoplakia | ||
| NEOLP: Non-erosive oral lichen planus | ||
| OSCC: Oral squamous cell carcinoma | ||
| Prostate | 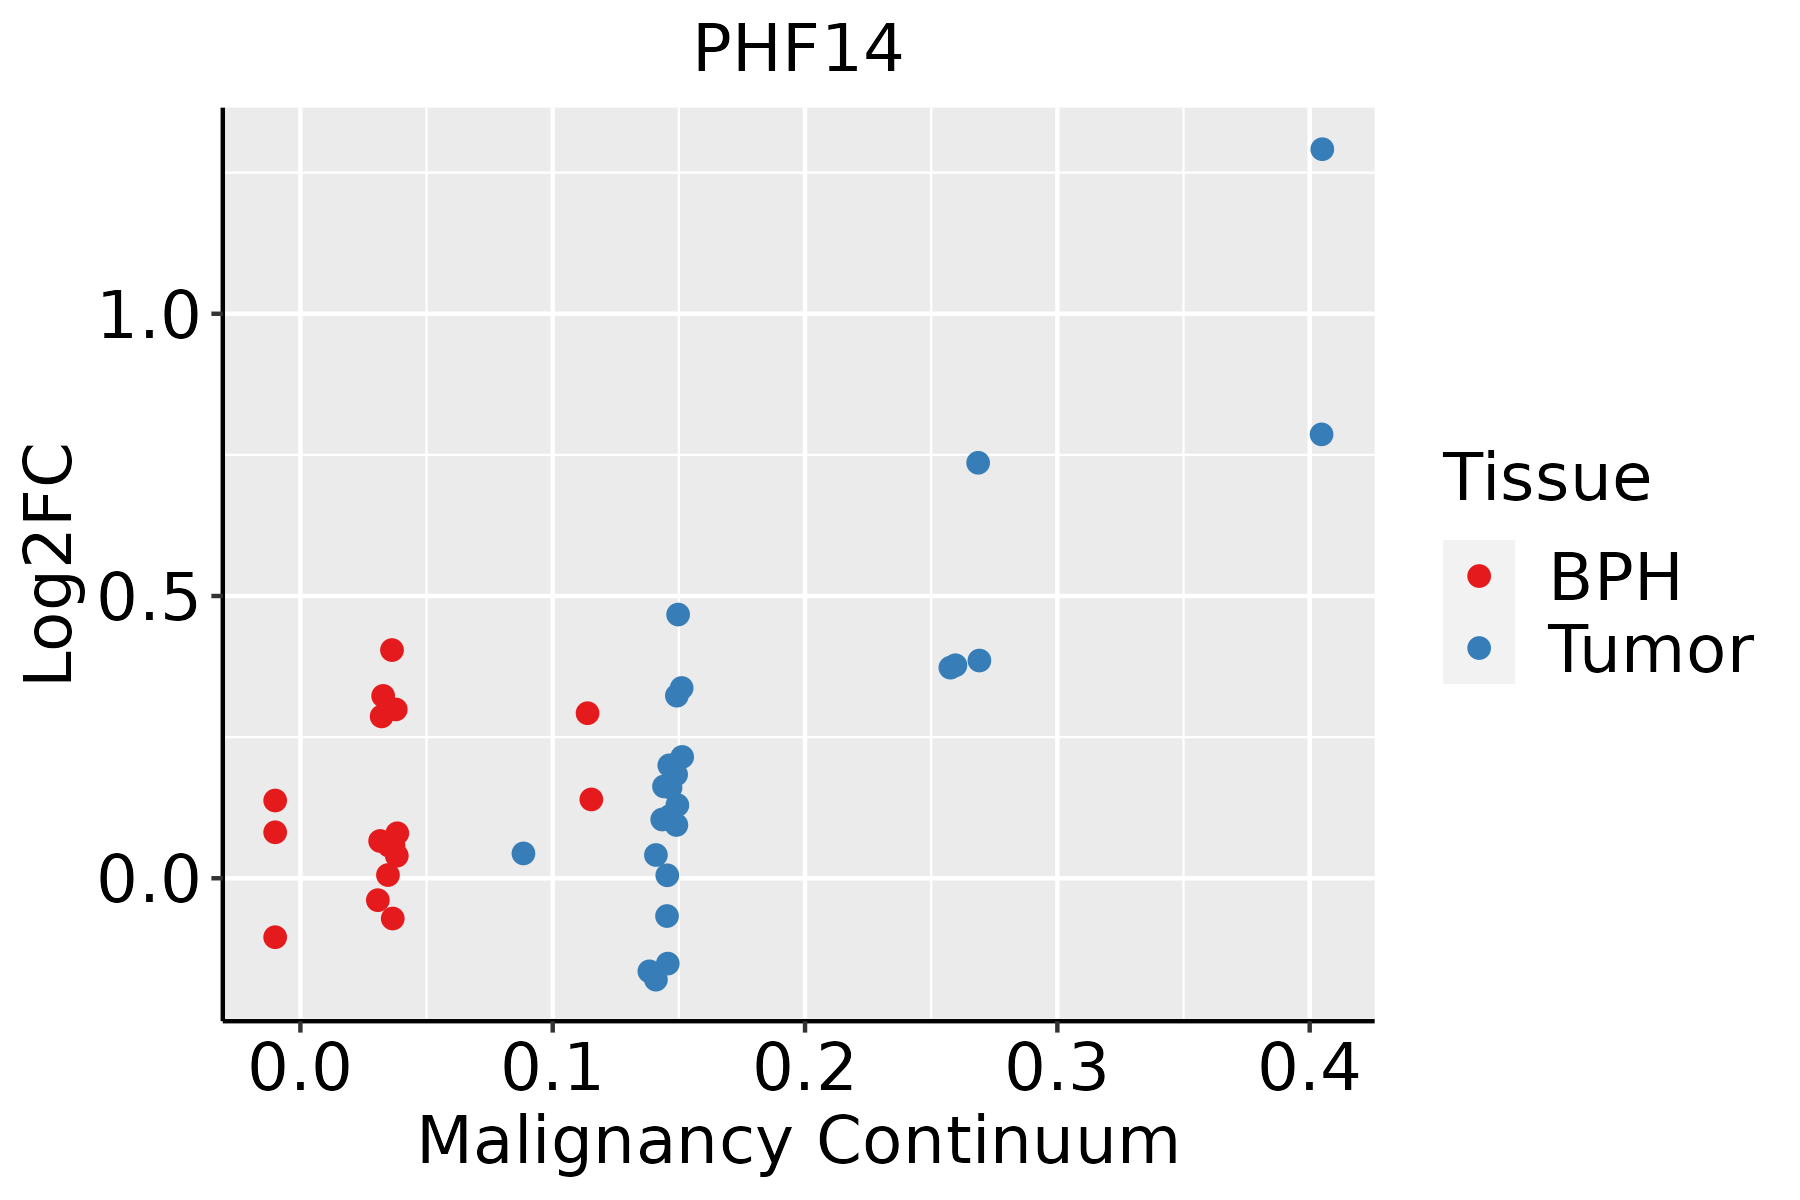 | BPH: Benign Prostatic Hyperplasia |
| Skin | 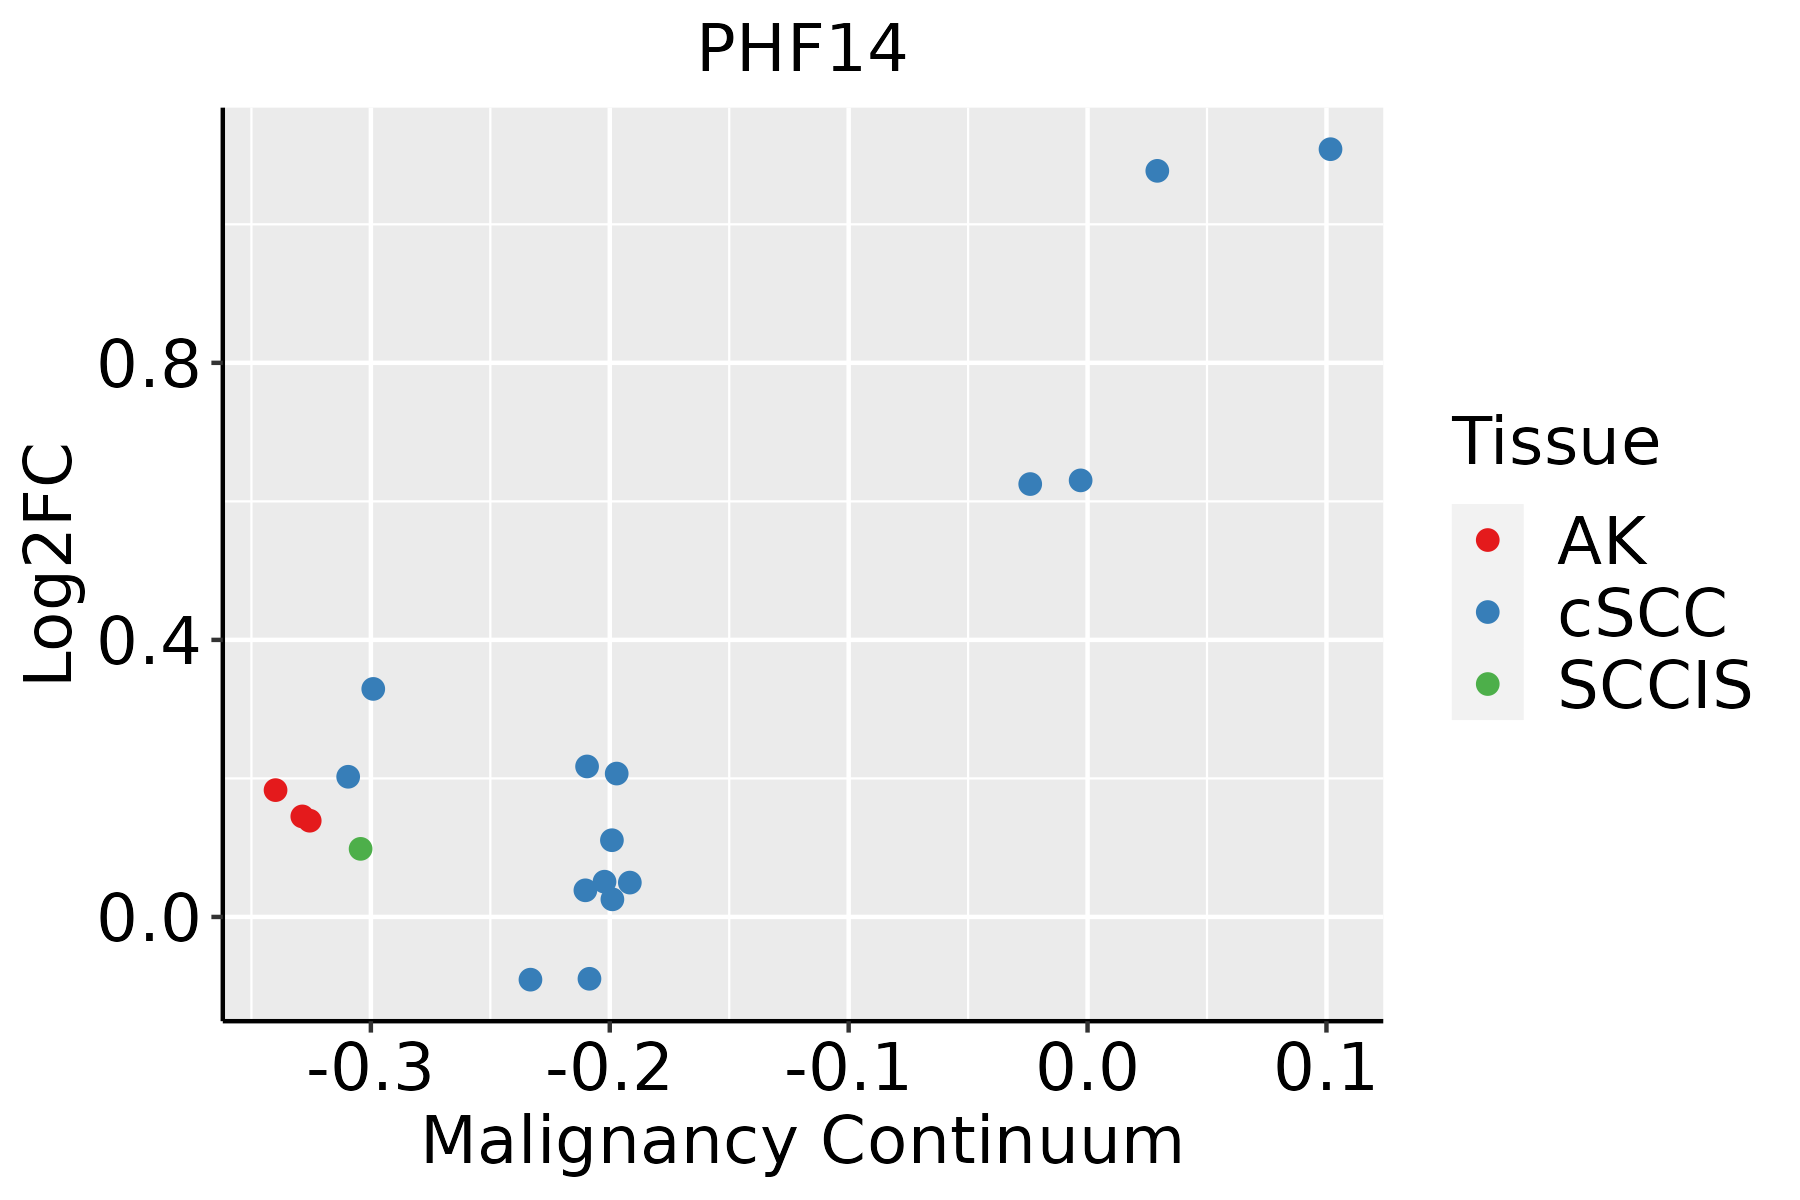 | AK: Actinic keratosis |
| cSCC: Cutaneous squamous cell carcinoma | ||
| SCCIS:squamous cell carcinoma in situ | ||
| Thyroid |  | ATC: Anaplastic thyroid cancer |
| HT: Hashimoto's thyroiditis | ||
| PTC: Papillary thyroid cancer |
| ∗log2FC in expression of this searched gene in stem-like cells from each diseased tissue sample relative to stem-like cells in normal samples in each tissue plotted against the malignancy continuum. Samples are colored based on if they are from different disease stage. |
Top |
Malignant transformation related pathway analysis |
| Find out the enriched GO biological processes and KEGG pathways involved in transition from healthy to precancer to cancer |
| Tissue | Disease Stage | Enriched GO biological Processes |
| Colorectum | AD |  |
| Colorectum | SER |  |
| Colorectum | MSS |  |
| Colorectum | MSI-H |  |
| Colorectum | FAP |  |
| ∗Top 15 enriched GO BP terms are showed in the bar plot of each disease state in each tissue. Each row represents a significant GO biological process which is colored according to the -log10(p.adjust). |
| Page: 1 2 3 4 5 6 7 8 9 |
| GO ID | Tissue | Disease Stage | Description | Gene Ratio | Bg Ratio | pvalue | p.adjust | Count |
| GO:00435432 | Liver | HCC | protein acylation | 157/7958 | 243/18723 | 2.40e-12 | 1.12e-10 | 157 |
| GO:00183942 | Liver | HCC | peptidyl-lysine acetylation | 116/7958 | 169/18723 | 5.11e-12 | 2.23e-10 | 116 |
| GO:00064752 | Liver | HCC | internal protein amino acid acetylation | 107/7958 | 160/18723 | 3.77e-10 | 1.23e-08 | 107 |
| GO:00183932 | Liver | HCC | internal peptidyl-lysine acetylation | 105/7958 | 158/18723 | 9.48e-10 | 2.90e-08 | 105 |
| GO:00165732 | Liver | HCC | histone acetylation | 101/7958 | 152/18723 | 1.99e-09 | 5.63e-08 | 101 |
| GO:0043966 | Liver | HCC | histone H3 acetylation | 37/7958 | 61/18723 | 3.21e-03 | 1.48e-02 | 37 |
| GO:00165704 | Lung | IAC | histone modification | 93/2061 | 463/18723 | 5.41e-09 | 8.03e-07 | 93 |
| GO:00182053 | Lung | IAC | peptidyl-lysine modification | 62/2061 | 376/18723 | 7.55e-04 | 9.82e-03 | 62 |
| GO:001657012 | Lung | AIS | histone modification | 81/1849 | 463/18723 | 2.30e-07 | 2.16e-05 | 81 |
| GO:001657022 | Lung | MIAC | histone modification | 45/967 | 463/18723 | 3.58e-05 | 1.97e-03 | 45 |
| GO:001820511 | Lung | MIAC | peptidyl-lysine modification | 34/967 | 376/18723 | 1.12e-03 | 2.19e-02 | 34 |
| GO:00165707 | Oral cavity | OSCC | histone modification | 270/7305 | 463/18723 | 1.59e-17 | 1.50e-15 | 270 |
| GO:00182056 | Oral cavity | OSCC | peptidyl-lysine modification | 216/7305 | 376/18723 | 2.32e-13 | 1.16e-11 | 216 |
| GO:00435434 | Oral cavity | OSCC | protein acylation | 149/7305 | 243/18723 | 1.33e-12 | 5.80e-11 | 149 |
| GO:00183944 | Oral cavity | OSCC | peptidyl-lysine acetylation | 108/7305 | 169/18723 | 4.55e-11 | 1.45e-09 | 108 |
| GO:00064734 | Oral cavity | OSCC | protein acetylation | 124/7305 | 201/18723 | 5.59e-11 | 1.74e-09 | 124 |
| GO:00165734 | Oral cavity | OSCC | histone acetylation | 96/7305 | 152/18723 | 1.35e-09 | 3.29e-08 | 96 |
| GO:00183934 | Oral cavity | OSCC | internal peptidyl-lysine acetylation | 99/7305 | 158/18723 | 1.41e-09 | 3.39e-08 | 99 |
| GO:00064754 | Oral cavity | OSCC | internal protein amino acid acetylation | 100/7305 | 160/18723 | 1.43e-09 | 3.41e-08 | 100 |
| GO:00439661 | Oral cavity | OSCC | histone H3 acetylation | 36/7305 | 61/18723 | 1.21e-03 | 6.10e-03 | 36 |
| Page: 1 2 3 4 5 6 7 |
| Pathway ID | Tissue | Disease Stage | Description | Gene Ratio | Bg Ratio | pvalue | p.adjust | qvalue | Count |
| Page: 1 |
Top |
Cell-cell communication analysis |
| Identification of potential cell-cell interactions between two cell types and their ligand-receptor pairs for different disease states |
| Ligand | Receptor | LRpair | Pathway | Tissue | Disease Stage |
| Page: 1 |
Top |
Single-cell gene regulatory network inference analysis |
| Find out the significant the regulons (TFs) and the target genes of each regulon across cell types for different disease states |
| TF | Cell Type | Tissue | Disease Stage | Target Gene | RSS | Regulon Activity |
| ∗The dot plots of a searched regulon are shown for all cell subpopulations in each disease state of each tissue based on the regulon specific score inferred using pySCENIC and by calculating the average expression. |
| Page: 1 |
Top |
Somatic mutation of malignant transformation related genes |
| Annotation of somatic variants for genes involved in malignant transformation |
| Hugo Symbol | Variant Class | Variant Classification | dbSNP RS | HGVSc | HGVSp | HGVSp Short | SWISSPROT | BIOTYPE | SIFT | PolyPhen | Tumor Sample Barcode | Tissue | Histology | Sex | Age | Stage | Therapy Types | Drugs | Outcome |
| PHF14 | SNV | Missense_Mutation | c.1852N>T | p.Asp618Tyr | p.D618Y | O94880 | protein_coding | deleterious(0) | possibly_damaging(0.77) | TCGA-A8-A07R-01 | Breast | breast invasive carcinoma | Female | >=65 | III/IV | Ancillary | zoledronic | SD | |
| PHF14 | SNV | Missense_Mutation | rs751491414 | c.2396N>A | p.Arg799Gln | p.R799Q | O94880 | protein_coding | deleterious(0) | possibly_damaging(0.744) | TCGA-AC-A23H-01 | Breast | breast invasive carcinoma | Female | >=65 | I/II | Unknown | Unknown | PD |
| PHF14 | SNV | Missense_Mutation | c.2483N>C | p.Arg828Thr | p.R828T | O94880 | protein_coding | deleterious(0.04) | benign(0.074) | TCGA-AC-A23H-01 | Breast | breast invasive carcinoma | Female | >=65 | I/II | Unknown | Unknown | PD | |
| PHF14 | SNV | Missense_Mutation | rs753298294 | c.2027G>A | p.Arg676Gln | p.R676Q | O94880 | protein_coding | tolerated(0.18) | benign(0.14) | TCGA-AN-A046-01 | Breast | breast invasive carcinoma | Female | >=65 | I/II | Unknown | Unknown | SD |
| PHF14 | SNV | Missense_Mutation | rs751823773 | c.2534N>G | p.Glu845Gly | p.E845G | O94880 | protein_coding | deleterious(0) | probably_damaging(0.979) | TCGA-AQ-A04H-01 | Breast | breast invasive carcinoma | Female | <65 | III/IV | Chemotherapy | taxotere | SD |
| PHF14 | SNV | Missense_Mutation | c.921G>C | p.Lys307Asn | p.K307N | O94880 | protein_coding | tolerated(0.06) | benign(0.143) | TCGA-C8-A12Q-01 | Breast | breast invasive carcinoma | Female | >=65 | III/IV | Unknown | Unknown | PD | |
| PHF14 | deletion | Frame_Shift_Del | novel | c.1226delN | p.Leu410CysfsTer6 | p.L410Cfs*6 | O94880 | protein_coding | TCGA-EW-A2FV-01 | Breast | breast invasive carcinoma | Female | <65 | III/IV | Chemotherapy | docetaxel | SD | ||
| PHF14 | SNV | Missense_Mutation | novel | c.2275C>T | p.Leu759Phe | p.L759F | O94880 | protein_coding | deleterious(0) | probably_damaging(0.999) | TCGA-VS-A9UL-01 | Cervix | cervical & endocervical cancer | Female | >=65 | III/IV | Unknown | Unknown | PD |
| PHF14 | SNV | Missense_Mutation | c.877N>A | p.Leu293Ile | p.L293I | O94880 | protein_coding | tolerated(0.11) | benign(0.045) | TCGA-AA-3715-01 | Colorectum | colon adenocarcinoma | Male | >=65 | I/II | Unknown | Unknown | PD | |
| PHF14 | SNV | Missense_Mutation | c.1154N>A | p.Cys385Tyr | p.C385Y | O94880 | protein_coding | deleterious(0) | probably_damaging(1) | TCGA-AA-3715-01 | Colorectum | colon adenocarcinoma | Male | >=65 | I/II | Unknown | Unknown | PD |
| Page: 1 2 3 4 5 6 7 8 9 10 11 12 |
Top |
Related drugs of malignant transformation related genes |
| Identification of chemicals and drugs interact with genes involved in malignant transfromation |
| (DGIdb 4.0) |
| Entrez ID | Symbol | Category | Interaction Types | Drug Claim Name | Drug Name | PMIDs |
| Page: 1 |

Copyright 2023-Present -The University of Texas Health Science Center at Houston |