
|
|||||
|
 | |
| |
| |
| |
| |
| |
|
Gene: PCGF3 |
Gene summary for PCGF3 |
| Gene information | Species | Human | Gene symbol | PCGF3 | Gene ID | 10336 |
| Gene name | polycomb group ring finger 3 | |
| Gene Alias | DONG1 | |
| Cytomap | 4p16.3 | |
| Gene Type | protein-coding | GO ID | GO:0006139 | UniProtAcc | B3KQ06 |
Top |
Malignant transformation analysis |
| Identification of the aberrant gene expression in precancerous and cancerous lesions by comparing the gene expression of stem-like cells in diseased tissues with normal stem cells |
| Entrez ID | Symbol | Replicates | Species | Organ | Tissue | Adj P-value | Log2FC | Malignancy |
| 10336 | PCGF3 | LZE7T | Human | Esophagus | ESCC | 3.67e-08 | 4.81e-01 | 0.0667 |
| 10336 | PCGF3 | LZE8T | Human | Esophagus | ESCC | 2.76e-07 | 1.05e-01 | 0.067 |
| 10336 | PCGF3 | LZE20T | Human | Esophagus | ESCC | 4.09e-06 | 1.93e-01 | 0.0662 |
| 10336 | PCGF3 | LZE24T | Human | Esophagus | ESCC | 1.92e-13 | 2.22e-01 | 0.0596 |
| 10336 | PCGF3 | P1T-E | Human | Esophagus | ESCC | 2.64e-11 | 4.02e-01 | 0.0875 |
| 10336 | PCGF3 | P2T-E | Human | Esophagus | ESCC | 4.72e-20 | 4.02e-01 | 0.1177 |
| 10336 | PCGF3 | P4T-E | Human | Esophagus | ESCC | 4.65e-14 | 3.64e-01 | 0.1323 |
| 10336 | PCGF3 | P5T-E | Human | Esophagus | ESCC | 4.59e-06 | -1.21e-02 | 0.1327 |
| 10336 | PCGF3 | P8T-E | Human | Esophagus | ESCC | 1.02e-13 | 2.64e-01 | 0.0889 |
| 10336 | PCGF3 | P9T-E | Human | Esophagus | ESCC | 5.80e-12 | 1.76e-01 | 0.1131 |
| 10336 | PCGF3 | P10T-E | Human | Esophagus | ESCC | 2.98e-17 | 2.36e-01 | 0.116 |
| 10336 | PCGF3 | P11T-E | Human | Esophagus | ESCC | 1.35e-08 | 1.69e-01 | 0.1426 |
| 10336 | PCGF3 | P12T-E | Human | Esophagus | ESCC | 7.76e-21 | 2.72e-01 | 0.1122 |
| 10336 | PCGF3 | P15T-E | Human | Esophagus | ESCC | 2.54e-06 | 8.63e-02 | 0.1149 |
| 10336 | PCGF3 | P16T-E | Human | Esophagus | ESCC | 2.73e-16 | 3.00e-01 | 0.1153 |
| 10336 | PCGF3 | P17T-E | Human | Esophagus | ESCC | 7.62e-10 | 2.05e-01 | 0.1278 |
| 10336 | PCGF3 | P19T-E | Human | Esophagus | ESCC | 6.43e-03 | 1.11e-01 | 0.1662 |
| 10336 | PCGF3 | P20T-E | Human | Esophagus | ESCC | 8.58e-15 | 1.80e-01 | 0.1124 |
| 10336 | PCGF3 | P21T-E | Human | Esophagus | ESCC | 2.40e-11 | 1.27e-01 | 0.1617 |
| 10336 | PCGF3 | P22T-E | Human | Esophagus | ESCC | 2.35e-14 | 2.08e-01 | 0.1236 |
| Page: 1 2 3 4 5 6 |
| Tissue | Expression Dynamics | Abbreviation |
| Esophagus |  | ESCC: Esophageal squamous cell carcinoma |
| HGIN: High-grade intraepithelial neoplasias | ||
| LGIN: Low-grade intraepithelial neoplasias | ||
| Liver | 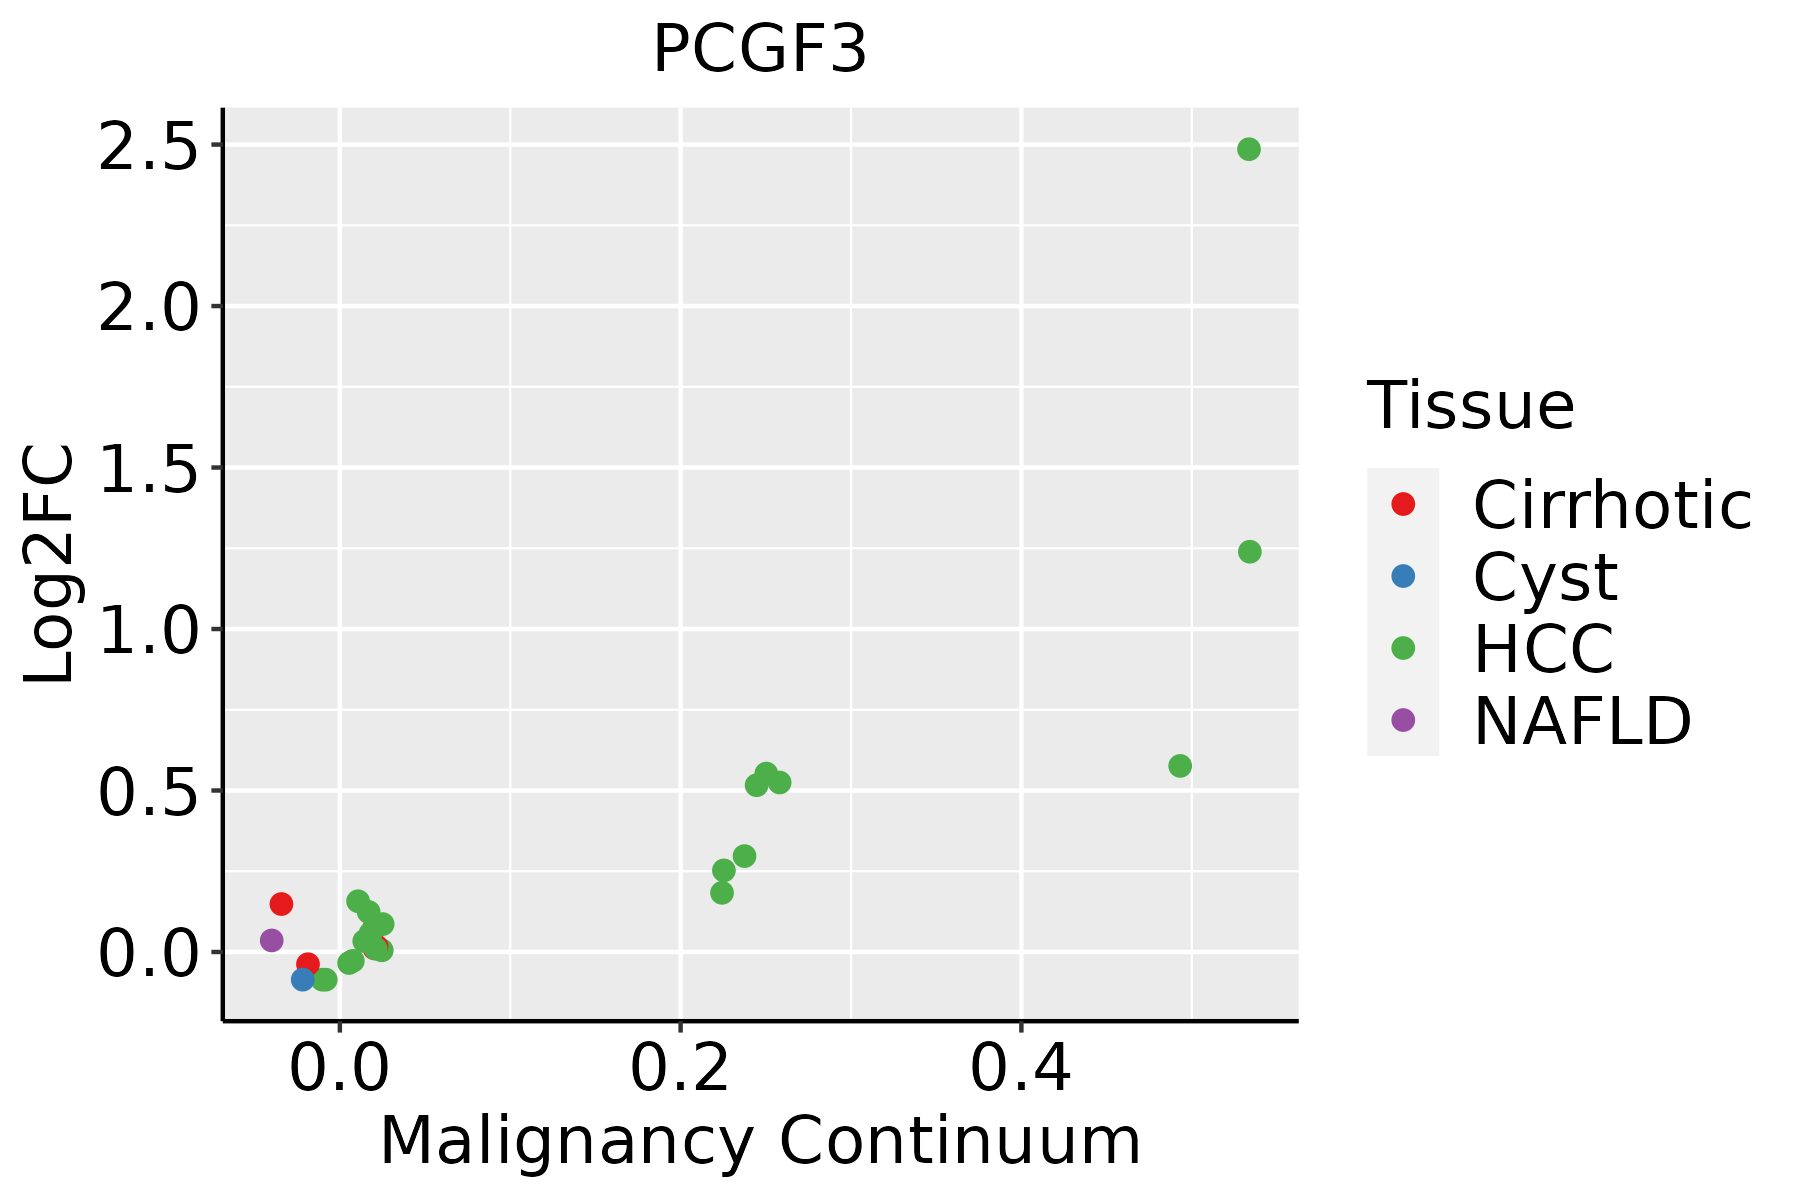 | HCC: Hepatocellular carcinoma |
| NAFLD: Non-alcoholic fatty liver disease | ||
| Lung |  | AAH: Atypical adenomatous hyperplasia |
| AIS: Adenocarcinoma in situ | ||
| IAC: Invasive lung adenocarcinoma | ||
| MIA: Minimally invasive adenocarcinoma | ||
| Oral Cavity | 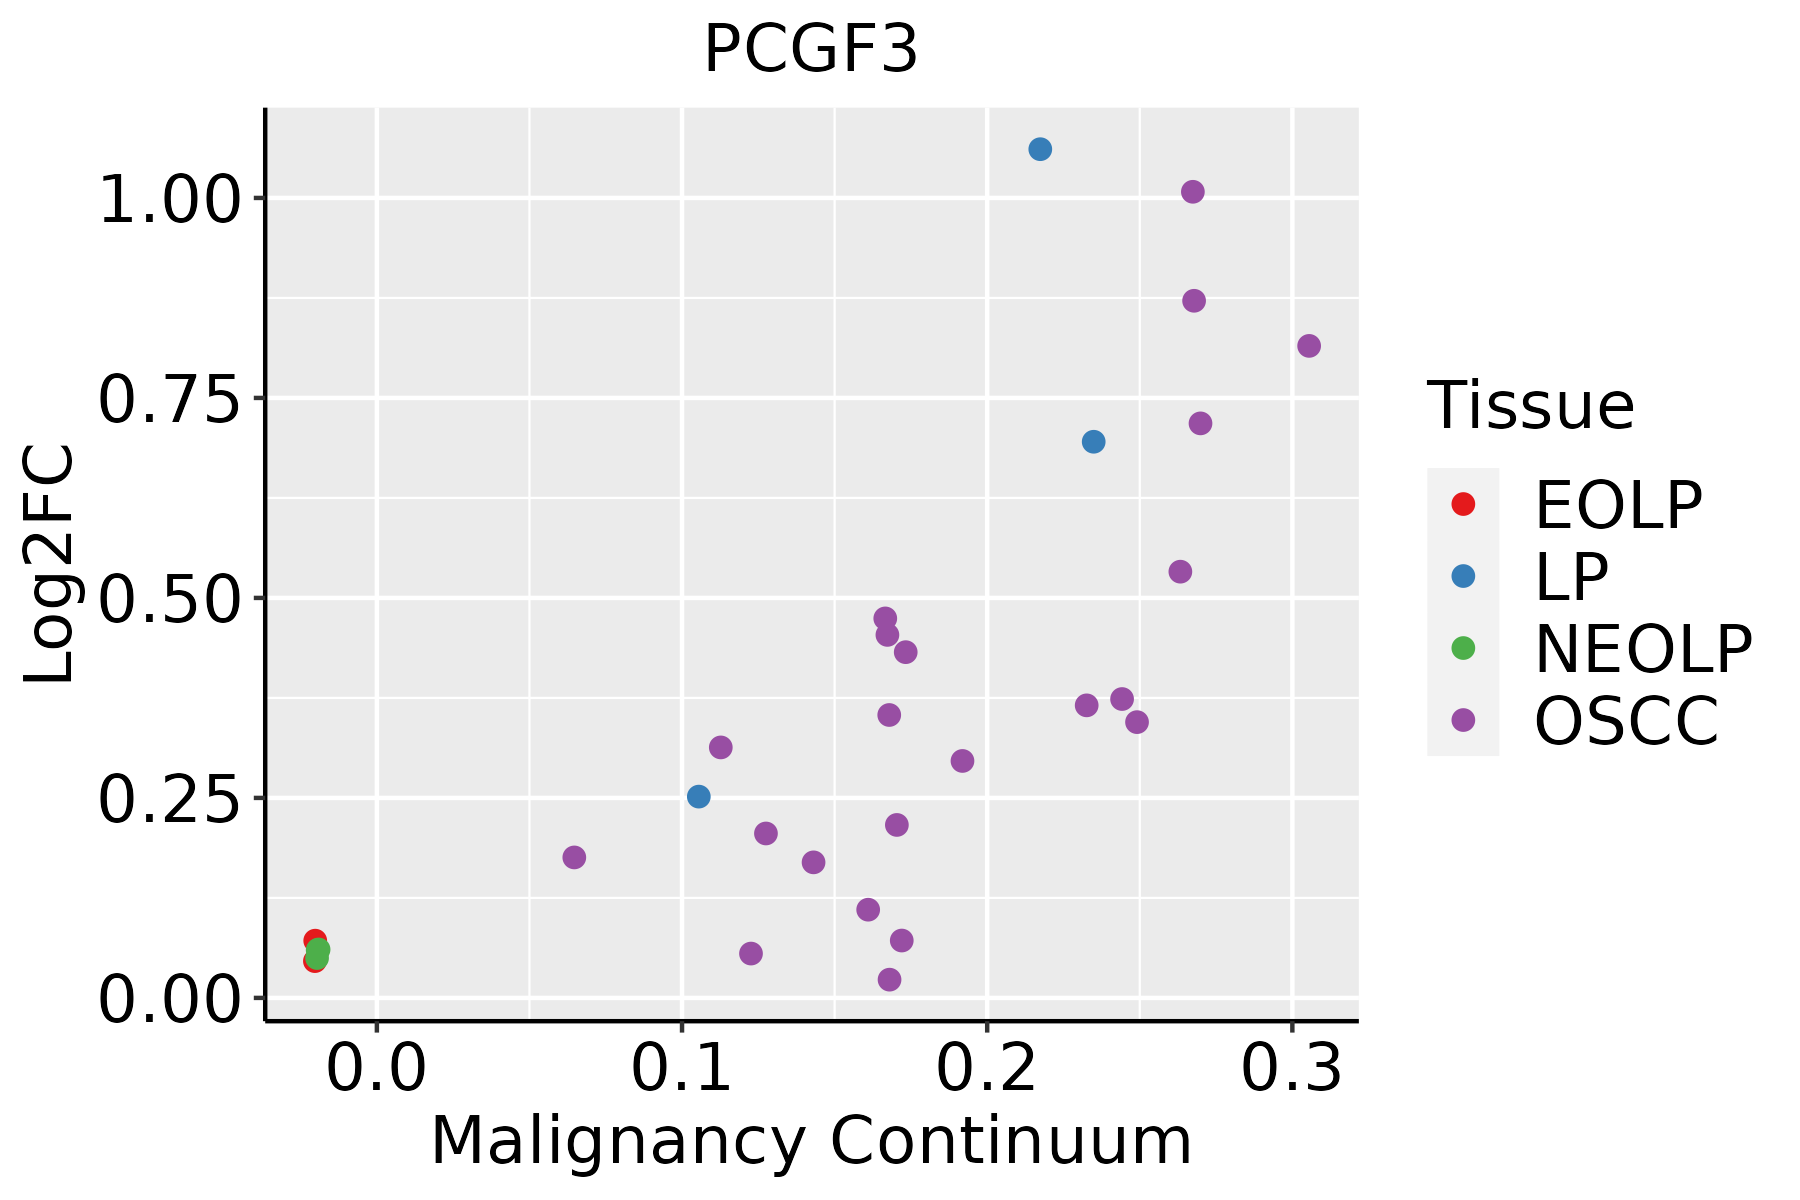 | EOLP: Erosive Oral lichen planus |
| LP: leukoplakia | ||
| NEOLP: Non-erosive oral lichen planus | ||
| OSCC: Oral squamous cell carcinoma | ||
| Thyroid | 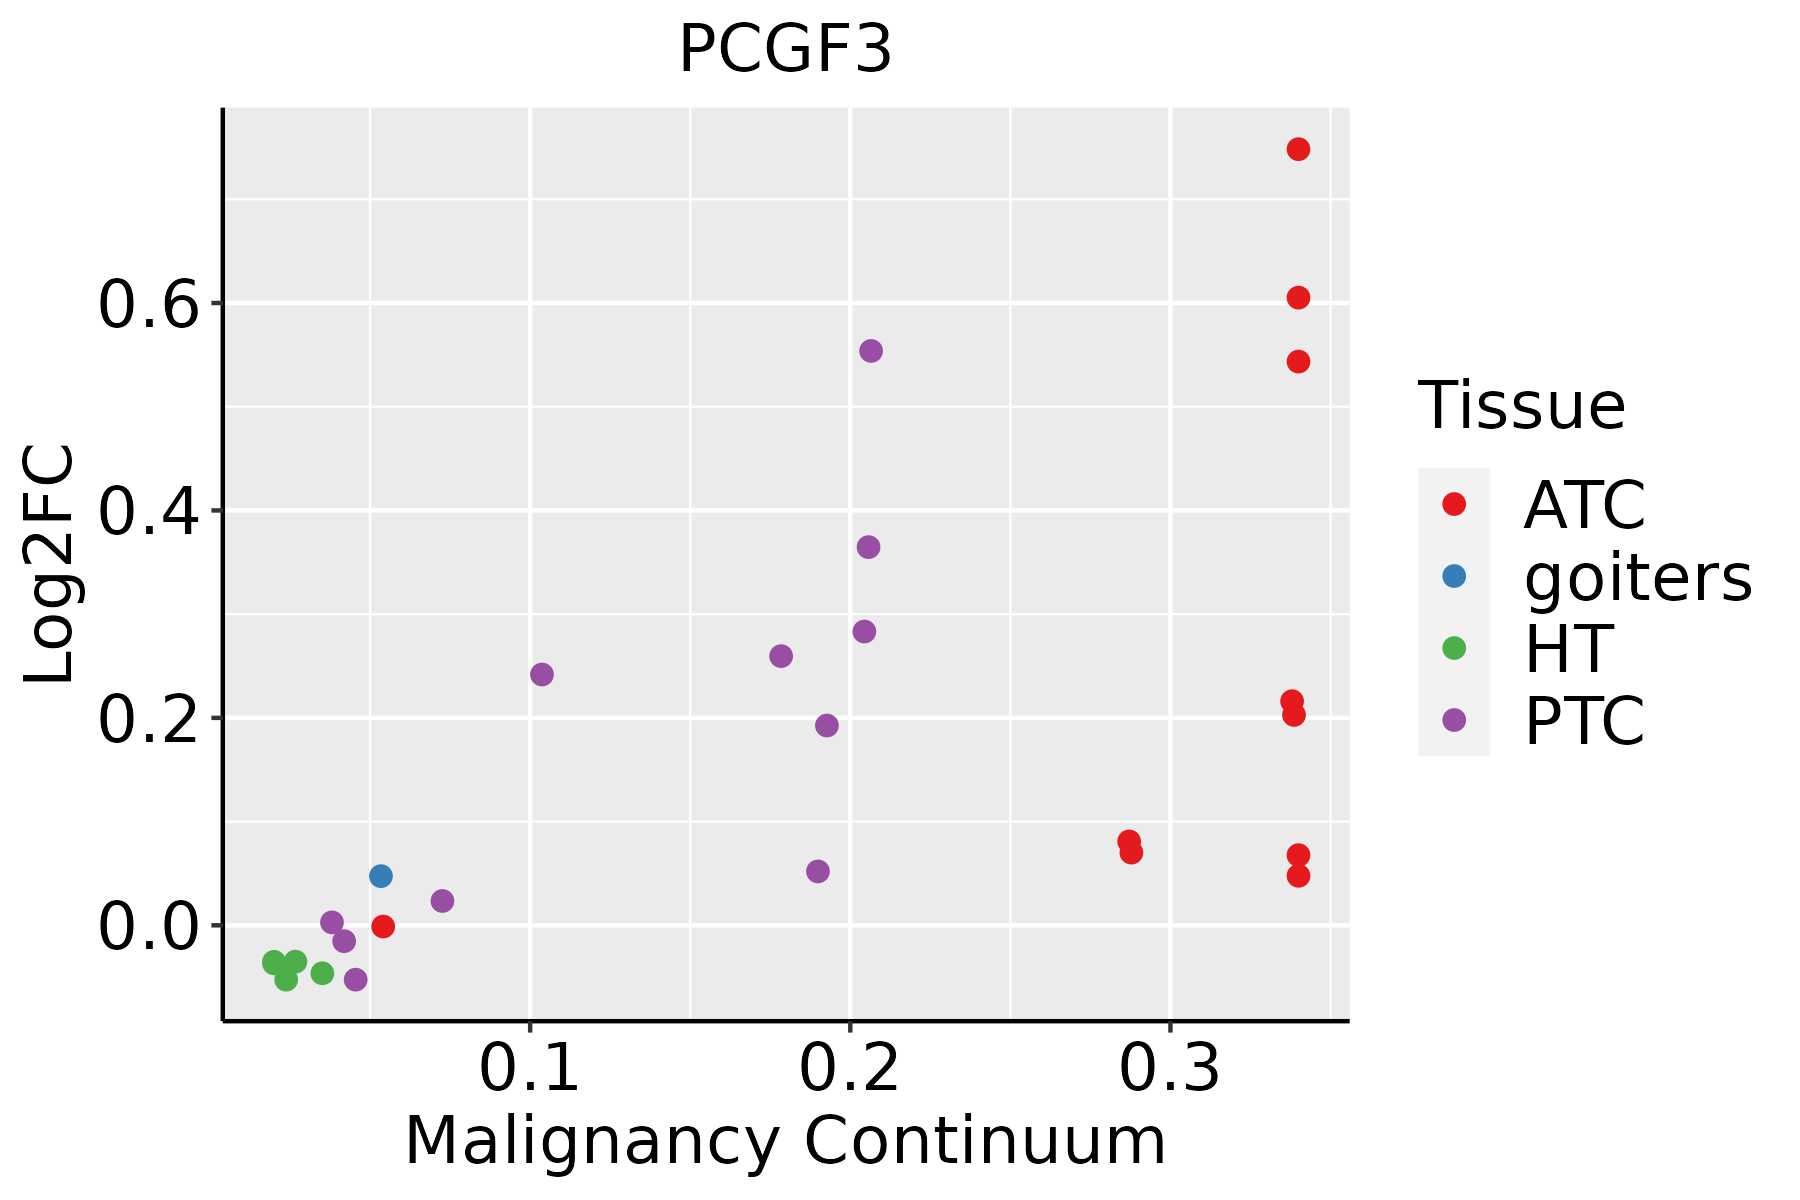 | ATC: Anaplastic thyroid cancer |
| HT: Hashimoto's thyroiditis | ||
| PTC: Papillary thyroid cancer |
| ∗log2FC in expression of this searched gene in stem-like cells from each diseased tissue sample relative to stem-like cells in normal samples in each tissue plotted against the malignancy continuum. Samples are colored based on if they are from different disease stage. |
Top |
Malignant transformation related pathway analysis |
| Find out the enriched GO biological processes and KEGG pathways involved in transition from healthy to precancer to cancer |
| Tissue | Disease Stage | Enriched GO biological Processes |
| Colorectum | AD |  |
| Colorectum | SER |  |
| Colorectum | MSS |  |
| Colorectum | MSI-H |  |
| Colorectum | FAP |  |
| ∗Top 15 enriched GO BP terms are showed in the bar plot of each disease state in each tissue. Each row represents a significant GO biological process which is colored according to the -log10(p.adjust). |
| Page: 1 2 3 4 5 6 7 8 9 |
| GO ID | Tissue | Disease Stage | Description | Gene Ratio | Bg Ratio | pvalue | p.adjust | Count |
| GO:00090485 | Thyroid | PTC | dosage compensation by inactivation of X chromosome | 10/5968 | 16/18723 | 1.13e-02 | 4.49e-02 | 10 |
| GO:001657017 | Thyroid | ATC | histone modification | 243/6293 | 463/18723 | 2.23e-17 | 2.27e-15 | 243 |
| GO:004002913 | Thyroid | ATC | regulation of gene expression, epigenetic | 57/6293 | 105/18723 | 1.01e-05 | 1.00e-04 | 57 |
| GO:001657416 | Thyroid | ATC | histone ubiquitination | 30/6293 | 47/18723 | 2.16e-05 | 1.92e-04 | 30 |
| GO:003352214 | Thyroid | ATC | histone H2A ubiquitination | 18/6293 | 26/18723 | 2.20e-04 | 1.44e-03 | 18 |
| GO:000651314 | Thyroid | ATC | protein monoubiquitination | 35/6293 | 67/18723 | 1.26e-03 | 6.58e-03 | 35 |
| GO:00103905 | Thyroid | ATC | histone monoubiquitination | 16/6293 | 29/18723 | 1.37e-02 | 4.77e-02 | 16 |
| Page: 1 2 3 |
| Pathway ID | Tissue | Disease Stage | Description | Gene Ratio | Bg Ratio | pvalue | p.adjust | qvalue | Count |
| Page: 1 |
Top |
Cell-cell communication analysis |
| Identification of potential cell-cell interactions between two cell types and their ligand-receptor pairs for different disease states |
| Ligand | Receptor | LRpair | Pathway | Tissue | Disease Stage |
| Page: 1 |
Top |
Single-cell gene regulatory network inference analysis |
| Find out the significant the regulons (TFs) and the target genes of each regulon across cell types for different disease states |
| TF | Cell Type | Tissue | Disease Stage | Target Gene | RSS | Regulon Activity |
| ∗The dot plots of a searched regulon are shown for all cell subpopulations in each disease state of each tissue based on the regulon specific score inferred using pySCENIC and by calculating the average expression. |
| Page: 1 |
Top |
Somatic mutation of malignant transformation related genes |
| Annotation of somatic variants for genes involved in malignant transformation |
| Hugo Symbol | Variant Class | Variant Classification | dbSNP RS | HGVSc | HGVSp | HGVSp Short | SWISSPROT | BIOTYPE | SIFT | PolyPhen | Tumor Sample Barcode | Tissue | Histology | Sex | Age | Stage | Therapy Types | Drugs | Outcome |
| PCGF3 | SNV | Missense_Mutation | c.134N>T | p.Tyr45Phe | p.Y45F | Q3KNV8 | protein_coding | deleterious(0.05) | possibly_damaging(0.897) | TCGA-D8-A1JS-01 | Breast | breast invasive carcinoma | Female | >=65 | I/II | Hormone Therapy | tamoxiphen | SD | |
| PCGF3 | SNV | Missense_Mutation | c.672G>T | p.Trp224Cys | p.W224C | Q3KNV8 | protein_coding | tolerated(0.05) | probably_damaging(0.999) | TCGA-EA-A43B-01 | Cervix | cervical & endocervical cancer | Female | <65 | I/II | Chemotherapy | cisplatin | CR | |
| PCGF3 | SNV | Missense_Mutation | novel | c.402C>A | p.Asn134Lys | p.N134K | Q3KNV8 | protein_coding | tolerated(0.76) | benign(0) | TCGA-HM-A4S6-01 | Cervix | cervical & endocervical cancer | Female | <65 | III/IV | Chemotherapy | cisplatin | CR |
| PCGF3 | SNV | Missense_Mutation | c.499C>T | p.Arg167Cys | p.R167C | Q3KNV8 | protein_coding | deleterious(0) | possibly_damaging(0.814) | TCGA-A6-6781-01 | Colorectum | colon adenocarcinoma | Male | <65 | III/IV | Chemotherapy | oxaliplatin | SD | |
| PCGF3 | SNV | Missense_Mutation | rs757796778 | c.37N>A | p.Ala13Thr | p.A13T | Q3KNV8 | protein_coding | tolerated(0.1) | benign(0.093) | TCGA-AA-A022-01 | Colorectum | colon adenocarcinoma | Female | >=65 | I/II | Unknown | Unknown | SD |
| PCGF3 | SNV | Missense_Mutation | c.121N>A | p.Cys41Ser | p.C41S | Q3KNV8 | protein_coding | deleterious(0) | probably_damaging(1) | TCGA-A5-A0R8-01 | Endometrium | uterine corpus endometrioid carcinoma | Female | >=65 | I/II | Unknown | Unknown | PD | |
| PCGF3 | SNV | Missense_Mutation | novel | c.191N>T | p.Pro64Leu | p.P64L | Q3KNV8 | protein_coding | deleterious(0) | probably_damaging(0.999) | TCGA-A5-A1OF-01 | Endometrium | uterine corpus endometrioid carcinoma | Female | <65 | I/II | Unknown | Unknown | SD |
| PCGF3 | SNV | Missense_Mutation | novel | c.199N>C | p.Tyr67His | p.Y67H | Q3KNV8 | protein_coding | deleterious(0) | probably_damaging(0.994) | TCGA-AJ-A3EK-01 | Endometrium | uterine corpus endometrioid carcinoma | Female | <65 | I/II | Chemotherapy | carboplatin | CR |
| PCGF3 | SNV | Missense_Mutation | rs761352143 | c.263N>T | p.Ala88Val | p.A88V | Q3KNV8 | protein_coding | tolerated(0.29) | benign(0.043) | TCGA-AJ-A3EK-01 | Endometrium | uterine corpus endometrioid carcinoma | Female | <65 | I/II | Chemotherapy | carboplatin | CR |
| PCGF3 | SNV | Missense_Mutation | rs757796778 | c.37G>A | p.Ala13Thr | p.A13T | Q3KNV8 | protein_coding | tolerated(0.1) | benign(0.093) | TCGA-AP-A051-01 | Endometrium | uterine corpus endometrioid carcinoma | Female | >=65 | I/II | Unknown | Unknown | SD |
| Page: 1 2 3 4 |
Top |
Related drugs of malignant transformation related genes |
| Identification of chemicals and drugs interact with genes involved in malignant transfromation |
| (DGIdb 4.0) |
| Entrez ID | Symbol | Category | Interaction Types | Drug Claim Name | Drug Name | PMIDs |
| Page: 1 |

Copyright 2023-Present -The University of Texas Health Science Center at Houston |