
|
|||||
|
 | |
| |
| |
| |
| |
| |
|
Gene: PAG1 |
Gene summary for PAG1 |
| Gene information | Species | Human | Gene symbol | PAG1 | Gene ID | 55824 |
| Gene name | phosphoprotein membrane anchor with glycosphingolipid microdomains 1 | |
| Gene Alias | CBP | |
| Cytomap | 8q21.13 | |
| Gene Type | protein-coding | GO ID | GO:0001775 | UniProtAcc | Q9NWQ8 |
Top |
Malignant transformation analysis |
| Identification of the aberrant gene expression in precancerous and cancerous lesions by comparing the gene expression of stem-like cells in diseased tissues with normal stem cells |
| Entrez ID | Symbol | Replicates | Species | Organ | Tissue | Adj P-value | Log2FC | Malignancy |
| 55824 | PAG1 | HTA11_3410_2000001011 | Human | Colorectum | AD | 1.02e-09 | -4.70e-01 | 0.0155 |
| 55824 | PAG1 | HTA11_347_2000001011 | Human | Colorectum | AD | 2.49e-12 | 6.21e-01 | -0.1954 |
| 55824 | PAG1 | HTA11_411_2000001011 | Human | Colorectum | SER | 3.58e-02 | 1.14e+00 | -0.2602 |
| 55824 | PAG1 | HTA11_866_3004761011 | Human | Colorectum | AD | 1.04e-05 | -4.30e-01 | 0.096 |
| 55824 | PAG1 | HTA11_10711_2000001011 | Human | Colorectum | AD | 1.75e-02 | -4.30e-01 | 0.0338 |
| 55824 | PAG1 | HTA11_7696_3000711011 | Human | Colorectum | AD | 1.60e-13 | -4.72e-01 | 0.0674 |
| 55824 | PAG1 | HTA11_99999970781_79442 | Human | Colorectum | MSS | 4.35e-05 | -3.26e-01 | 0.294 |
| 55824 | PAG1 | HTA11_99999971662_82457 | Human | Colorectum | MSS | 3.67e-10 | -3.99e-01 | 0.3859 |
| 55824 | PAG1 | HTA11_99999973899_84307 | Human | Colorectum | MSS | 6.33e-03 | -4.92e-01 | 0.2585 |
| 55824 | PAG1 | HTA11_99999974143_84620 | Human | Colorectum | MSS | 1.20e-13 | -4.63e-01 | 0.3005 |
| 55824 | PAG1 | F007 | Human | Colorectum | FAP | 6.87e-03 | -3.92e-01 | 0.1176 |
| 55824 | PAG1 | A002-C-010 | Human | Colorectum | FAP | 2.39e-06 | -3.42e-01 | 0.242 |
| 55824 | PAG1 | A015-C-203 | Human | Colorectum | FAP | 1.37e-16 | -3.56e-01 | -0.1294 |
| 55824 | PAG1 | A015-C-204 | Human | Colorectum | FAP | 5.41e-05 | -3.59e-01 | -0.0228 |
| 55824 | PAG1 | A014-C-040 | Human | Colorectum | FAP | 1.62e-02 | -4.09e-01 | -0.1184 |
| 55824 | PAG1 | A002-C-201 | Human | Colorectum | FAP | 1.16e-10 | -4.18e-01 | 0.0324 |
| 55824 | PAG1 | A002-C-203 | Human | Colorectum | FAP | 8.63e-08 | -2.91e-01 | 0.2786 |
| 55824 | PAG1 | A001-C-119 | Human | Colorectum | FAP | 2.76e-09 | -4.77e-01 | -0.1557 |
| 55824 | PAG1 | A001-C-108 | Human | Colorectum | FAP | 8.94e-11 | -2.66e-01 | -0.0272 |
| 55824 | PAG1 | A002-C-205 | Human | Colorectum | FAP | 1.21e-13 | -4.14e-01 | -0.1236 |
| Page: 1 2 3 4 |
| Tissue | Expression Dynamics | Abbreviation |
| Colorectum (GSE201348) |  | FAP: Familial adenomatous polyposis |
| CRC: Colorectal cancer | ||
| Colorectum (HTA11) |  | AD: Adenomas |
| SER: Sessile serrated lesions | ||
| MSI-H: Microsatellite-high colorectal cancer | ||
| MSS: Microsatellite stable colorectal cancer | ||
| Liver | 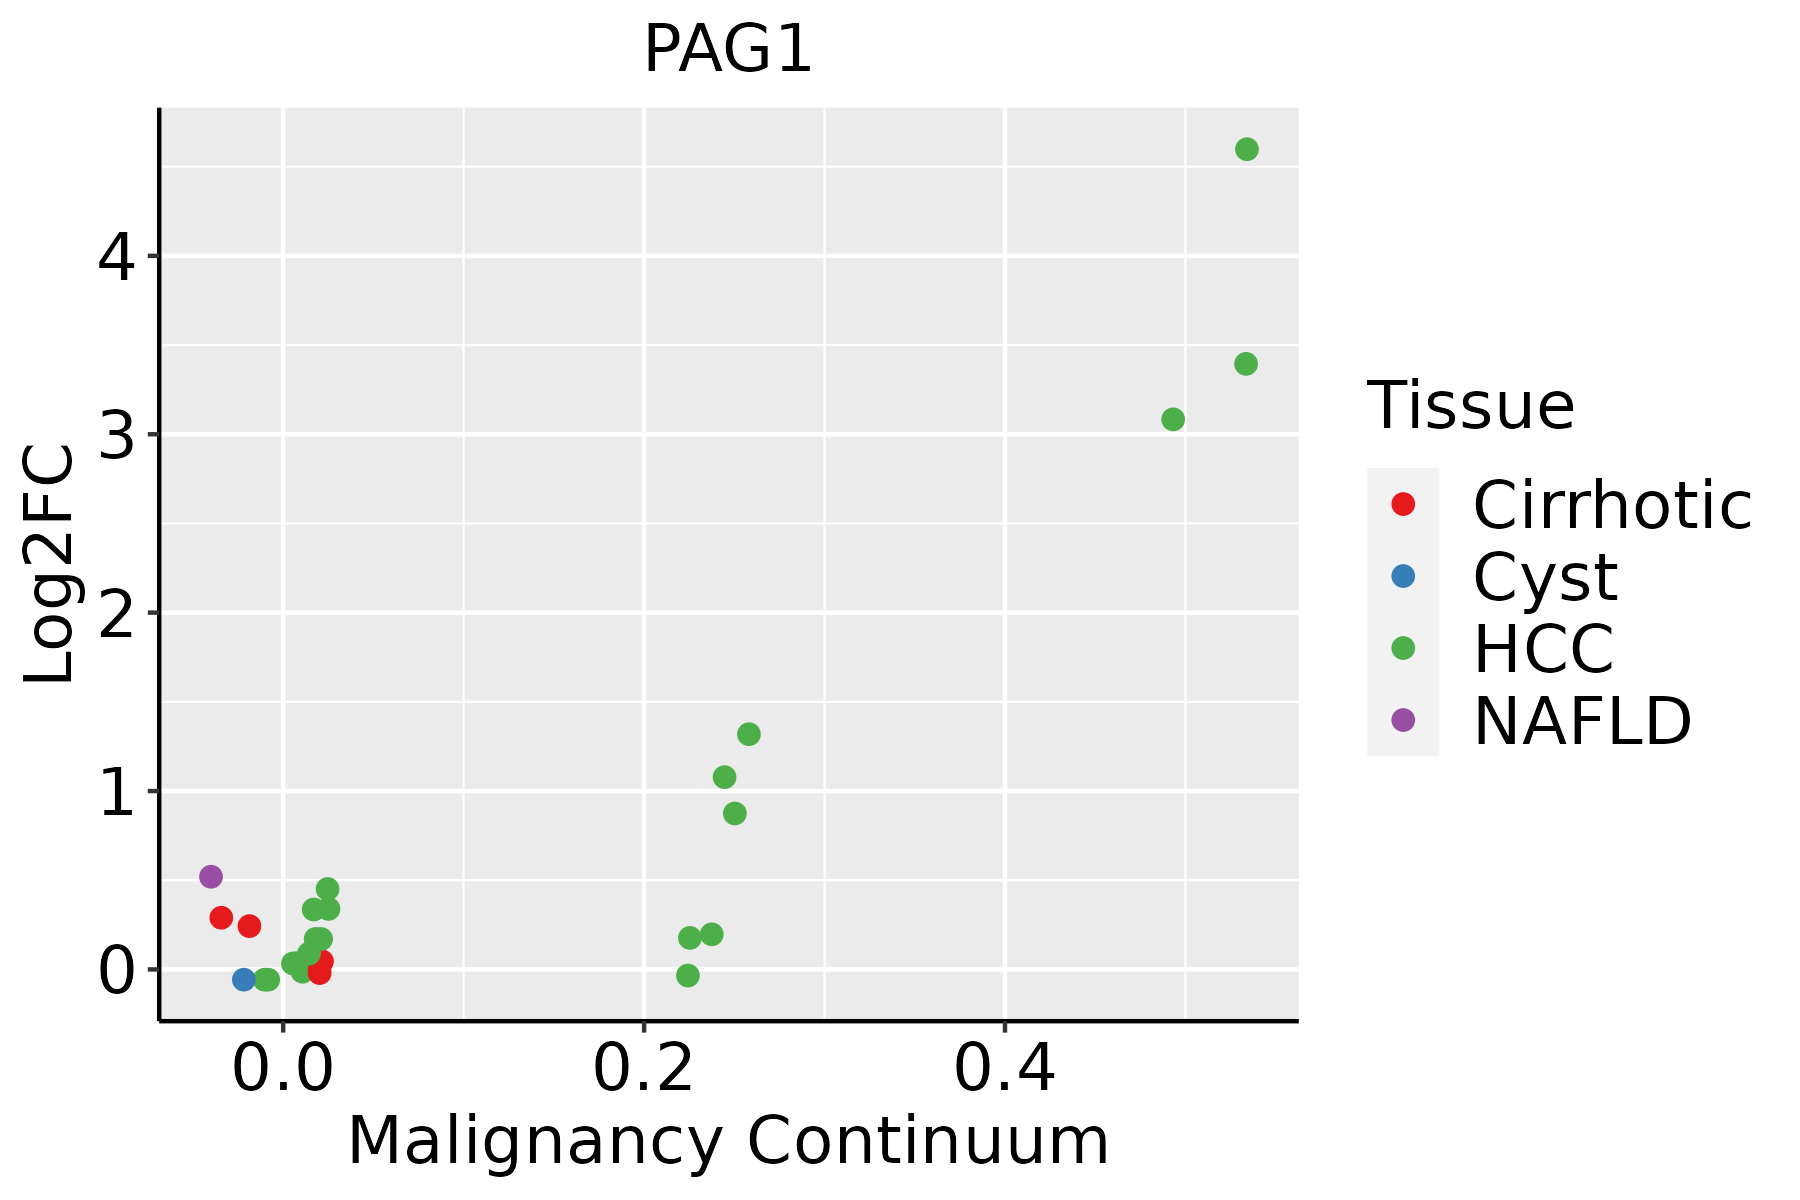 | HCC: Hepatocellular carcinoma |
| NAFLD: Non-alcoholic fatty liver disease | ||
| Oral Cavity | 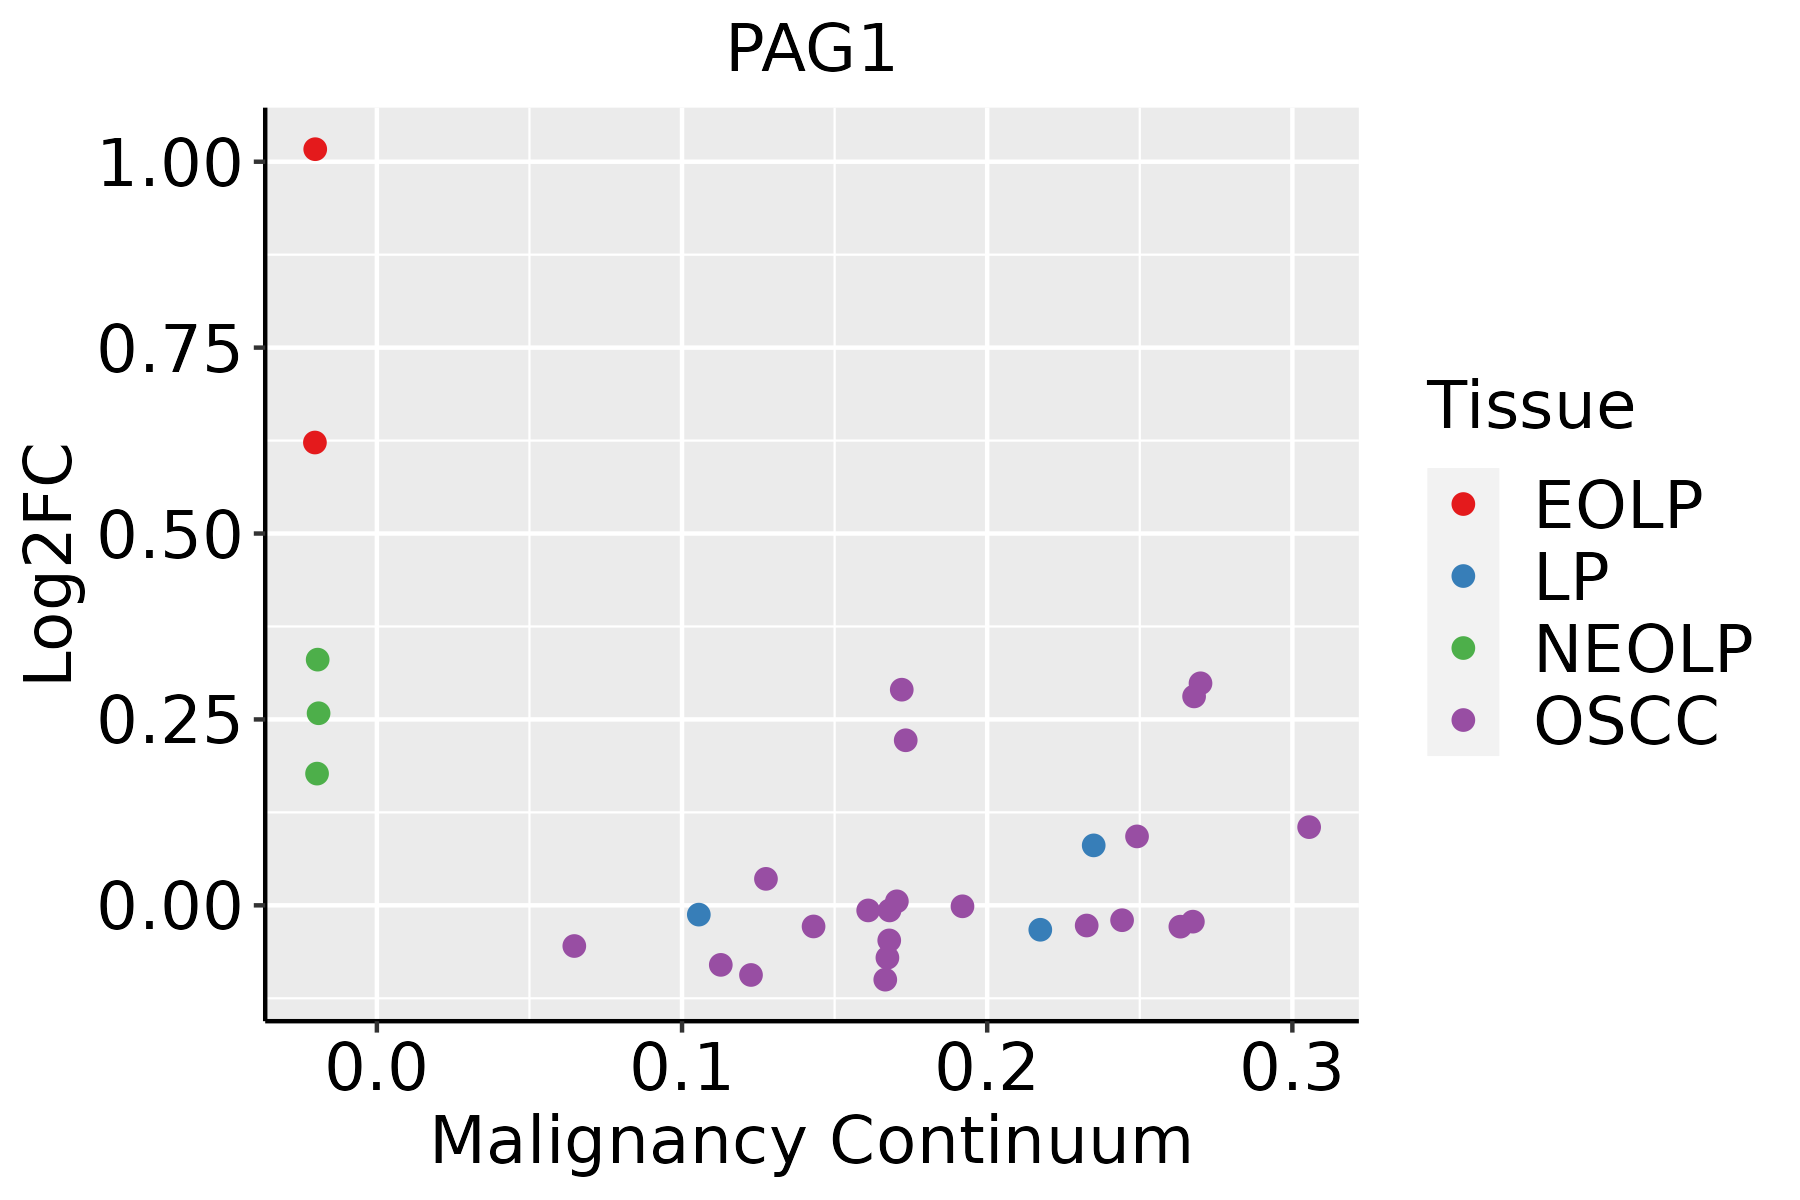 | EOLP: Erosive Oral lichen planus |
| LP: leukoplakia | ||
| NEOLP: Non-erosive oral lichen planus | ||
| OSCC: Oral squamous cell carcinoma | ||
| Thyroid | 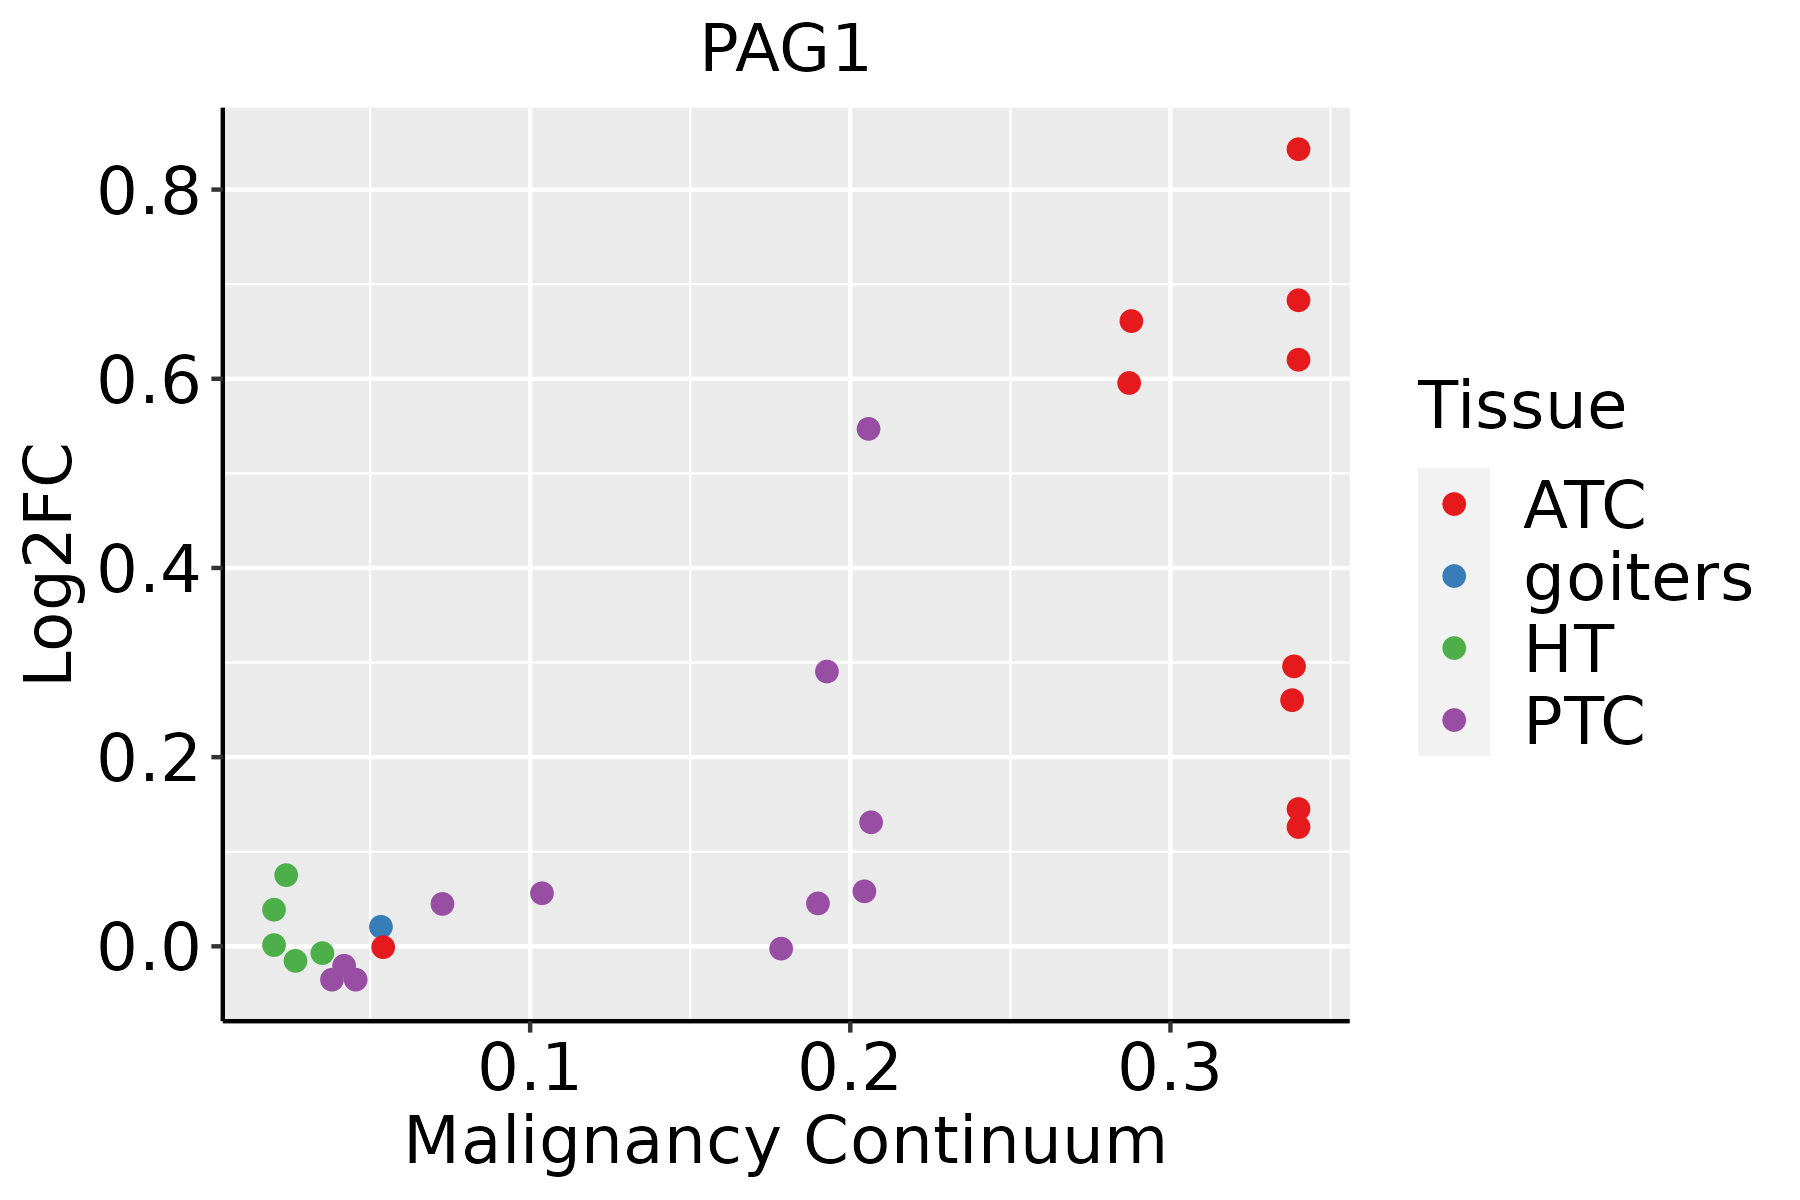 | ATC: Anaplastic thyroid cancer |
| HT: Hashimoto's thyroiditis | ||
| PTC: Papillary thyroid cancer |
| ∗log2FC in expression of this searched gene in stem-like cells from each diseased tissue sample relative to stem-like cells in normal samples in each tissue plotted against the malignancy continuum. Samples are colored based on if they are from different disease stage. |
Top |
Malignant transformation related pathway analysis |
| Find out the enriched GO biological processes and KEGG pathways involved in transition from healthy to precancer to cancer |
| Tissue | Disease Stage | Enriched GO biological Processes |
| Colorectum | AD |  |
| Colorectum | SER |  |
| Colorectum | MSS |  |
| Colorectum | MSI-H |  |
| Colorectum | FAP |  |
| ∗Top 15 enriched GO BP terms are showed in the bar plot of each disease state in each tissue. Each row represents a significant GO biological process which is colored according to the -log10(p.adjust). |
| Page: 1 2 3 4 5 6 7 8 9 |
| GO ID | Tissue | Disease Stage | Description | Gene Ratio | Bg Ratio | pvalue | p.adjust | Count |
| GO:00991115 | Thyroid | PTC | microtubule-based transport | 88/5968 | 190/18723 | 2.08e-05 | 2.08e-04 | 88 |
| GO:000716219 | Thyroid | PTC | negative regulation of cell adhesion | 117/5968 | 303/18723 | 7.28e-03 | 3.12e-02 | 117 |
| GO:009911112 | Thyroid | ATC | microtubule-based transport | 91/6293 | 190/18723 | 2.97e-05 | 2.48e-04 | 91 |
| GO:000716225 | Thyroid | ATC | negative regulation of cell adhesion | 127/6293 | 303/18723 | 1.45e-03 | 7.47e-03 | 127 |
| Page: 1 2 3 |
| Pathway ID | Tissue | Disease Stage | Description | Gene Ratio | Bg Ratio | pvalue | p.adjust | qvalue | Count |
| Page: 1 |
Top |
Cell-cell communication analysis |
| Identification of potential cell-cell interactions between two cell types and their ligand-receptor pairs for different disease states |
| Ligand | Receptor | LRpair | Pathway | Tissue | Disease Stage |
| Page: 1 |
Top |
Single-cell gene regulatory network inference analysis |
| Find out the significant the regulons (TFs) and the target genes of each regulon across cell types for different disease states |
| TF | Cell Type | Tissue | Disease Stage | Target Gene | RSS | Regulon Activity |
| ∗The dot plots of a searched regulon are shown for all cell subpopulations in each disease state of each tissue based on the regulon specific score inferred using pySCENIC and by calculating the average expression. |
| Page: 1 |
Top |
Somatic mutation of malignant transformation related genes |
| Annotation of somatic variants for genes involved in malignant transformation |
| Hugo Symbol | Variant Class | Variant Classification | dbSNP RS | HGVSc | HGVSp | HGVSp Short | SWISSPROT | BIOTYPE | SIFT | PolyPhen | Tumor Sample Barcode | Tissue | Histology | Sex | Age | Stage | Therapy Types | Drugs | Outcome |
| PAG1 | SNV | Missense_Mutation | c.1090N>A | p.Asp364Asn | p.D364N | Q9NWQ8 | protein_coding | deleterious(0) | possibly_damaging(0.824) | TCGA-A2-A0EY-01 | Breast | breast invasive carcinoma | Female | <65 | I/II | Chemotherapy | adriamycin | SD | |
| PAG1 | SNV | Missense_Mutation | c.725N>C | p.Val242Ala | p.V242A | Q9NWQ8 | protein_coding | tolerated(0.84) | benign(0) | TCGA-BH-A0AW-01 | Breast | breast invasive carcinoma | Female | <65 | I/II | Chemotherapy | carboplatin | SD | |
| PAG1 | SNV | Missense_Mutation | c.928N>A | p.Glu310Lys | p.E310K | Q9NWQ8 | protein_coding | deleterious(0.01) | possibly_damaging(0.624) | TCGA-DS-A0VN-01 | Cervix | cervical & endocervical cancer | Female | <65 | I/II | Chemotherapy | cisplatin | SD | |
| PAG1 | SNV | Missense_Mutation | rs779168554 | c.235G>A | p.Ala79Thr | p.A79T | Q9NWQ8 | protein_coding | tolerated(0.2) | benign(0.23) | TCGA-EA-A410-01 | Cervix | cervical & endocervical cancer | Female | <65 | I/II | Unknown | Unknown | SD |
| PAG1 | SNV | Missense_Mutation | novel | c.596G>A | p.Gly199Asp | p.G199D | Q9NWQ8 | protein_coding | deleterious(0.03) | benign(0.037) | TCGA-VS-A9V3-01 | Cervix | cervical & endocervical cancer | Female | <65 | I/II | Chemotherapy | cisplatin | PD |
| PAG1 | SNV | Missense_Mutation | rs372766293 | c.1166N>T | p.Ala389Val | p.A389V | Q9NWQ8 | protein_coding | tolerated(0.05) | probably_damaging(0.96) | TCGA-CM-6680-01 | Colorectum | colon adenocarcinoma | Female | >=65 | III/IV | Unknown | Unknown | SD |
| PAG1 | SNV | Missense_Mutation | c.501N>T | p.Lys167Asn | p.K167N | Q9NWQ8 | protein_coding | deleterious(0) | probably_damaging(0.999) | TCGA-NH-A50V-01 | Colorectum | colon adenocarcinoma | Male | >=65 | III/IV | Chemotherapy | fluorouracil | CR | |
| PAG1 | SNV | Missense_Mutation | rs151324516 | c.10N>A | p.Ala4Thr | p.A4T | Q9NWQ8 | protein_coding | tolerated(0.47) | benign(0.006) | TCGA-AG-A002-01 | Colorectum | rectum adenocarcinoma | Male | <65 | I/II | Unknown | Unknown | SD |
| PAG1 | SNV | Missense_Mutation | rs760035686 | c.122N>G | p.Asp41Gly | p.D41G | Q9NWQ8 | protein_coding | tolerated(0.06) | benign(0.154) | TCGA-F5-6814-01 | Colorectum | rectum adenocarcinoma | Male | <65 | I/II | Unknown | Unknown | SD |
| PAG1 | SNV | Missense_Mutation | novel | c.1072C>A | p.Leu358Ile | p.L358I | Q9NWQ8 | protein_coding | deleterious(0.01) | probably_damaging(0.916) | TCGA-A5-A0G2-01 | Endometrium | uterine corpus endometrioid carcinoma | Female | <65 | III/IV | Unknown | Unknown | SD |
| Page: 1 2 3 4 5 6 |
Top |
Related drugs of malignant transformation related genes |
| Identification of chemicals and drugs interact with genes involved in malignant transfromation |
| (DGIdb 4.0) |
| Entrez ID | Symbol | Category | Interaction Types | Drug Claim Name | Drug Name | PMIDs |
| Page: 1 |

Copyright 2023-Present -The University of Texas Health Science Center at Houston |