
|
|||||
|
 | |
| |
| |
| |
| |
| |
|
Gene: OXCT1 |
Gene summary for OXCT1 |
| Gene information | Species | Human | Gene symbol | OXCT1 | Gene ID | 5019 |
| Gene name | 3-oxoacid CoA-transferase 1 | |
| Gene Alias | OXCT | |
| Cytomap | 5p13.1 | |
| Gene Type | protein-coding | GO ID | GO:0001678 | UniProtAcc | A0A024R040 |
Top |
Malignant transformation analysis |
| Identification of the aberrant gene expression in precancerous and cancerous lesions by comparing the gene expression of stem-like cells in diseased tissues with normal stem cells |
| Entrez ID | Symbol | Replicates | Species | Organ | Tissue | Adj P-value | Log2FC | Malignancy |
| 5019 | OXCT1 | LZE7T | Human | Esophagus | ESCC | 7.46e-03 | 3.61e-01 | 0.0667 |
| 5019 | OXCT1 | LZE8T | Human | Esophagus | ESCC | 3.34e-02 | 1.20e-01 | 0.067 |
| 5019 | OXCT1 | LZE22T | Human | Esophagus | ESCC | 1.12e-02 | 2.66e-01 | 0.068 |
| 5019 | OXCT1 | LZE24T | Human | Esophagus | ESCC | 5.87e-04 | 1.02e-01 | 0.0596 |
| 5019 | OXCT1 | LZE6T | Human | Esophagus | ESCC | 4.17e-07 | 3.82e-01 | 0.0845 |
| 5019 | OXCT1 | P1T-E | Human | Esophagus | ESCC | 6.56e-08 | 4.56e-01 | 0.0875 |
| 5019 | OXCT1 | P2T-E | Human | Esophagus | ESCC | 4.83e-21 | 4.25e-01 | 0.1177 |
| 5019 | OXCT1 | P4T-E | Human | Esophagus | ESCC | 7.46e-16 | 3.90e-01 | 0.1323 |
| 5019 | OXCT1 | P5T-E | Human | Esophagus | ESCC | 4.26e-12 | 1.95e-01 | 0.1327 |
| 5019 | OXCT1 | P8T-E | Human | Esophagus | ESCC | 3.60e-17 | 3.95e-01 | 0.0889 |
| 5019 | OXCT1 | P9T-E | Human | Esophagus | ESCC | 3.06e-07 | 1.20e-01 | 0.1131 |
| 5019 | OXCT1 | P10T-E | Human | Esophagus | ESCC | 2.34e-44 | 7.22e-01 | 0.116 |
| 5019 | OXCT1 | P11T-E | Human | Esophagus | ESCC | 2.43e-07 | 3.20e-01 | 0.1426 |
| 5019 | OXCT1 | P12T-E | Human | Esophagus | ESCC | 5.05e-23 | 4.03e-01 | 0.1122 |
| 5019 | OXCT1 | P15T-E | Human | Esophagus | ESCC | 1.56e-14 | 3.22e-01 | 0.1149 |
| 5019 | OXCT1 | P16T-E | Human | Esophagus | ESCC | 4.06e-27 | 4.51e-01 | 0.1153 |
| 5019 | OXCT1 | P17T-E | Human | Esophagus | ESCC | 9.99e-17 | 5.64e-01 | 0.1278 |
| 5019 | OXCT1 | P19T-E | Human | Esophagus | ESCC | 2.56e-04 | 3.36e-01 | 0.1662 |
| 5019 | OXCT1 | P20T-E | Human | Esophagus | ESCC | 2.88e-13 | 3.68e-01 | 0.1124 |
| 5019 | OXCT1 | P21T-E | Human | Esophagus | ESCC | 3.90e-23 | 4.36e-01 | 0.1617 |
| Page: 1 2 3 4 5 |
| Tissue | Expression Dynamics | Abbreviation |
| Esophagus | 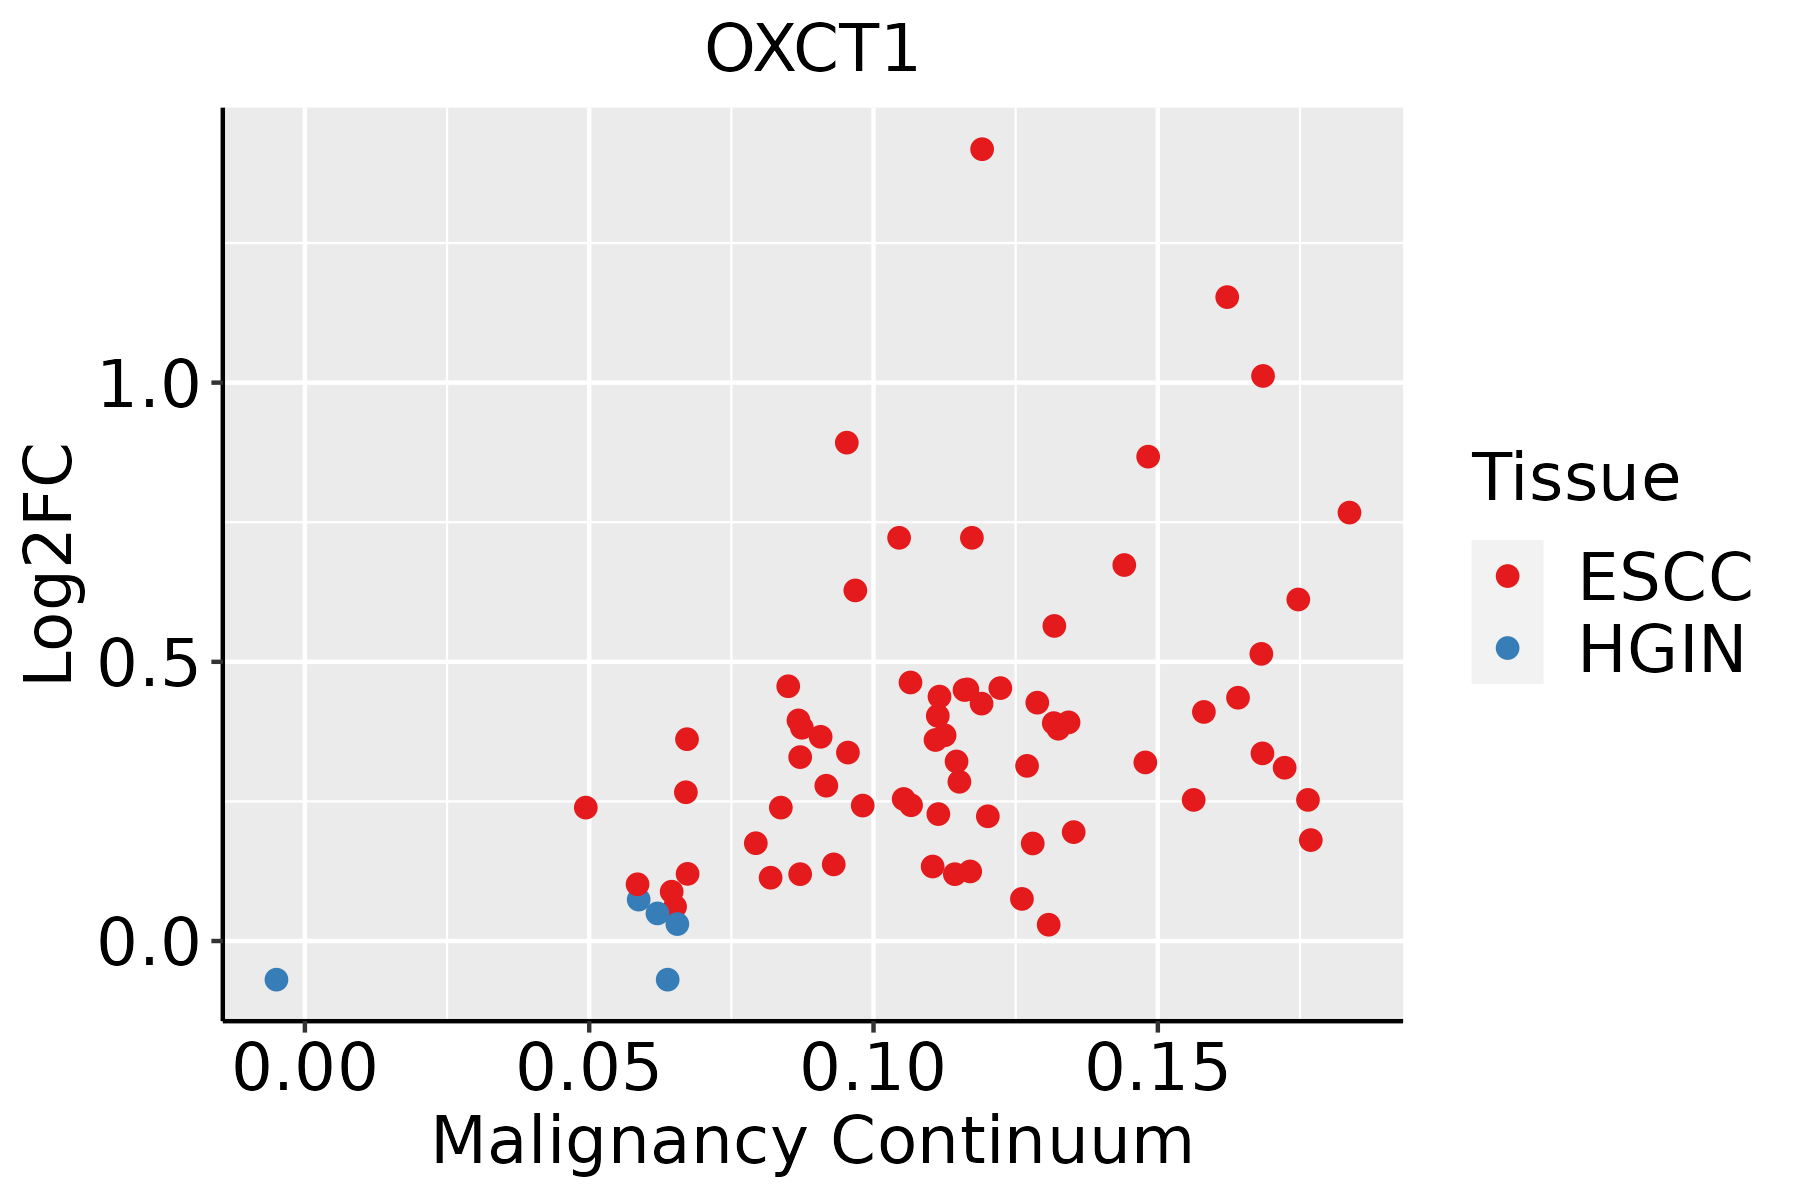 | ESCC: Esophageal squamous cell carcinoma |
| HGIN: High-grade intraepithelial neoplasias | ||
| LGIN: Low-grade intraepithelial neoplasias | ||
| Liver |  | HCC: Hepatocellular carcinoma |
| NAFLD: Non-alcoholic fatty liver disease | ||
| Oral Cavity | 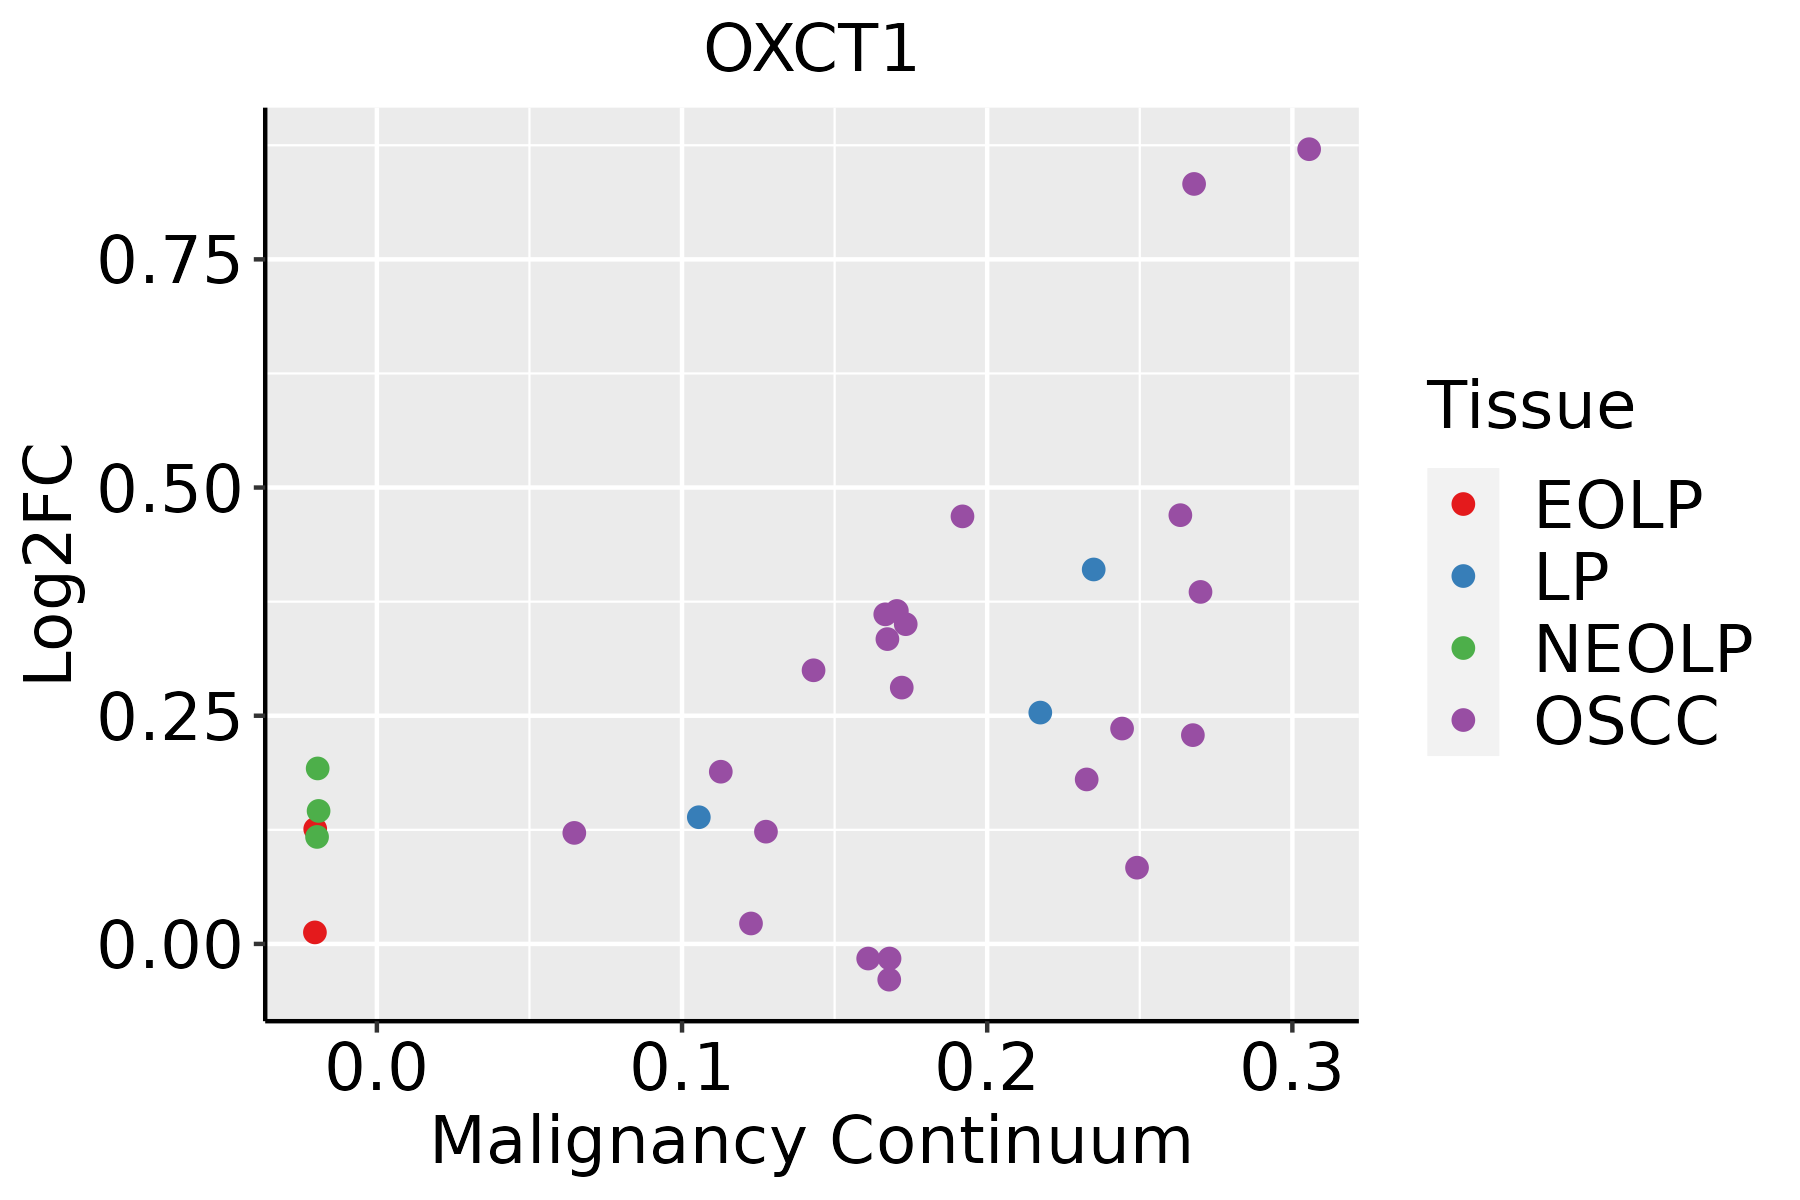 | EOLP: Erosive Oral lichen planus |
| LP: leukoplakia | ||
| NEOLP: Non-erosive oral lichen planus | ||
| OSCC: Oral squamous cell carcinoma | ||
| Skin | 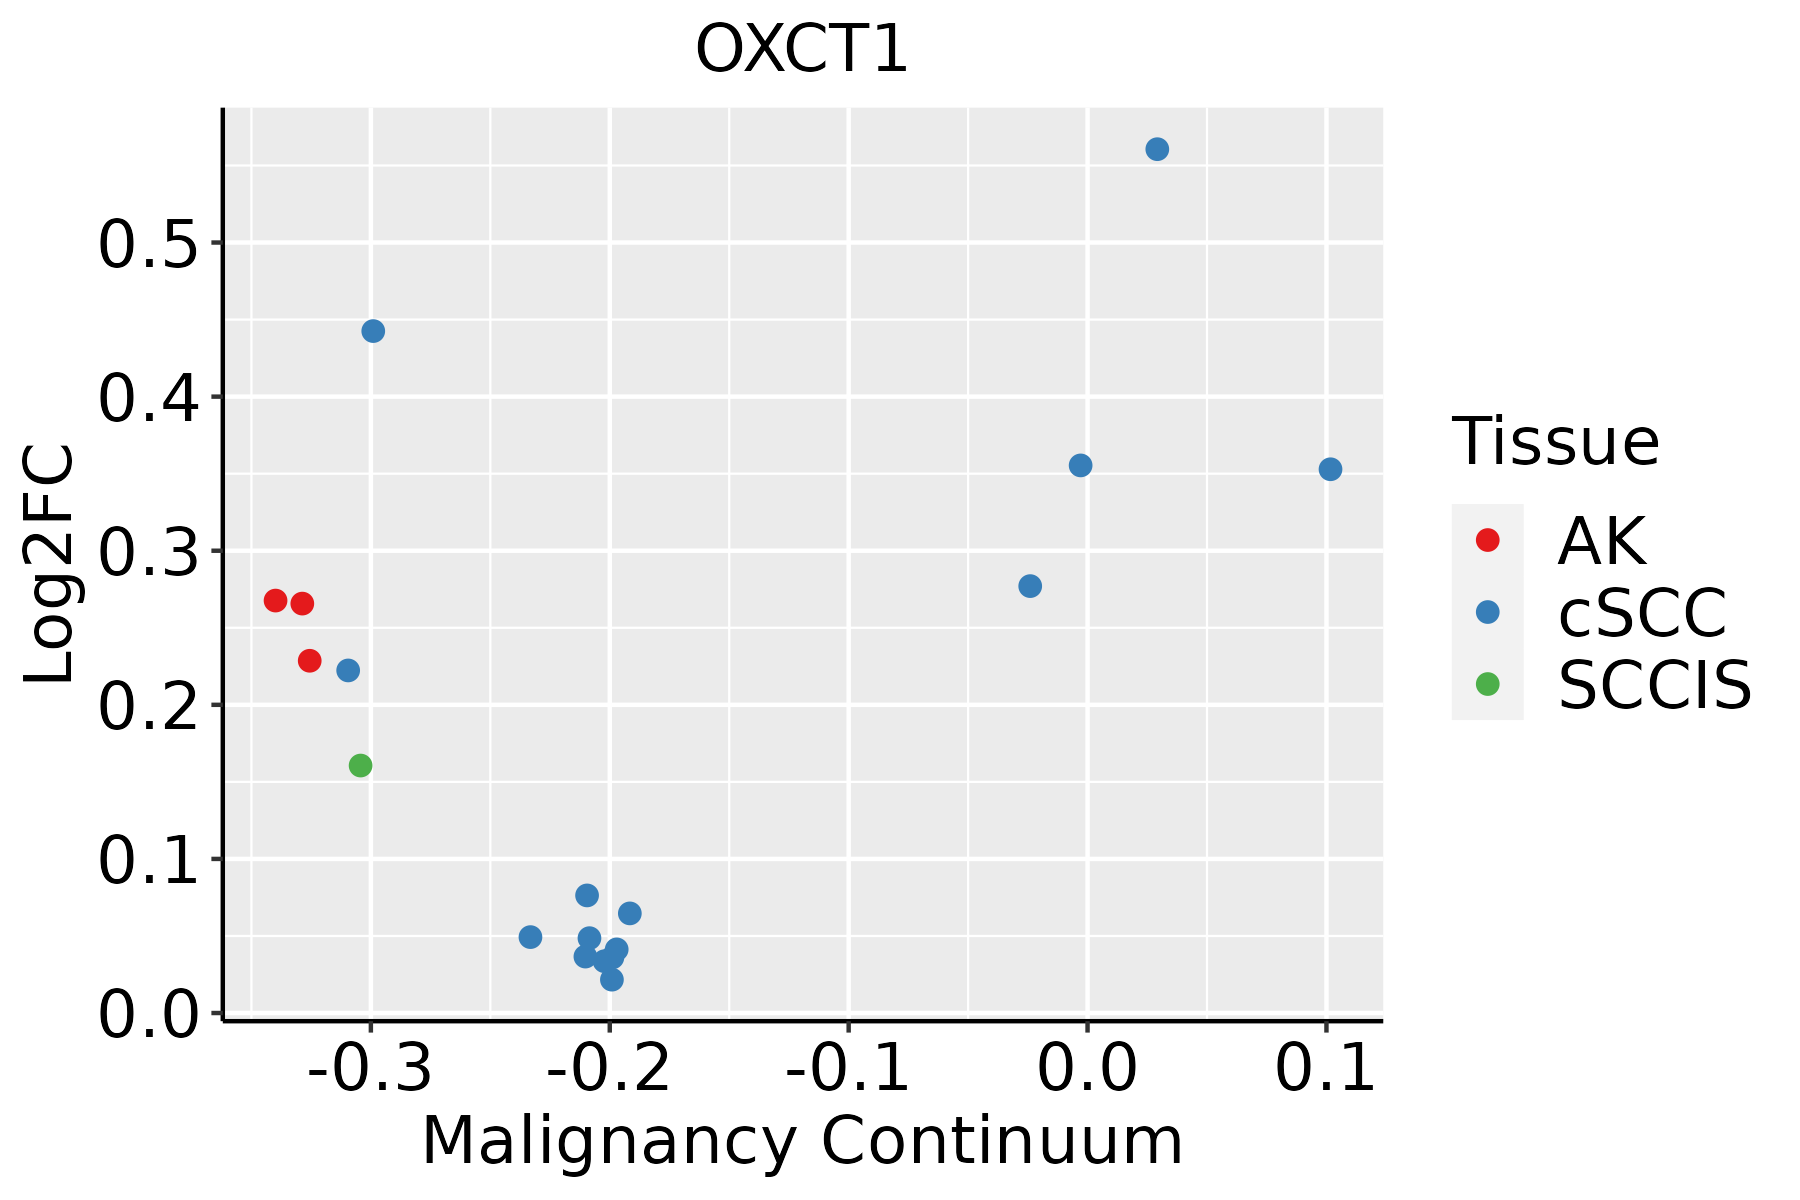 | AK: Actinic keratosis |
| cSCC: Cutaneous squamous cell carcinoma | ||
| SCCIS:squamous cell carcinoma in situ | ||
| Thyroid | 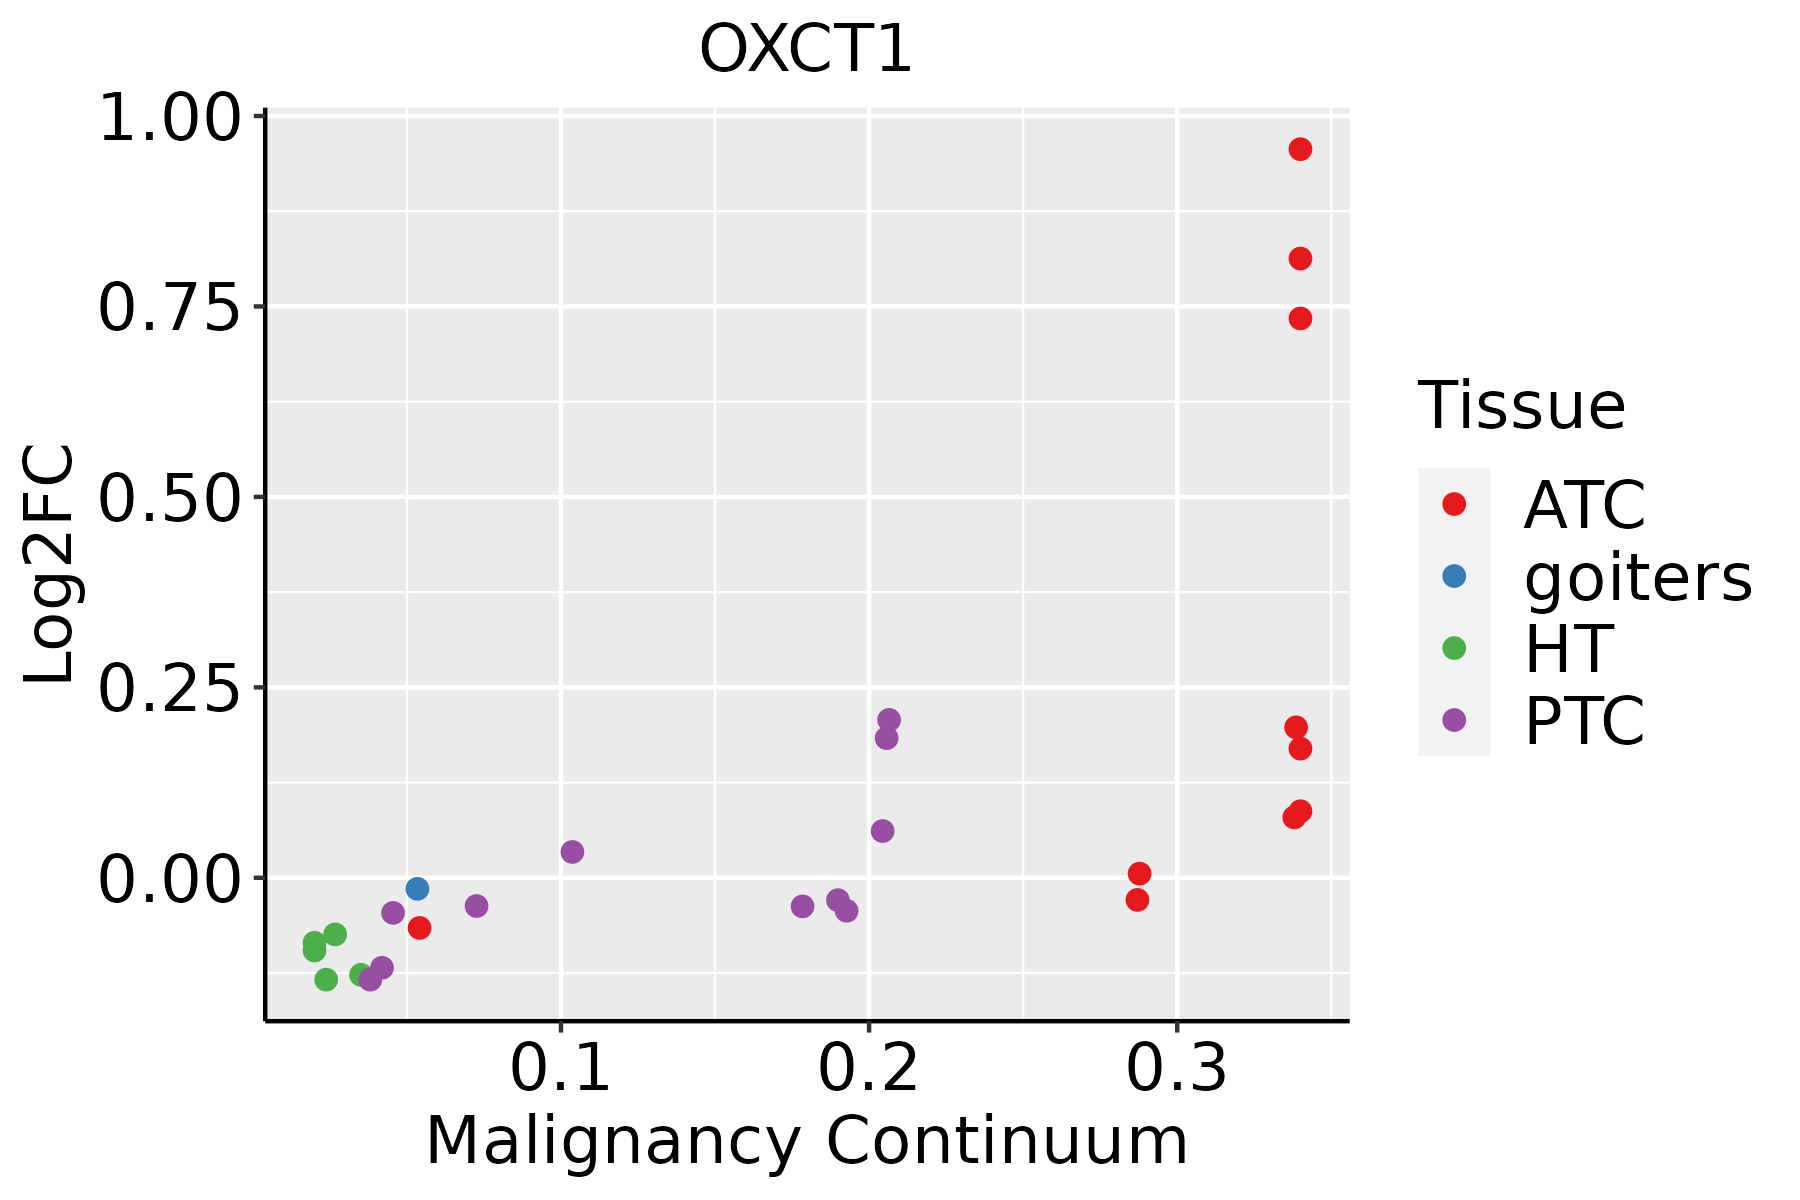 | ATC: Anaplastic thyroid cancer |
| HT: Hashimoto's thyroiditis | ||
| PTC: Papillary thyroid cancer |
| ∗log2FC in expression of this searched gene in stem-like cells from each diseased tissue sample relative to stem-like cells in normal samples in each tissue plotted against the malignancy continuum. Samples are colored based on if they are from different disease stage. |
Top |
Malignant transformation related pathway analysis |
| Find out the enriched GO biological processes and KEGG pathways involved in transition from healthy to precancer to cancer |
| Tissue | Disease Stage | Enriched GO biological Processes |
| Colorectum | AD |  |
| Colorectum | SER |  |
| Colorectum | MSS |  |
| Colorectum | MSI-H |  |
| Colorectum | FAP |  |
| ∗Top 15 enriched GO BP terms are showed in the bar plot of each disease state in each tissue. Each row represents a significant GO biological process which is colored according to the -log10(p.adjust). |
| Page: 1 2 3 4 5 6 7 8 9 |
| GO ID | Tissue | Disease Stage | Description | Gene Ratio | Bg Ratio | pvalue | p.adjust | Count |
| GO:003559212 | Liver | HCC | establishment of protein localization to extracellular region | 176/7958 | 360/18723 | 7.96e-03 | 3.15e-02 | 176 |
| GO:000930612 | Liver | HCC | protein secretion | 175/7958 | 359/18723 | 9.32e-03 | 3.57e-02 | 175 |
| GO:00611784 | Liver | HCC | regulation of insulin secretion involved in cellular response to glucose stimulus | 37/7958 | 64/18723 | 9.63e-03 | 3.63e-02 | 37 |
| GO:00454712 | Liver | HCC | response to ethanol | 72/7958 | 137/18723 | 1.10e-02 | 4.07e-02 | 72 |
| GO:000609118 | Oral cavity | OSCC | generation of precursor metabolites and energy | 286/7305 | 490/18723 | 1.45e-18 | 1.71e-16 | 286 |
| GO:190495119 | Oral cavity | OSCC | positive regulation of establishment of protein localization | 196/7305 | 319/18723 | 2.89e-16 | 2.20e-14 | 196 |
| GO:005122219 | Oral cavity | OSCC | positive regulation of protein transport | 187/7305 | 303/18723 | 7.37e-16 | 5.49e-14 | 187 |
| GO:003166720 | Oral cavity | OSCC | response to nutrient levels | 245/7305 | 474/18723 | 1.02e-08 | 2.10e-07 | 245 |
| GO:004259416 | Oral cavity | OSCC | response to starvation | 111/7305 | 197/18723 | 5.68e-07 | 8.19e-06 | 111 |
| GO:00075849 | Oral cavity | OSCC | response to nutrient | 95/7305 | 174/18723 | 2.09e-05 | 1.99e-04 | 95 |
| GO:00421804 | Oral cavity | OSCC | cellular ketone metabolic process | 111/7305 | 211/18723 | 3.94e-05 | 3.45e-04 | 111 |
| GO:000941018 | Oral cavity | OSCC | response to xenobiotic stimulus | 222/7305 | 462/18723 | 4.00e-05 | 3.48e-04 | 222 |
| GO:000974320 | Oral cavity | OSCC | response to carbohydrate | 128/7305 | 253/18723 | 1.11e-04 | 8.16e-04 | 128 |
| GO:009730519 | Oral cavity | OSCC | response to alcohol | 127/7305 | 253/18723 | 1.81e-04 | 1.24e-03 | 127 |
| GO:003428420 | Oral cavity | OSCC | response to monosaccharide | 114/7305 | 225/18723 | 2.37e-04 | 1.54e-03 | 114 |
| GO:007133316 | Oral cavity | OSCC | cellular response to glucose stimulus | 79/7305 | 151/18723 | 5.97e-04 | 3.39e-03 | 79 |
| GO:000974619 | Oral cavity | OSCC | response to hexose | 109/7305 | 219/18723 | 7.41e-04 | 4.05e-03 | 109 |
| GO:000167816 | Oral cavity | OSCC | cellular glucose homeostasis | 88/7305 | 172/18723 | 7.74e-04 | 4.22e-03 | 88 |
| GO:007133116 | Oral cavity | OSCC | cellular response to hexose stimulus | 79/7305 | 153/18723 | 9.92e-04 | 5.17e-03 | 79 |
| GO:000930610 | Oral cavity | OSCC | protein secretion | 169/7305 | 359/18723 | 1.04e-03 | 5.34e-03 | 169 |
| Page: 1 2 3 4 5 6 7 8 9 |
| Pathway ID | Tissue | Disease Stage | Description | Gene Ratio | Bg Ratio | pvalue | p.adjust | qvalue | Count |
| hsa002809 | Esophagus | ESCC | Valine, leucine and isoleucine degradation | 34/4205 | 48/8465 | 2.34e-03 | 6.54e-03 | 3.35e-03 | 34 |
| hsa0028014 | Esophagus | ESCC | Valine, leucine and isoleucine degradation | 34/4205 | 48/8465 | 2.34e-03 | 6.54e-03 | 3.35e-03 | 34 |
| hsa002808 | Oral cavity | OSCC | Valine, leucine and isoleucine degradation | 30/3704 | 48/8465 | 6.75e-03 | 1.57e-02 | 7.99e-03 | 30 |
| hsa0028013 | Oral cavity | OSCC | Valine, leucine and isoleucine degradation | 30/3704 | 48/8465 | 6.75e-03 | 1.57e-02 | 7.99e-03 | 30 |
| Page: 1 |
Top |
Cell-cell communication analysis |
| Identification of potential cell-cell interactions between two cell types and their ligand-receptor pairs for different disease states |
| Ligand | Receptor | LRpair | Pathway | Tissue | Disease Stage |
| Page: 1 |
Top |
Single-cell gene regulatory network inference analysis |
| Find out the significant the regulons (TFs) and the target genes of each regulon across cell types for different disease states |
| TF | Cell Type | Tissue | Disease Stage | Target Gene | RSS | Regulon Activity |
| ∗The dot plots of a searched regulon are shown for all cell subpopulations in each disease state of each tissue based on the regulon specific score inferred using pySCENIC and by calculating the average expression. |
| Page: 1 |
Top |
Somatic mutation of malignant transformation related genes |
| Annotation of somatic variants for genes involved in malignant transformation |
| Hugo Symbol | Variant Class | Variant Classification | dbSNP RS | HGVSc | HGVSp | HGVSp Short | SWISSPROT | BIOTYPE | SIFT | PolyPhen | Tumor Sample Barcode | Tissue | Histology | Sex | Age | Stage | Therapy Types | Drugs | Outcome |
| OXCT1 | SNV | Missense_Mutation | c.1497N>T | p.Gln499His | p.Q499H | P55809 | protein_coding | deleterious(0.03) | benign(0.001) | TCGA-AN-A046-01 | Breast | breast invasive carcinoma | Female | >=65 | I/II | Unknown | Unknown | SD | |
| OXCT1 | SNV | Missense_Mutation | c.1064N>A | p.Arg355Gln | p.R355Q | P55809 | protein_coding | tolerated(0.51) | benign(0.03) | TCGA-AN-A046-01 | Breast | breast invasive carcinoma | Female | >=65 | I/II | Unknown | Unknown | SD | |
| OXCT1 | SNV | Missense_Mutation | novel | c.1033N>C | p.Asn345His | p.N345H | P55809 | protein_coding | deleterious(0.02) | probably_damaging(0.999) | TCGA-AN-A046-01 | Breast | breast invasive carcinoma | Female | >=65 | I/II | Unknown | Unknown | SD |
| OXCT1 | SNV | Missense_Mutation | c.1551N>C | p.Gln517His | p.Q517H | P55809 | protein_coding | deleterious(0.03) | possibly_damaging(0.775) | TCGA-BH-A0HP-01 | Breast | breast invasive carcinoma | Female | >=65 | III/IV | Chemotherapy | doxorubicin | SD | |
| OXCT1 | SNV | Missense_Mutation | novel | c.1560T>G | p.Asn520Lys | p.N520K | P55809 | protein_coding | tolerated_low_confidence(0.06) | benign(0.006) | TCGA-OL-A5RY-01 | Breast | breast invasive carcinoma | Female | <65 | I/II | Unknown | Unknown | SD |
| OXCT1 | deletion | Frame_Shift_Del | novel | c.1139delN | p.Phe380SerfsTer9 | p.F380Sfs*9 | P55809 | protein_coding | TCGA-D8-A27V-01 | Breast | breast invasive carcinoma | Female | <65 | I/II | Hormone Therapy | tamoxiphen | SD | ||
| OXCT1 | SNV | Missense_Mutation | novel | c.1490A>G | p.Asp497Gly | p.D497G | P55809 | protein_coding | deleterious(0) | possibly_damaging(0.866) | TCGA-EA-A410-01 | Cervix | cervical & endocervical cancer | Female | <65 | I/II | Unknown | Unknown | SD |
| OXCT1 | SNV | Missense_Mutation | novel | c.94T>C | p.Phe32Leu | p.F32L | P55809 | protein_coding | tolerated(0.13) | benign(0.012) | TCGA-VS-A953-01 | Cervix | cervical & endocervical cancer | Female | <65 | I/II | Unknown | Unknown | PD |
| OXCT1 | SNV | Missense_Mutation | rs766119402 | c.854N>A | p.Arg285Gln | p.R285Q | P55809 | protein_coding | tolerated(0.21) | benign(0.003) | TCGA-AA-3947-01 | Colorectum | colon adenocarcinoma | Female | <65 | I/II | Unknown | Unknown | SD |
| OXCT1 | SNV | Missense_Mutation | c.1254G>C | p.Lys418Asn | p.K418N | P55809 | protein_coding | deleterious(0) | probably_damaging(0.977) | TCGA-AA-3955-01 | Colorectum | colon adenocarcinoma | Male | <65 | III/IV | Chemotherapy | capecitabine | CR |
| Page: 1 2 3 4 5 6 7 8 |
Top |
Related drugs of malignant transformation related genes |
| Identification of chemicals and drugs interact with genes involved in malignant transfromation |
| (DGIdb 4.0) |
| Entrez ID | Symbol | Category | Interaction Types | Drug Claim Name | Drug Name | PMIDs |
| Page: 1 |

Copyright 2023-Present -The University of Texas Health Science Center at Houston |