
|
|||||
|
 | |
| |
| |
| |
| |
| |
|
Gene: OVOL1 |
Gene summary for OVOL1 |
| Gene information | Species | Human | Gene symbol | OVOL1 | Gene ID | 5017 |
| Gene name | ovo like transcriptional repressor 1 | |
| Gene Alias | HOVO1 | |
| Cytomap | 11q13.1 | |
| Gene Type | protein-coding | GO ID | GO:0000003 | UniProtAcc | O14753 |
Top |
Malignant transformation analysis |
| Identification of the aberrant gene expression in precancerous and cancerous lesions by comparing the gene expression of stem-like cells in diseased tissues with normal stem cells |
| Entrez ID | Symbol | Replicates | Species | Organ | Tissue | Adj P-value | Log2FC | Malignancy |
| 5017 | OVOL1 | LZE8T | Human | Esophagus | ESCC | 3.47e-08 | 1.73e-01 | 0.067 |
| 5017 | OVOL1 | LZE20T | Human | Esophagus | ESCC | 1.18e-08 | 1.11e+00 | 0.0662 |
| 5017 | OVOL1 | LZE24T | Human | Esophagus | ESCC | 2.50e-03 | 5.96e-01 | 0.0596 |
| 5017 | OVOL1 | P1T-E | Human | Esophagus | ESCC | 9.30e-04 | 7.56e-01 | 0.0875 |
| 5017 | OVOL1 | P2T-E | Human | Esophagus | ESCC | 1.78e-04 | 3.65e-02 | 0.1177 |
| 5017 | OVOL1 | P4T-E | Human | Esophagus | ESCC | 4.20e-11 | 8.04e-01 | 0.1323 |
| 5017 | OVOL1 | P5T-E | Human | Esophagus | ESCC | 1.70e-06 | 3.42e-01 | 0.1327 |
| 5017 | OVOL1 | P8T-E | Human | Esophagus | ESCC | 4.27e-04 | 9.61e-02 | 0.0889 |
| 5017 | OVOL1 | P9T-E | Human | Esophagus | ESCC | 1.60e-03 | -5.03e-02 | 0.1131 |
| 5017 | OVOL1 | P11T-E | Human | Esophagus | ESCC | 1.81e-06 | 9.45e-01 | 0.1426 |
| 5017 | OVOL1 | P12T-E | Human | Esophagus | ESCC | 4.07e-10 | 5.58e-01 | 0.1122 |
| 5017 | OVOL1 | P20T-E | Human | Esophagus | ESCC | 2.45e-02 | 5.97e-01 | 0.1124 |
| 5017 | OVOL1 | P21T-E | Human | Esophagus | ESCC | 5.86e-11 | 6.91e-01 | 0.1617 |
| 5017 | OVOL1 | P22T-E | Human | Esophagus | ESCC | 7.63e-03 | 5.10e-02 | 0.1236 |
| 5017 | OVOL1 | P23T-E | Human | Esophagus | ESCC | 2.00e-08 | 9.42e-01 | 0.108 |
| 5017 | OVOL1 | P26T-E | Human | Esophagus | ESCC | 2.15e-15 | 4.28e-01 | 0.1276 |
| 5017 | OVOL1 | P27T-E | Human | Esophagus | ESCC | 4.00e-08 | 5.30e-01 | 0.1055 |
| 5017 | OVOL1 | P28T-E | Human | Esophagus | ESCC | 1.88e-54 | 1.66e+00 | 0.1149 |
| 5017 | OVOL1 | P31T-E | Human | Esophagus | ESCC | 1.21e-21 | 9.80e-01 | 0.1251 |
| 5017 | OVOL1 | P38T-E | Human | Esophagus | ESCC | 1.48e-03 | 3.47e-01 | 0.127 |
| Page: 1 2 3 4 |
| Tissue | Expression Dynamics | Abbreviation |
| Esophagus |  | ESCC: Esophageal squamous cell carcinoma |
| HGIN: High-grade intraepithelial neoplasias | ||
| LGIN: Low-grade intraepithelial neoplasias | ||
| Oral Cavity | 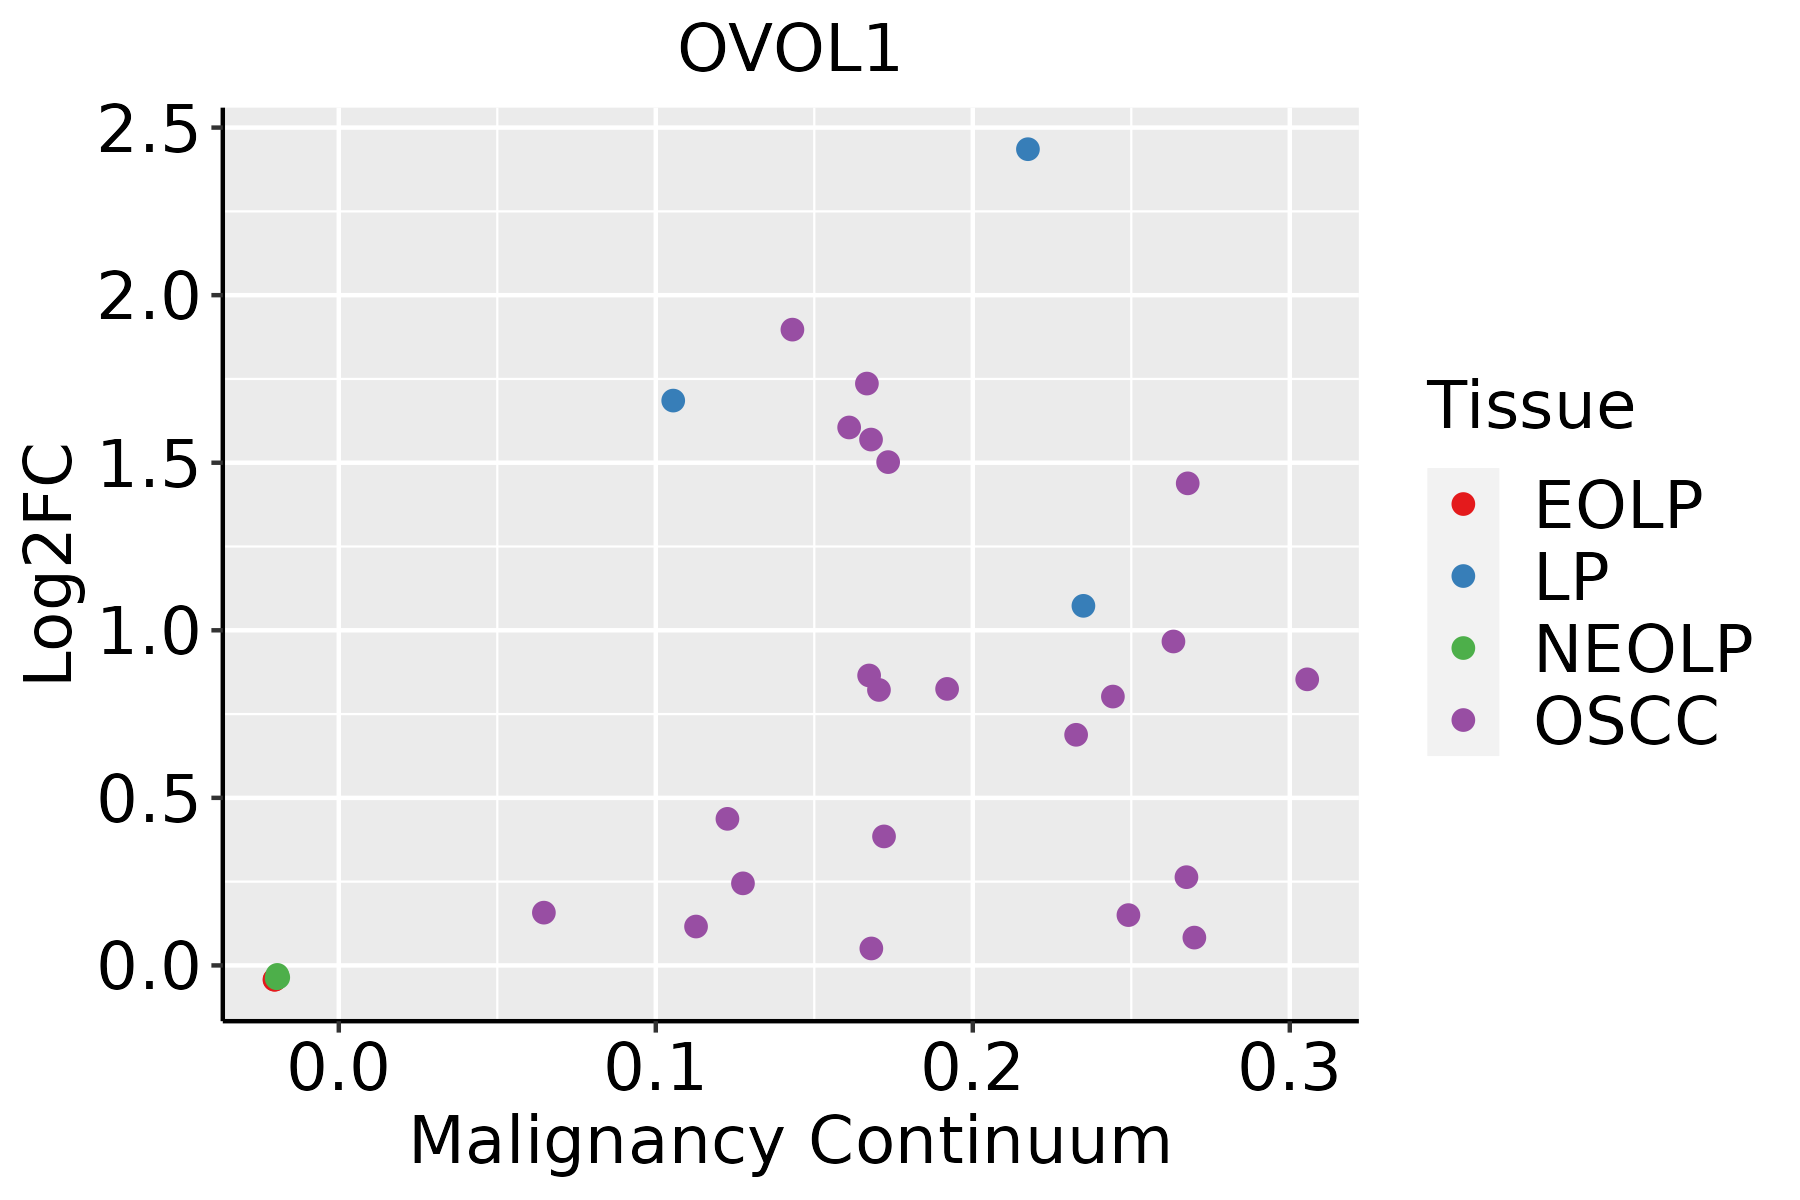 | EOLP: Erosive Oral lichen planus |
| LP: leukoplakia | ||
| NEOLP: Non-erosive oral lichen planus | ||
| OSCC: Oral squamous cell carcinoma | ||
| Skin |  | AK: Actinic keratosis |
| cSCC: Cutaneous squamous cell carcinoma | ||
| SCCIS:squamous cell carcinoma in situ |
| ∗log2FC in expression of this searched gene in stem-like cells from each diseased tissue sample relative to stem-like cells in normal samples in each tissue plotted against the malignancy continuum. Samples are colored based on if they are from different disease stage. |
Top |
Malignant transformation related pathway analysis |
| Find out the enriched GO biological processes and KEGG pathways involved in transition from healthy to precancer to cancer |
| Tissue | Disease Stage | Enriched GO biological Processes |
| Colorectum | AD |  |
| Colorectum | SER |  |
| Colorectum | MSS |  |
| Colorectum | MSI-H |  |
| Colorectum | FAP |  |
| ∗Top 15 enriched GO BP terms are showed in the bar plot of each disease state in each tissue. Each row represents a significant GO biological process which is colored according to the -log10(p.adjust). |
| Page: 1 2 3 4 5 6 7 8 9 |
| GO ID | Tissue | Disease Stage | Description | Gene Ratio | Bg Ratio | pvalue | p.adjust | Count |
| GO:000165510 | Skin | AK | urogenital system development | 54/1910 | 338/18723 | 5.86e-04 | 5.20e-03 | 54 |
| GO:19019884 | Skin | AK | negative regulation of cell cycle phase transition | 42/1910 | 249/18723 | 7.65e-04 | 6.39e-03 | 42 |
| GO:0007498 | Skin | AK | mesoderm development | 25/1910 | 129/18723 | 1.21e-03 | 9.28e-03 | 25 |
| GO:00018227 | Skin | AK | kidney development | 45/1910 | 293/18723 | 3.50e-03 | 2.12e-02 | 45 |
| GO:00109485 | Skin | AK | negative regulation of cell cycle process | 45/1910 | 294/18723 | 3.73e-03 | 2.22e-02 | 45 |
| GO:00720018 | Skin | AK | renal system development | 45/1910 | 302/18723 | 6.14e-03 | 3.31e-02 | 45 |
| GO:000734617 | Skin | cSCC | regulation of mitotic cell cycle | 192/4864 | 457/18723 | 3.47e-14 | 2.31e-12 | 192 |
| GO:004358823 | Skin | cSCC | skin development | 111/4864 | 263/18723 | 6.35e-09 | 2.10e-07 | 111 |
| GO:000854425 | Skin | cSCC | epidermis development | 131/4864 | 324/18723 | 7.38e-09 | 2.39e-07 | 131 |
| GO:190198714 | Skin | cSCC | regulation of cell cycle phase transition | 150/4864 | 390/18723 | 3.21e-08 | 8.61e-07 | 150 |
| GO:004578717 | Skin | cSCC | positive regulation of cell cycle | 120/4864 | 313/18723 | 8.95e-07 | 1.64e-05 | 120 |
| GO:004593014 | Skin | cSCC | negative regulation of mitotic cell cycle | 93/4864 | 235/18723 | 3.14e-06 | 4.89e-05 | 93 |
| GO:004578613 | Skin | cSCC | negative regulation of cell cycle | 140/4864 | 385/18723 | 3.64e-06 | 5.50e-05 | 140 |
| GO:190198812 | Skin | cSCC | negative regulation of cell cycle phase transition | 94/4864 | 249/18723 | 2.65e-05 | 3.00e-04 | 94 |
| GO:001094812 | Skin | cSCC | negative regulation of cell cycle process | 108/4864 | 294/18723 | 2.75e-05 | 3.09e-04 | 108 |
| GO:000991324 | Skin | cSCC | epidermal cell differentiation | 78/4864 | 202/18723 | 5.12e-05 | 5.28e-04 | 78 |
| Page: 1 2 3 |
| Pathway ID | Tissue | Disease Stage | Description | Gene Ratio | Bg Ratio | pvalue | p.adjust | qvalue | Count |
| Page: 1 |
Top |
Cell-cell communication analysis |
| Identification of potential cell-cell interactions between two cell types and their ligand-receptor pairs for different disease states |
| Ligand | Receptor | LRpair | Pathway | Tissue | Disease Stage |
| Page: 1 |
Top |
Single-cell gene regulatory network inference analysis |
| Find out the significant the regulons (TFs) and the target genes of each regulon across cell types for different disease states |
| TF | Cell Type | Tissue | Disease Stage | Target Gene | RSS | Regulon Activity |
| OVOL1 | INCAF | Prostate | ADJ | OAS1,EPS8L1,ARL17B, etc. | 3.16e-02 |  |
| OVOL1 | INFIB | Prostate | Healthy | OAS1,EPS8L1,ARL17B, etc. | 1.89e-01 |  |
| OVOL1 | BAS | Skin | Healthy | ZNF750,CLDN4,RHOV, etc. | 2.11e-01 |  |
| ∗The dot plots of a searched regulon are shown for all cell subpopulations in each disease state of each tissue based on the regulon specific score inferred using pySCENIC and by calculating the average expression. |
| Page: 1 |
Top |
Somatic mutation of malignant transformation related genes |
| Annotation of somatic variants for genes involved in malignant transformation |
| Hugo Symbol | Variant Class | Variant Classification | dbSNP RS | HGVSc | HGVSp | HGVSp Short | SWISSPROT | BIOTYPE | SIFT | PolyPhen | Tumor Sample Barcode | Tissue | Histology | Sex | Age | Stage | Therapy Types | Drugs | Outcome |
| OVOL1 | SNV | Missense_Mutation | novel | c.625C>T | p.Arg209Trp | p.R209W | O14753 | protein_coding | deleterious(0) | probably_damaging(1) | TCGA-DS-A1OB-01 | Cervix | cervical & endocervical cancer | Female | <65 | I/II | Chemotherapy | carboplatin | PD |
| OVOL1 | SNV | Missense_Mutation | novel | c.256N>C | p.Asp86His | p.D86H | O14753 | protein_coding | tolerated(0.18) | benign(0.003) | TCGA-VS-A94X-01 | Cervix | cervical & endocervical cancer | Female | <65 | I/II | Chemotherapy | cisplatin | PD |
| OVOL1 | SNV | Missense_Mutation | novel | c.727C>T | p.Arg243Cys | p.R243C | O14753 | protein_coding | deleterious(0) | possibly_damaging(0.818) | TCGA-AA-A00N-01 | Colorectum | colon adenocarcinoma | Male | >=65 | I/II | Unknown | Unknown | PD |
| OVOL1 | SNV | Missense_Mutation | rs774919756 | c.593G>A | p.Gly198Asp | p.G198D | O14753 | protein_coding | deleterious(0) | probably_damaging(0.948) | TCGA-AA-A022-01 | Colorectum | colon adenocarcinoma | Female | >=65 | I/II | Unknown | Unknown | SD |
| OVOL1 | SNV | Missense_Mutation | rs199678307 | c.391C>T | p.Arg131Cys | p.R131C | O14753 | protein_coding | deleterious(0) | probably_damaging(0.999) | TCGA-CK-4951-01 | Colorectum | colon adenocarcinoma | Female | >=65 | I/II | Unknown | Unknown | PD |
| OVOL1 | SNV | Missense_Mutation | c.119C>T | p.Pro40Leu | p.P40L | O14753 | protein_coding | tolerated(0.16) | probably_damaging(0.994) | TCGA-G4-6628-01 | Colorectum | colon adenocarcinoma | Male | >=65 | I/II | Unknown | Unknown | SD | |
| OVOL1 | SNV | Missense_Mutation | novel | c.223N>A | p.Gly75Arg | p.G75R | O14753 | protein_coding | tolerated(0.09) | benign(0.068) | TCGA-AF-2691-01 | Colorectum | rectum adenocarcinoma | Female | <65 | I/II | Unknown | Unknown | SD |
| OVOL1 | SNV | Missense_Mutation | novel | c.625N>T | p.Arg209Trp | p.R209W | O14753 | protein_coding | deleterious(0) | probably_damaging(1) | TCGA-A5-A2K5-01 | Endometrium | uterine corpus endometrioid carcinoma | Female | >=65 | I/II | Unknown | Unknown | SD |
| OVOL1 | SNV | Missense_Mutation | rs577150616 | c.427N>A | p.Val143Ile | p.V143I | O14753 | protein_coding | deleterious(0.04) | benign(0.061) | TCGA-AX-A1C9-01 | Endometrium | uterine corpus endometrioid carcinoma | Female | >=65 | I/II | Unknown | Unknown | SD |
| OVOL1 | SNV | Missense_Mutation | novel | c.223N>A | p.Gly75Arg | p.G75R | O14753 | protein_coding | tolerated(0.09) | benign(0.068) | TCGA-AX-A2HD-01 | Endometrium | uterine corpus endometrioid carcinoma | Female | >=65 | III/IV | Unknown | Unknown | SD |
| Page: 1 2 3 |
Top |
Related drugs of malignant transformation related genes |
| Identification of chemicals and drugs interact with genes involved in malignant transfromation |
| (DGIdb 4.0) |
| Entrez ID | Symbol | Category | Interaction Types | Drug Claim Name | Drug Name | PMIDs |
| Page: 1 |

Copyright 2023-Present -The University of Texas Health Science Center at Houston |