Schematic overview of the cellular and molecular mechanisms involved in the cancer progression, including the proposed cellular and molecular mechanisms in cancer cells trajectory. AT1: alveolar type 1 cells; AT2: alveolar type 2 cells; AAH: atypical adenomatous hyperplasia; AIS: adenocarcinoma in situ; MIA: minimally invasive adenocarcinoma; IA: invasive adenocarcinoma; EMT: epithelial-mesenchymal transition

Home

Download

Statistics

Help

Contact

Center for Computational Systems Medicine
leaf

Gene summary

leaf

Malignant transformation analysis

leaf

Malignant transformation related pathway analysis

leaf

Cell-cell communication analysis

leaf

Single-cell gene regulatory network inference analysis

leaf

Somatic mutation of malignant transformation related genes

leaf

Related drugs of malignant transformation related genes

Gene: OSR2

Gene summary for OSR2

check button Gene summary.

Gene informationSpeciesHuman
Gene symbol

OSR2

Gene ID

116039

Gene nameodd-skipped related transciption factor 2
Gene AliasOSR2
Cytomap8q22.2
Gene Typeprotein-coding
GO ID

GO:0000122

UniProtAcc

Q8N2R0


Top

Malignant transformation analysis

check button Identification of the aberrant gene expression in precancerous and cancerous lesions by comparing the gene expression of stem-like cells in diseased tissues with normal stem cells
check button Malignant transformation involving gene list.
Entrez IDSymbolReplicatesSpeciesOrganTissueAdj P-valueLog2FCMalignancy
116039OSR2AEH-subject1HumanEndometriumAEH9.80e-32-6.48e-01-0.3059
116039OSR2AEH-subject2HumanEndometriumAEH4.31e-25-6.14e-01-0.2525
116039OSR2AEH-subject3HumanEndometriumAEH2.47e-27-6.26e-01-0.2576
116039OSR2AEH-subject4HumanEndometriumAEH1.02e-15-5.75e-01-0.2657
116039OSR2AEH-subject5HumanEndometriumAEH2.10e-32-6.72e-01-0.2953
116039OSR2EEC-subject1HumanEndometriumEEC1.55e-31-6.58e-01-0.2682
116039OSR2EEC-subject2HumanEndometriumEEC9.75e-31-6.65e-01-0.2607
116039OSR2EEC-subject3HumanEndometriumEEC1.22e-35-6.51e-01-0.2525
116039OSR2EEC-subject4HumanEndometriumEEC4.33e-29-6.17e-01-0.2571
116039OSR2EEC-subject5HumanEndometriumEEC7.41e-35-6.72e-01-0.249
116039OSR2GSM5276934HumanEndometriumEEC3.33e-30-6.35e-01-0.0913
116039OSR2GSM5276935HumanEndometriumEEC5.94e-34-6.73e-01-0.123
116039OSR2GSM5276937HumanEndometriumEEC1.10e-20-5.97e-01-0.0897
116039OSR2GSM6177620_NYU_UCEC1_lib1_lib1HumanEndometriumEEC5.48e-25-6.26e-01-0.1869
116039OSR2GSM6177620_NYU_UCEC1_lib2_lib2HumanEndometriumEEC2.55e-28-6.83e-01-0.1875
116039OSR2GSM6177620_NYU_UCEC1_lib3_lib3HumanEndometriumEEC3.77e-28-6.35e-01-0.1883
116039OSR2GSM6177621_NYU_UCEC2_lib1_lib1HumanEndometriumEEC3.55e-35-6.74e-01-0.1934
116039OSR2GSM6177622_NYU_UCEC3_lib1_lib1HumanEndometriumEEC1.40e-37-6.73e-01-0.1917
116039OSR2GSM6177622_NYU_UCEC3_lib2_lib2HumanEndometriumEEC2.62e-39-6.70e-01-0.1916
116039OSR2GSM6177623_NYU_UCEC3_VisHumanEndometriumEEC2.81e-07-4.42e-01-0.1269
Page: 1 2 3 4 

check button Transcriptomic changes along malignancy continuum.
TissueExpression DynamicsAbbreviation
EndometriumThe image shows the transcriptomic changes along malignancy continuum.log2FC in expression of this searched gene in stem-like cells from each diseased tissue sample relative to stem-like cells in normal samples in each tissue plotted against the malignancy continuum. Samples are colored based on if they are from different disease stage.
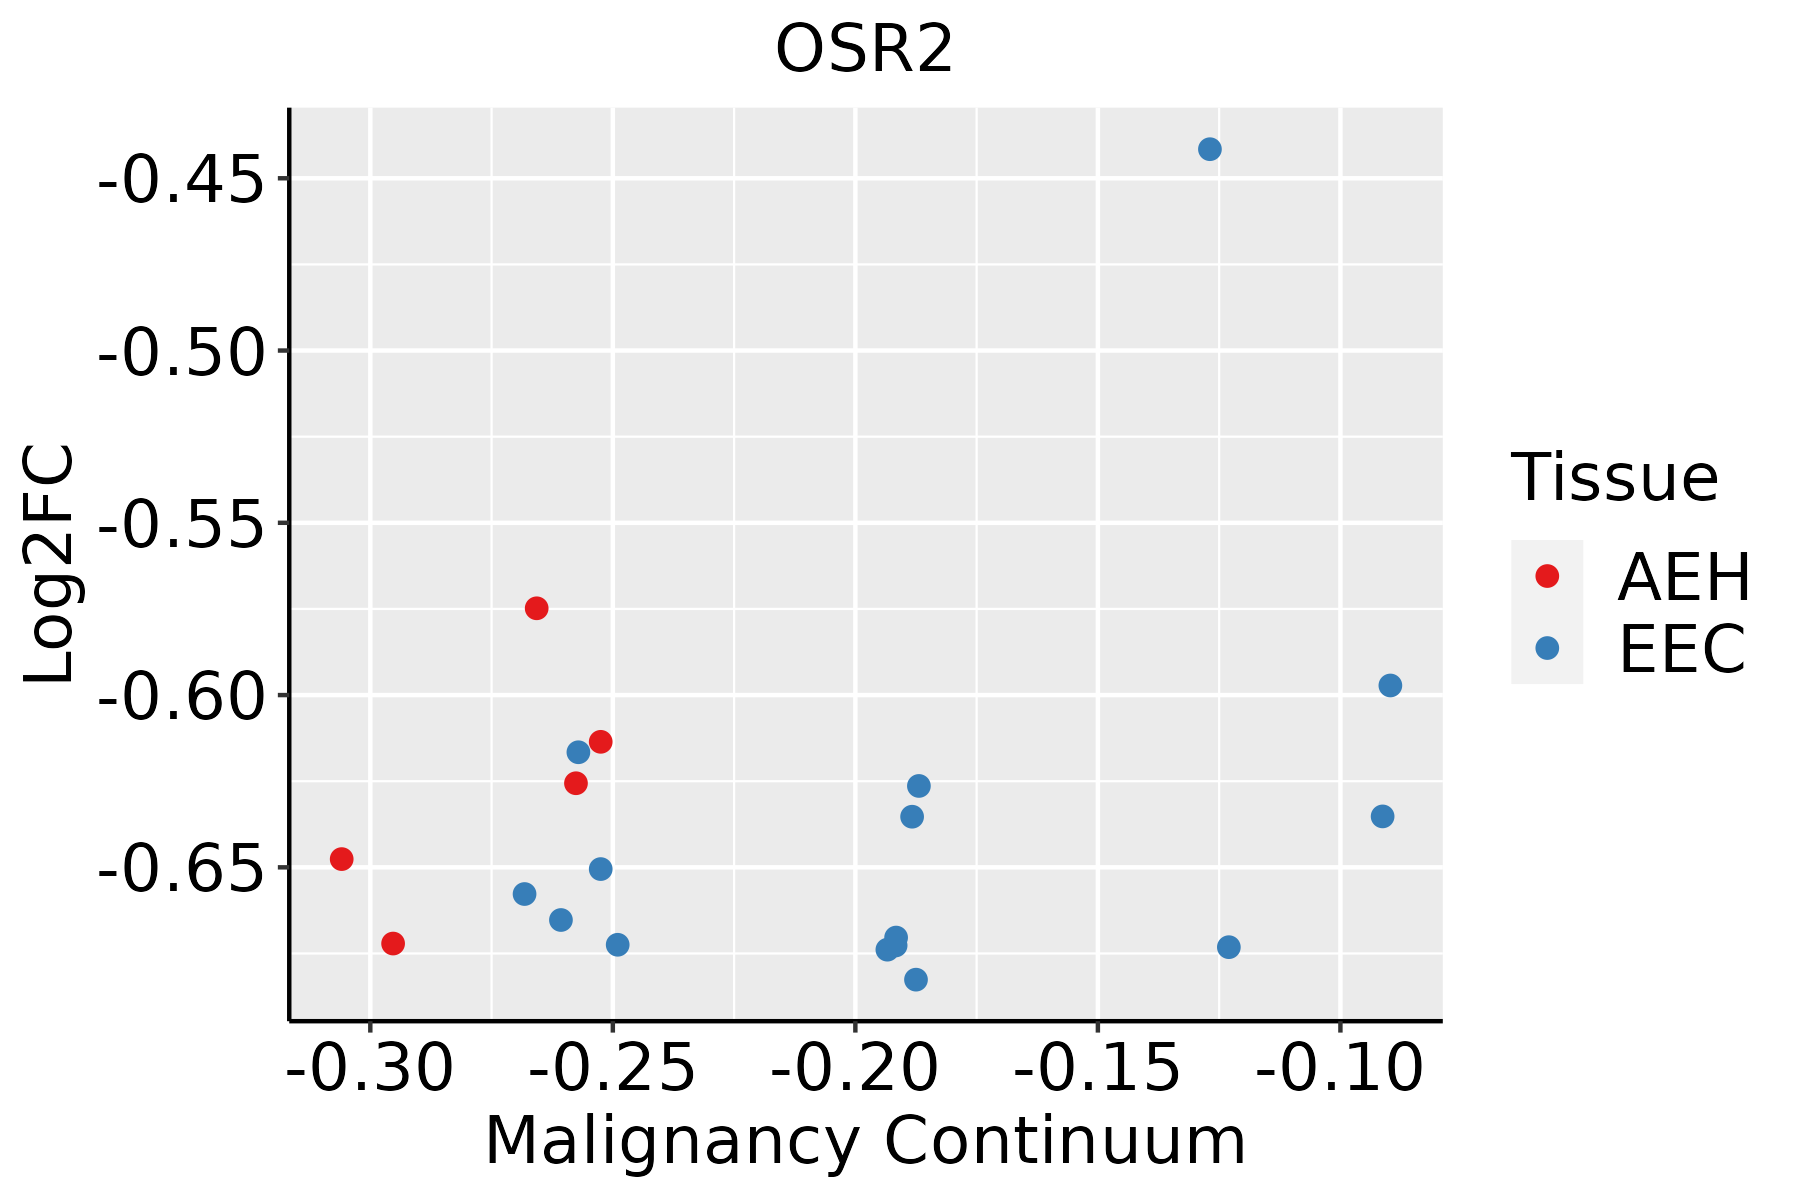
AEH: Atypical endometrial hyperplasia
EEC: Endometrioid Cancer
EsophagusThe image shows the transcriptomic changes along malignancy continuum.log2FC in expression of this searched gene in stem-like cells from each diseased tissue sample relative to stem-like cells in normal samples in each tissue plotted against the malignancy continuum. Samples are colored based on if they are from different disease stage.
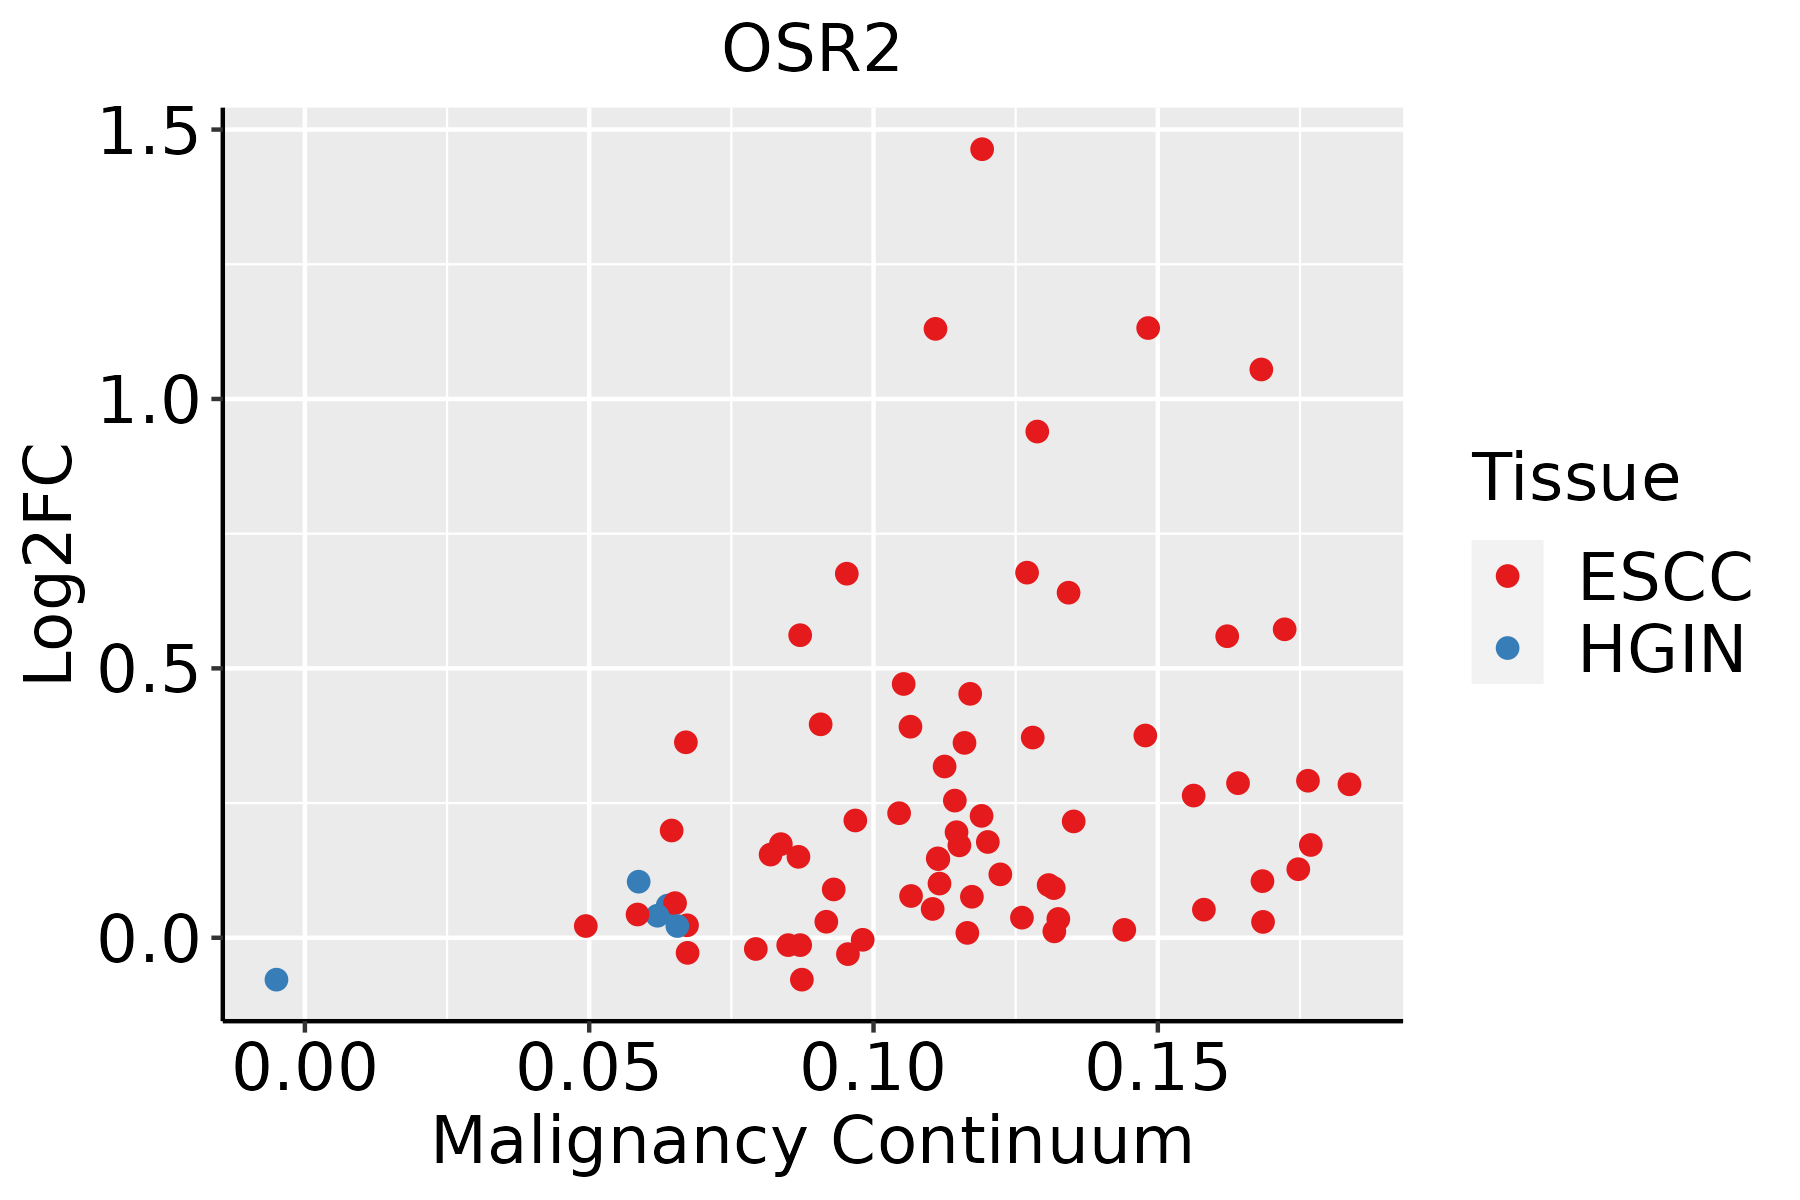
ESCC: Esophageal squamous cell carcinoma
HGIN: High-grade intraepithelial neoplasias
LGIN: Low-grade intraepithelial neoplasias
LiverThe image shows the transcriptomic changes along malignancy continuum.log2FC in expression of this searched gene in stem-like cells from each diseased tissue sample relative to stem-like cells in normal samples in each tissue plotted against the malignancy continuum. Samples are colored based on if they are from different disease stage.
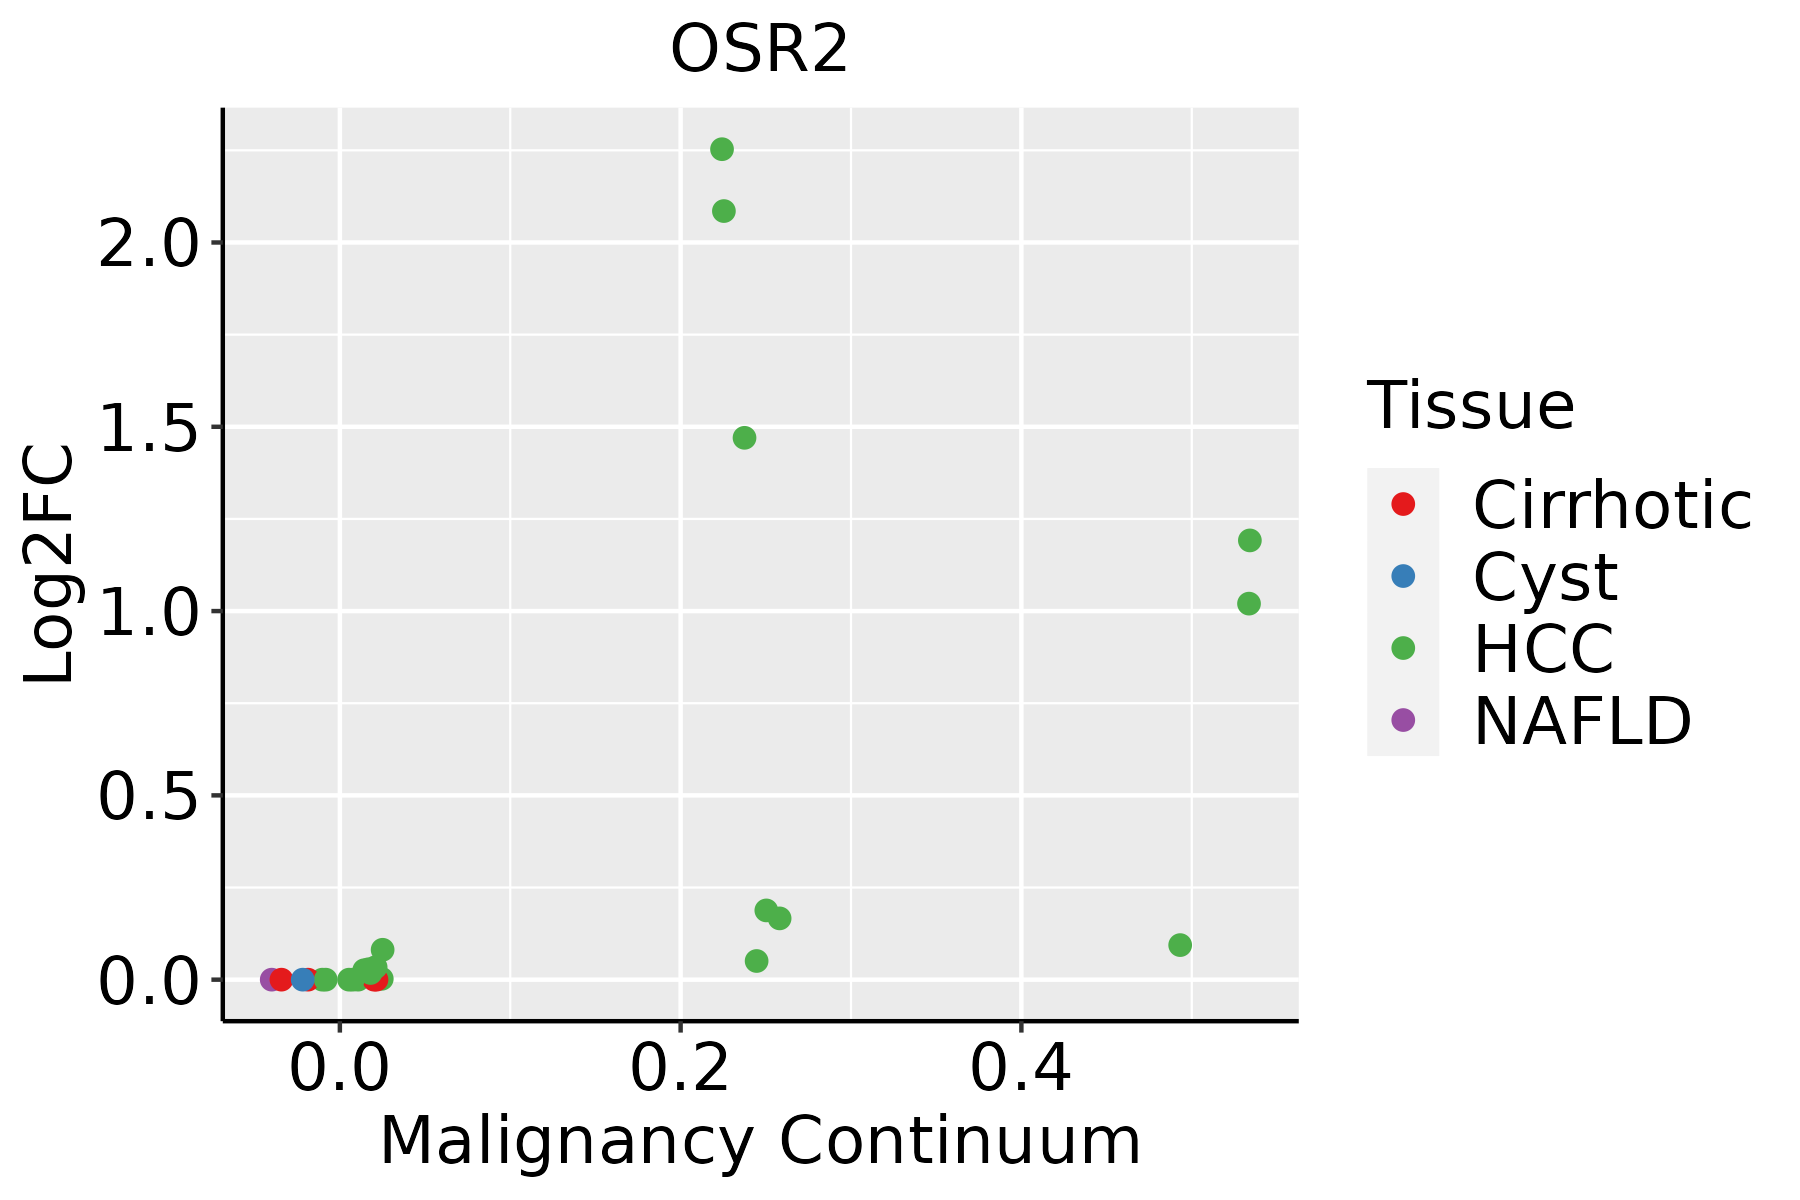
HCC: Hepatocellular carcinoma
NAFLD: Non-alcoholic fatty liver disease
Oral CavityThe image shows the transcriptomic changes along malignancy continuum.log2FC in expression of this searched gene in stem-like cells from each diseased tissue sample relative to stem-like cells in normal samples in each tissue plotted against the malignancy continuum. Samples are colored based on if they are from different disease stage.EOLP: Erosive Oral lichen planus
LP: leukoplakia
NEOLP: Non-erosive oral lichen planus
OSCC: Oral squamous cell carcinoma
∗log2FC in expression of this searched gene in stem-like cells from each diseased tissue sample relative to stem-like cells in normal samples in each tissue plotted against the malignancy continuum. Samples are colored based on if they are from different disease stage.

Top

Malignant transformation related pathway analysis

check buttonFind out the enriched GO biological processes and KEGG pathways involved in transition from healthy to precancer to cancer
check button Figure of enriched GO biological processes.
TissueDisease StageEnriched GO biological Processes
ColorectumADGO analysis - Figure of enriched GO biological processes: Top 15 enriched GO BP terms are showed in the bar plot of each disease state in each tissue. Each row represents a significant GO biological process which is colored according to the -log10(p.adjust).
ColorectumSERGO analysis - Figure of enriched GO biological processes: Top 15 enriched GO BP terms are showed in the bar plot of each disease state in each tissue. Each row represents a significant GO biological process which is colored according to the -log10(p.adjust).
ColorectumMSSGO analysis - Figure of enriched GO biological processes: Top 15 enriched GO BP terms are showed in the bar plot of each disease state in each tissue. Each row represents a significant GO biological process which is colored according to the -log10(p.adjust).
ColorectumMSI-HGO analysis - Figure of enriched GO biological processes: Top 15 enriched GO BP terms are showed in the bar plot of each disease state in each tissue. Each row represents a significant GO biological process which is colored according to the -log10(p.adjust).
ColorectumFAPGO analysis - Figure of enriched GO biological processes: Top 15 enriched GO BP terms are showed in the bar plot of each disease state in each tissue. Each row represents a significant GO biological process which is colored according to the -log10(p.adjust).
∗Top 15 enriched GO BP terms are showed in the bar plot of each disease state in each tissue. Each row represents a significant GO biological process which is colored according to the -log10(p.adjust).
Page: 1 2 3 4 5 6 7 8 9 

check button Enriched GO biological processes.
GO IDTissueDisease StageDescriptionGene RatioBg Ratiopvaluep.adjustCount
GO:00614481EndometriumEECconnective tissue development44/2168252/187233.51e-032.36e-0244
GO:00303261EndometriumEECembryonic limb morphogenesis23/2168116/187236.73e-033.93e-0223
GO:00351131EndometriumEECembryonic appendage morphogenesis23/2168116/187236.73e-033.93e-0223
GO:00351151EndometriumEECembryonic forelimb morphogenesis9/216831/187236.90e-033.98e-029
GO:00701671EndometriumEECregulation of biomineral tissue development20/216897/187237.11e-034.07e-0220
GO:00701691EndometriumEECpositive regulation of biomineral tissue development12/216849/187238.67e-034.71e-0212
GO:01101491EndometriumEECregulation of biomineralization20/216899/187238.95e-034.81e-0220
GO:00302821EndometriumEECbone mineralization23/2168119/187239.19e-034.94e-0223
GO:000150317EsophagusESCCossification232/8552408/187233.00e-063.40e-05232
GO:005067318EsophagusESCCepithelial cell proliferation238/8552437/187231.19e-048.20e-04238
GO:005067817EsophagusESCCregulation of epithelial cell proliferation206/8552381/187235.51e-043.02e-03206
GO:00485687EsophagusESCCembryonic organ development228/8552427/187237.28e-043.79e-03228
GO:00603485EsophagusESCCbone development115/8552205/187231.67e-037.72e-03115
GO:00487367EsophagusESCCappendage development98/8552172/187231.83e-038.37e-0398
GO:00601737EsophagusESCClimb development98/8552172/187231.83e-038.37e-0398
GO:00487052EsophagusESCCskeletal system morphogenesis120/8552220/187234.90e-031.89e-02120
GO:00016559EsophagusESCCurogenital system development177/8552338/187237.51e-032.69e-02177
GO:0060021EsophagusESCCroof of mouth development50/855285/187231.00e-023.42e-0250
GO:00512161EsophagusESCCcartilage development103/8552190/187231.08e-023.67e-02103
GO:00020623EsophagusESCCchondrocyte differentiation60/8552106/187231.53e-024.94e-0260
Page: 1 2 3 4 5 6 

check button Enriched KEGG pathways.
Pathway IDTissueDisease StageDescriptionGene RatioBg Ratiopvaluep.adjustqvalueCount
Page: 1 

Top

Cell-cell communication analysis

check buttonIdentification of potential cell-cell interactions between two cell types and their ligand-receptor pairs for different disease states
LigandReceptorLRpairPathwayTissueDisease Stage
Page: 1 

Top

Single-cell gene regulatory network inference analysis

check buttonFind out the significant the regulons (TFs) and the target genes of each regulon across cell types for different disease states
TFCell TypeTissueDisease StageTarget GeneRSSRegulon Activity
OSR2GLANEndometriumADJMMP11,SPON2,ISLR, etc.6.05e-01The dot plots of a searched regulon are shown for all cell subpopulations in each disease state of each tissue based on the regulon specific score inferred using pySCENIC and by calculating the average expression.
OSR2GLANEndometriumAEHMMP11,SPON2,ISLR, etc.3.92e-01The dot plots of a searched regulon are shown for all cell subpopulations in each disease state of each tissue based on the regulon specific score inferred using pySCENIC and by calculating the average expression.
OSR2PLAEsophagusHealthyOTUD4,OVOL2,STAC, etc.2.68e-02The dot plots of a searched regulon are shown for all cell subpopulations in each disease state of each tissue based on the regulon specific score inferred using pySCENIC and by calculating the average expression.
OSR2MYOFIBEsophagusADJENTPD2,CTD-2003C8.2,CPZ, etc.6.05e-04The dot plots of a searched regulon are shown for all cell subpopulations in each disease state of each tissue based on the regulon specific score inferred using pySCENIC and by calculating the average expression.
OSR2SMCEsophagusESCCENTPD2,CTD-2003C8.2,CPZ, etc.2.75e-02The dot plots of a searched regulon are shown for all cell subpopulations in each disease state of each tissue based on the regulon specific score inferred using pySCENIC and by calculating the average expression.
OSR2MYOFIBEsophagusHealthyENTPD2,CTD-2003C8.2,CPZ, etc.1.31e-03The dot plots of a searched regulon are shown for all cell subpopulations in each disease state of each tissue based on the regulon specific score inferred using pySCENIC and by calculating the average expression.
OSR2INCAFEsophagusHealthyENTPD2,CTD-2003C8.2,CPZ, etc.1.53e-02The dot plots of a searched regulon are shown for all cell subpopulations in each disease state of each tissue based on the regulon specific score inferred using pySCENIC and by calculating the average expression.
OSR2MSCEsophagusHealthyENTPD2,CTD-2003C8.2,CPZ, etc.3.30e-03The dot plots of a searched regulon are shown for all cell subpopulations in each disease state of each tissue based on the regulon specific score inferred using pySCENIC and by calculating the average expression.
OSR2pDCProstateBPHPCOLCE,DCN,GPM6B, etc.1.61e-01The dot plots of a searched regulon are shown for all cell subpopulations in each disease state of each tissue based on the regulon specific score inferred using pySCENIC and by calculating the average expression.
OSR2INCAFProstateBPHOLFML3,DCN,LGALS3BP, etc.1.08e-01The dot plots of a searched regulon are shown for all cell subpopulations in each disease state of each tissue based on the regulon specific score inferred using pySCENIC and by calculating the average expression.
∗The dot plots of a searched regulon are shown for all cell subpopulations in each disease state of each tissue based on the regulon specific score inferred using pySCENIC and by calculating the average expression.
Page: 1 2 

Top

Somatic mutation of malignant transformation related genes

check buttonAnnotation of somatic variants for genes involved in malignant transformation
Hugo SymbolVariant ClassVariant ClassificationdbSNP RSHGVScHGVSpHGVSp ShortSWISSPROTBIOTYPESIFTPolyPhenTumor Sample BarcodeTissueHistologySexAgeStageTherapy TypesDrugsOutcome
OSR2SNVMissense_Mutationc.1124N>Tp.Ser375Phep.S375FQ8N2R0protein_codingdeleterious_low_confidence(0)possibly_damaging(0.76)TCGA-AR-A1AI-01Breastbreast invasive carcinomaFemale<65I/IIChemotherapycytoxanPD
OSR2SNVMissense_Mutationc.699N>Gp.Asp233Glup.D233EQ8N2R0protein_codingtolerated_low_confidence(0.17)benign(0.013)TCGA-E9-A1NA-01Breastbreast invasive carcinomaFemale<65I/IIChemotherapycyclophosphamideSD
OSR2SNVMissense_Mutationc.502C>Gp.Gln168Glup.Q168EQ8N2R0protein_codingdeleterious_low_confidence(0)benign(0.244)TCGA-EW-A1PA-01Breastbreast invasive carcinomaFemale<65I/IIChemotherapycyclophosphamideSD
OSR2insertionNonsense_Mutationnovelc.938_939insATTTTATTAAATCTTATATCCATATAGAAGAATAATTGCAACATAAp.Thr314PhefsTer3p.T314Ffs*3Q8N2R0protein_codingTCGA-A2-A0CT-01Breastbreast invasive carcinomaFemale>=65I/IIChemotherapycytoxanSD
OSR2SNVMissense_Mutationc.1078N>Ap.Gln360Lysp.Q360KQ8N2R0protein_codingdeleterious_low_confidence(0)possibly_damaging(0.694)TCGA-EK-A2PG-01Cervixcervical & endocervical cancerFemale>=65I/IIUnknownUnknownSD
OSR2SNVMissense_Mutationc.496N>Ap.Ala166Thrp.A166TQ8N2R0protein_codingdeleterious_low_confidence(0.02)probably_damaging(0.993)TCGA-MA-AA3X-01Cervixcervical & endocervical cancerFemale<65III/IVChemotherapycisplatinCR
OSR2SNVMissense_Mutationnovelc.1105N>Cp.Thr369Prop.T369PQ8N2R0protein_codingdeleterious_low_confidence(0.01)possibly_damaging(0.837)TCGA-AA-3510-01Colorectumcolon adenocarcinomaMale>=65I/IIUnknownUnknownSD
OSR2SNVMissense_Mutationnovelc.820T>Gp.Leu274Valp.L274VQ8N2R0protein_codingdeleterious_low_confidence(0.03)benign(0.297)TCGA-AA-3684-01Colorectumcolon adenocarcinomaFemale>=65III/IVUnknownUnknownSD
OSR2SNVMissense_Mutationnovelc.709N>Cp.Phe237Leup.F237LQ8N2R0protein_codingdeleterious_low_confidence(0.04)probably_damaging(0.986)TCGA-AA-3984-01Colorectumcolon adenocarcinomaFemale<65I/IIUnknownUnknownSD
OSR2SNVMissense_Mutationc.386N>Tp.Ala129Valp.A129VQ8N2R0protein_codingdeleterious_low_confidence(0)probably_damaging(0.99)TCGA-AD-6965-01Colorectumcolon adenocarcinomaMale<65III/IVChemotherapyoxaliplatinPD
Page: 1 2 3 4 5 6 7 

Top

Related drugs of malignant transformation related genes

check buttonIdentification of chemicals and drugs interact with genes involved in malignant transfromation
(DGIdb 4.0)
Entrez IDSymbolCategoryInteraction TypesDrug Claim NameDrug NamePMIDs
Page: 1