
|
|||||
|
 | |
| |
| |
| |
| |
| |
|
Gene: NUBP1 |
Gene summary for NUBP1 |
| Gene information | Species | Human | Gene symbol | NUBP1 | Gene ID | 4682 |
| Gene name | nucleotide binding protein 1 | |
| Gene Alias | CIAO5 | |
| Cytomap | 16p13.13 | |
| Gene Type | protein-coding | GO ID | GO:0000226 | UniProtAcc | P53384 |
Top |
Malignant transformation analysis |
| Identification of the aberrant gene expression in precancerous and cancerous lesions by comparing the gene expression of stem-like cells in diseased tissues with normal stem cells |
| Entrez ID | Symbol | Replicates | Species | Organ | Tissue | Adj P-value | Log2FC | Malignancy |
| 4682 | NUBP1 | LZE4T | Human | Esophagus | ESCC | 2.14e-06 | 2.33e-01 | 0.0811 |
| 4682 | NUBP1 | LZE8T | Human | Esophagus | ESCC | 6.02e-07 | 3.68e-01 | 0.067 |
| 4682 | NUBP1 | LZE20T | Human | Esophagus | ESCC | 3.84e-02 | 1.21e-01 | 0.0662 |
| 4682 | NUBP1 | LZE24T | Human | Esophagus | ESCC | 8.97e-09 | 2.06e-01 | 0.0596 |
| 4682 | NUBP1 | LZE6T | Human | Esophagus | ESCC | 5.63e-08 | 2.89e-01 | 0.0845 |
| 4682 | NUBP1 | P1T-E | Human | Esophagus | ESCC | 1.81e-02 | 2.12e-01 | 0.0875 |
| 4682 | NUBP1 | P2T-E | Human | Esophagus | ESCC | 1.58e-44 | 8.56e-01 | 0.1177 |
| 4682 | NUBP1 | P4T-E | Human | Esophagus | ESCC | 1.34e-09 | 2.56e-01 | 0.1323 |
| 4682 | NUBP1 | P5T-E | Human | Esophagus | ESCC | 9.98e-09 | 2.25e-01 | 0.1327 |
| 4682 | NUBP1 | P8T-E | Human | Esophagus | ESCC | 8.98e-31 | 5.83e-01 | 0.0889 |
| 4682 | NUBP1 | P9T-E | Human | Esophagus | ESCC | 1.99e-09 | 1.23e-01 | 0.1131 |
| 4682 | NUBP1 | P10T-E | Human | Esophagus | ESCC | 2.66e-09 | 1.44e-01 | 0.116 |
| 4682 | NUBP1 | P11T-E | Human | Esophagus | ESCC | 1.72e-18 | 5.97e-01 | 0.1426 |
| 4682 | NUBP1 | P12T-E | Human | Esophagus | ESCC | 6.18e-28 | 4.97e-01 | 0.1122 |
| 4682 | NUBP1 | P15T-E | Human | Esophagus | ESCC | 1.30e-15 | 3.00e-01 | 0.1149 |
| 4682 | NUBP1 | P16T-E | Human | Esophagus | ESCC | 4.88e-20 | 3.23e-01 | 0.1153 |
| 4682 | NUBP1 | P17T-E | Human | Esophagus | ESCC | 4.56e-12 | 4.17e-01 | 0.1278 |
| 4682 | NUBP1 | P19T-E | Human | Esophagus | ESCC | 2.80e-07 | 4.53e-01 | 0.1662 |
| 4682 | NUBP1 | P20T-E | Human | Esophagus | ESCC | 1.06e-14 | 3.40e-01 | 0.1124 |
| 4682 | NUBP1 | P21T-E | Human | Esophagus | ESCC | 1.75e-27 | 4.81e-01 | 0.1617 |
| Page: 1 2 3 4 5 |
| Tissue | Expression Dynamics | Abbreviation |
| Esophagus | 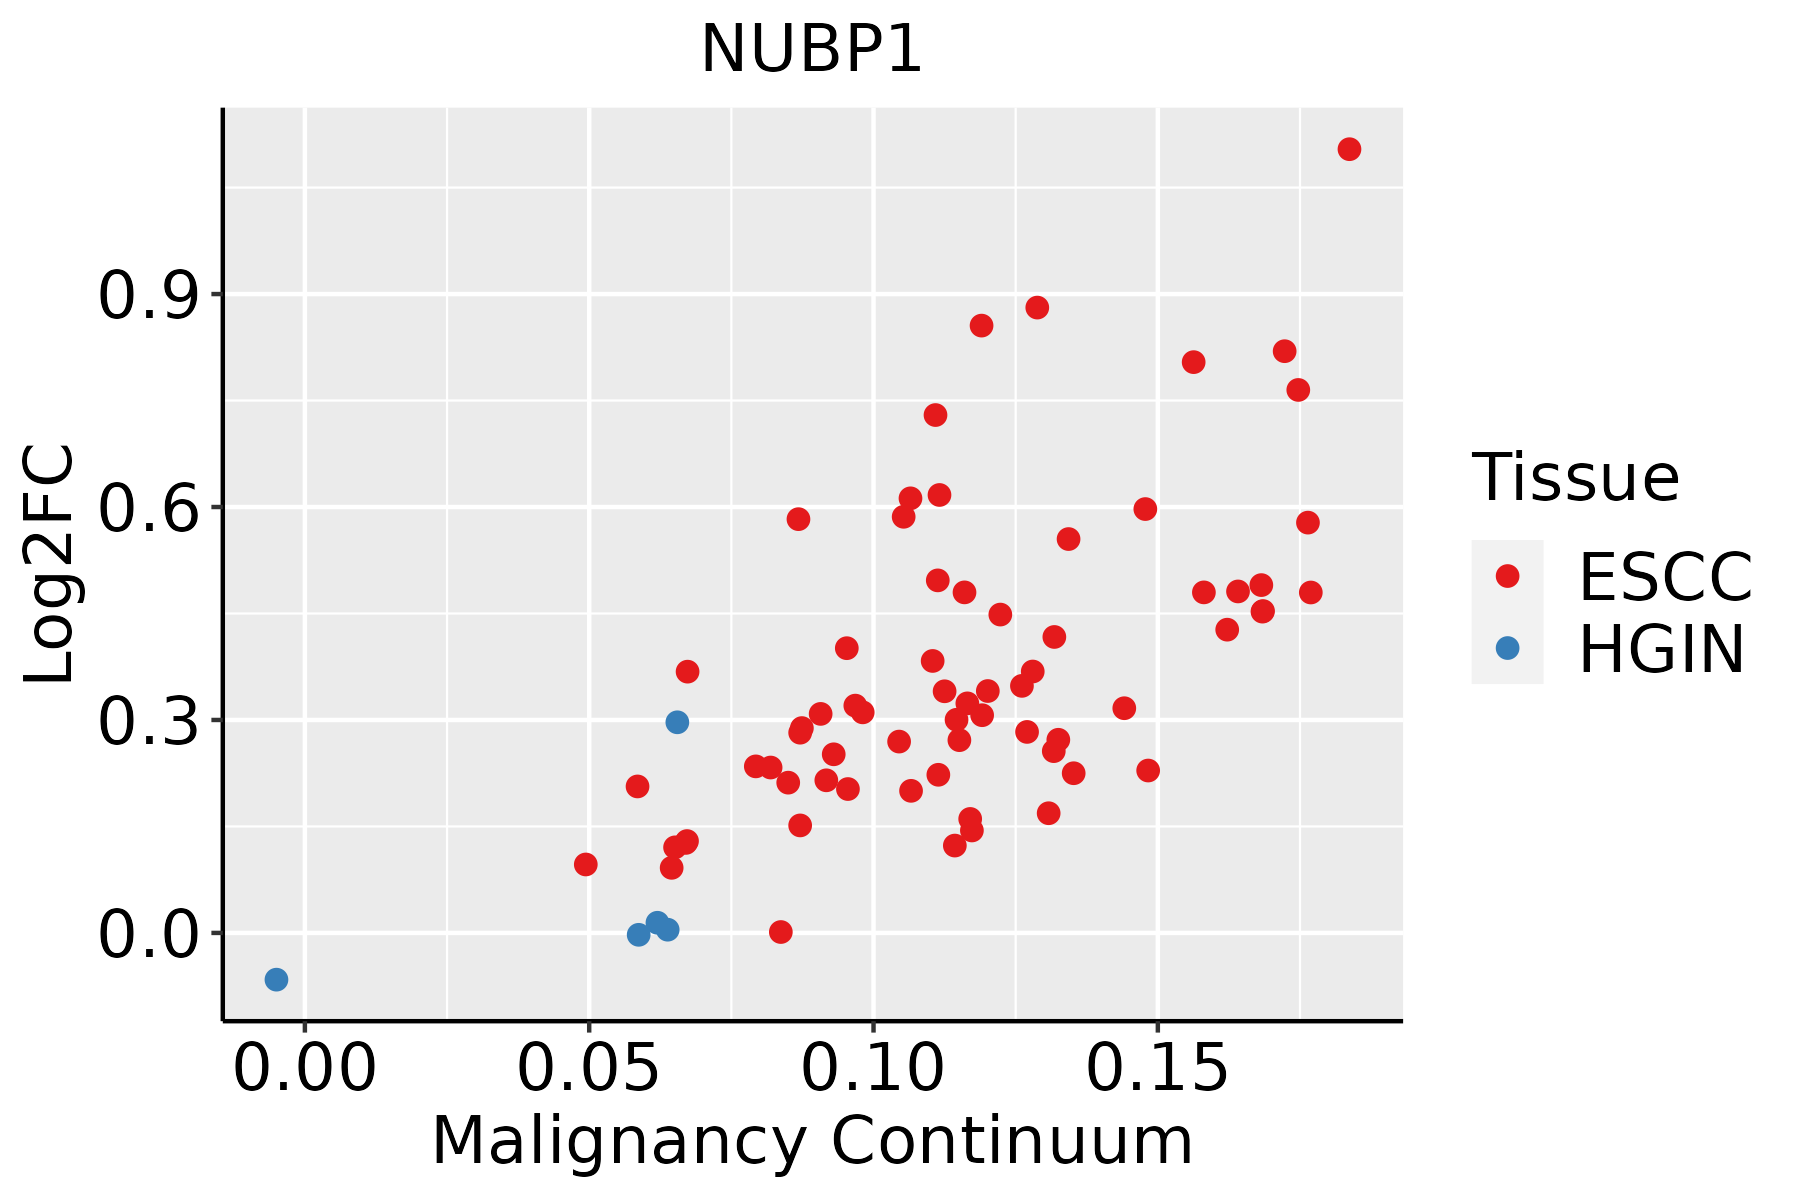 | ESCC: Esophageal squamous cell carcinoma |
| HGIN: High-grade intraepithelial neoplasias | ||
| LGIN: Low-grade intraepithelial neoplasias | ||
| Oral Cavity | 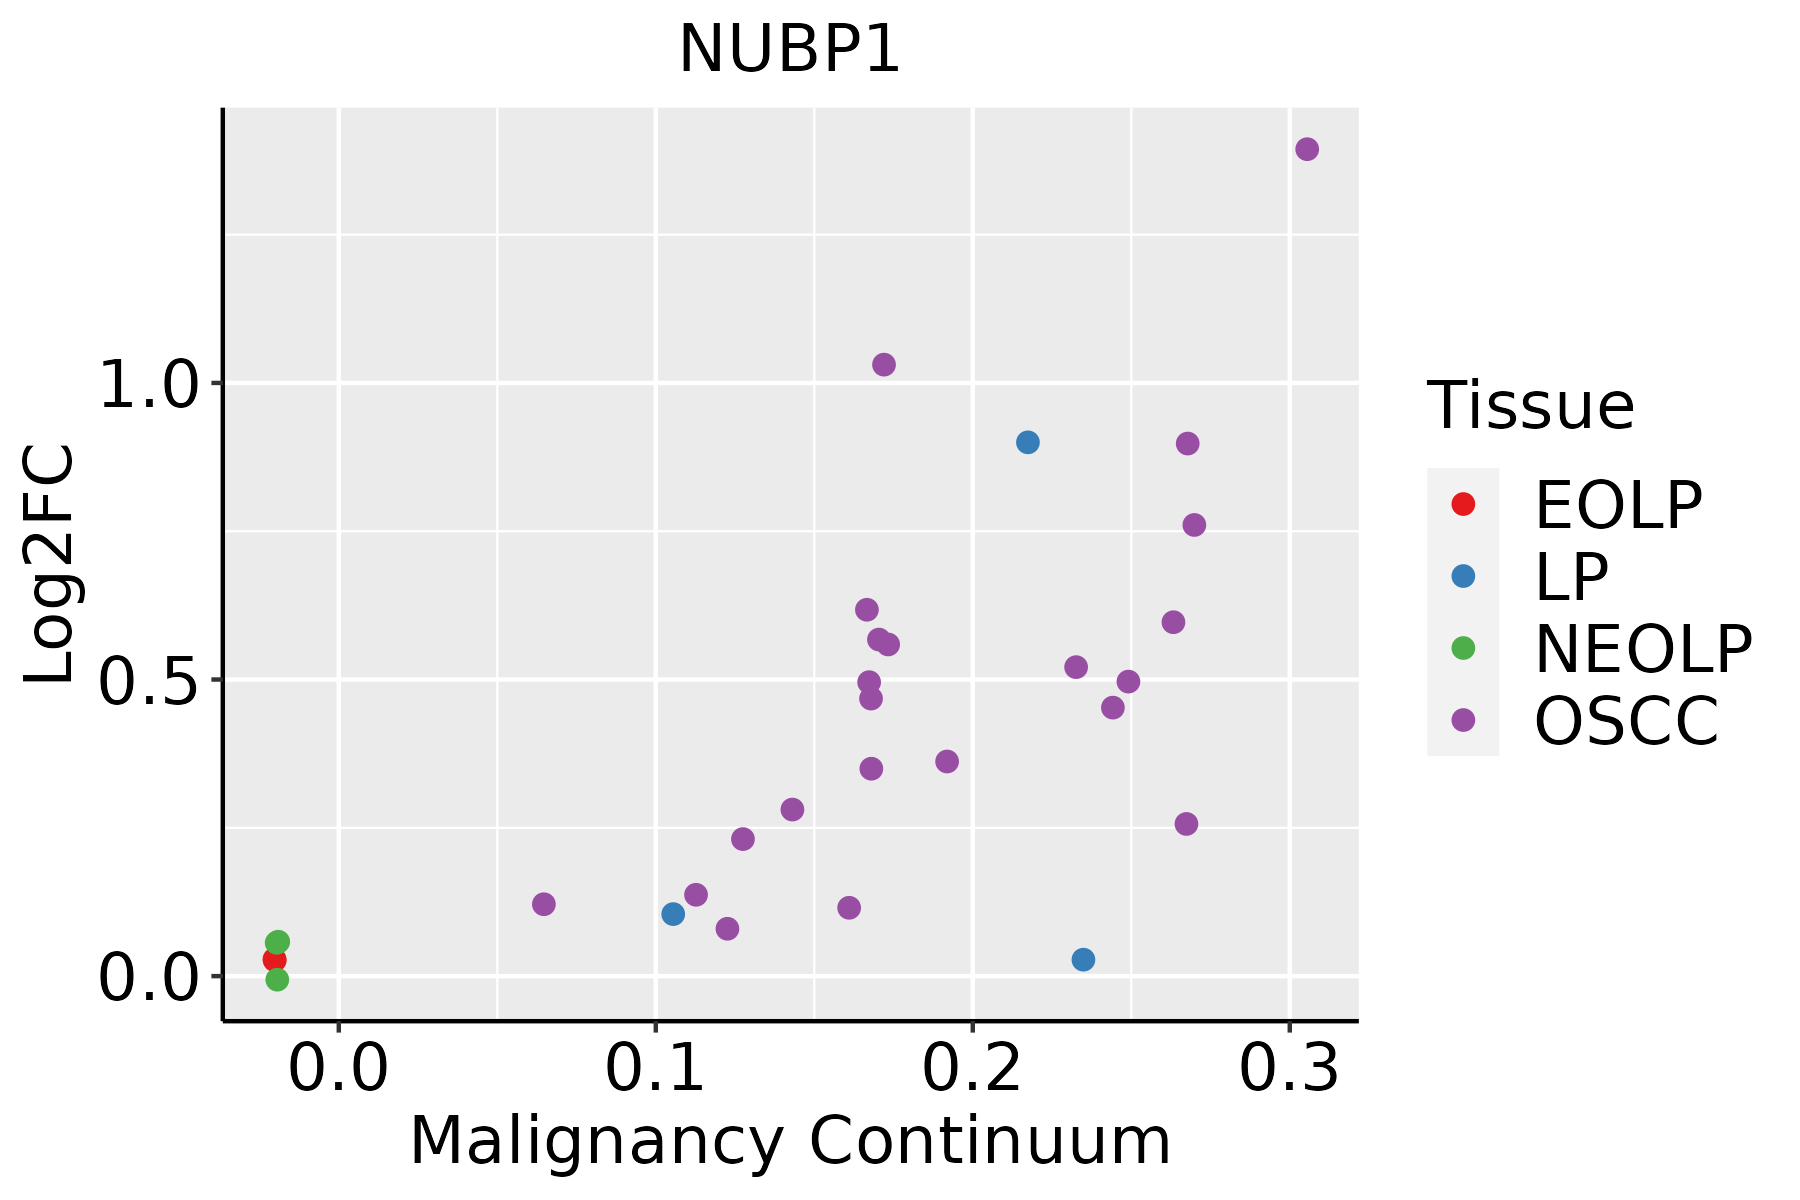 | EOLP: Erosive Oral lichen planus |
| LP: leukoplakia | ||
| NEOLP: Non-erosive oral lichen planus | ||
| OSCC: Oral squamous cell carcinoma | ||
| Skin | 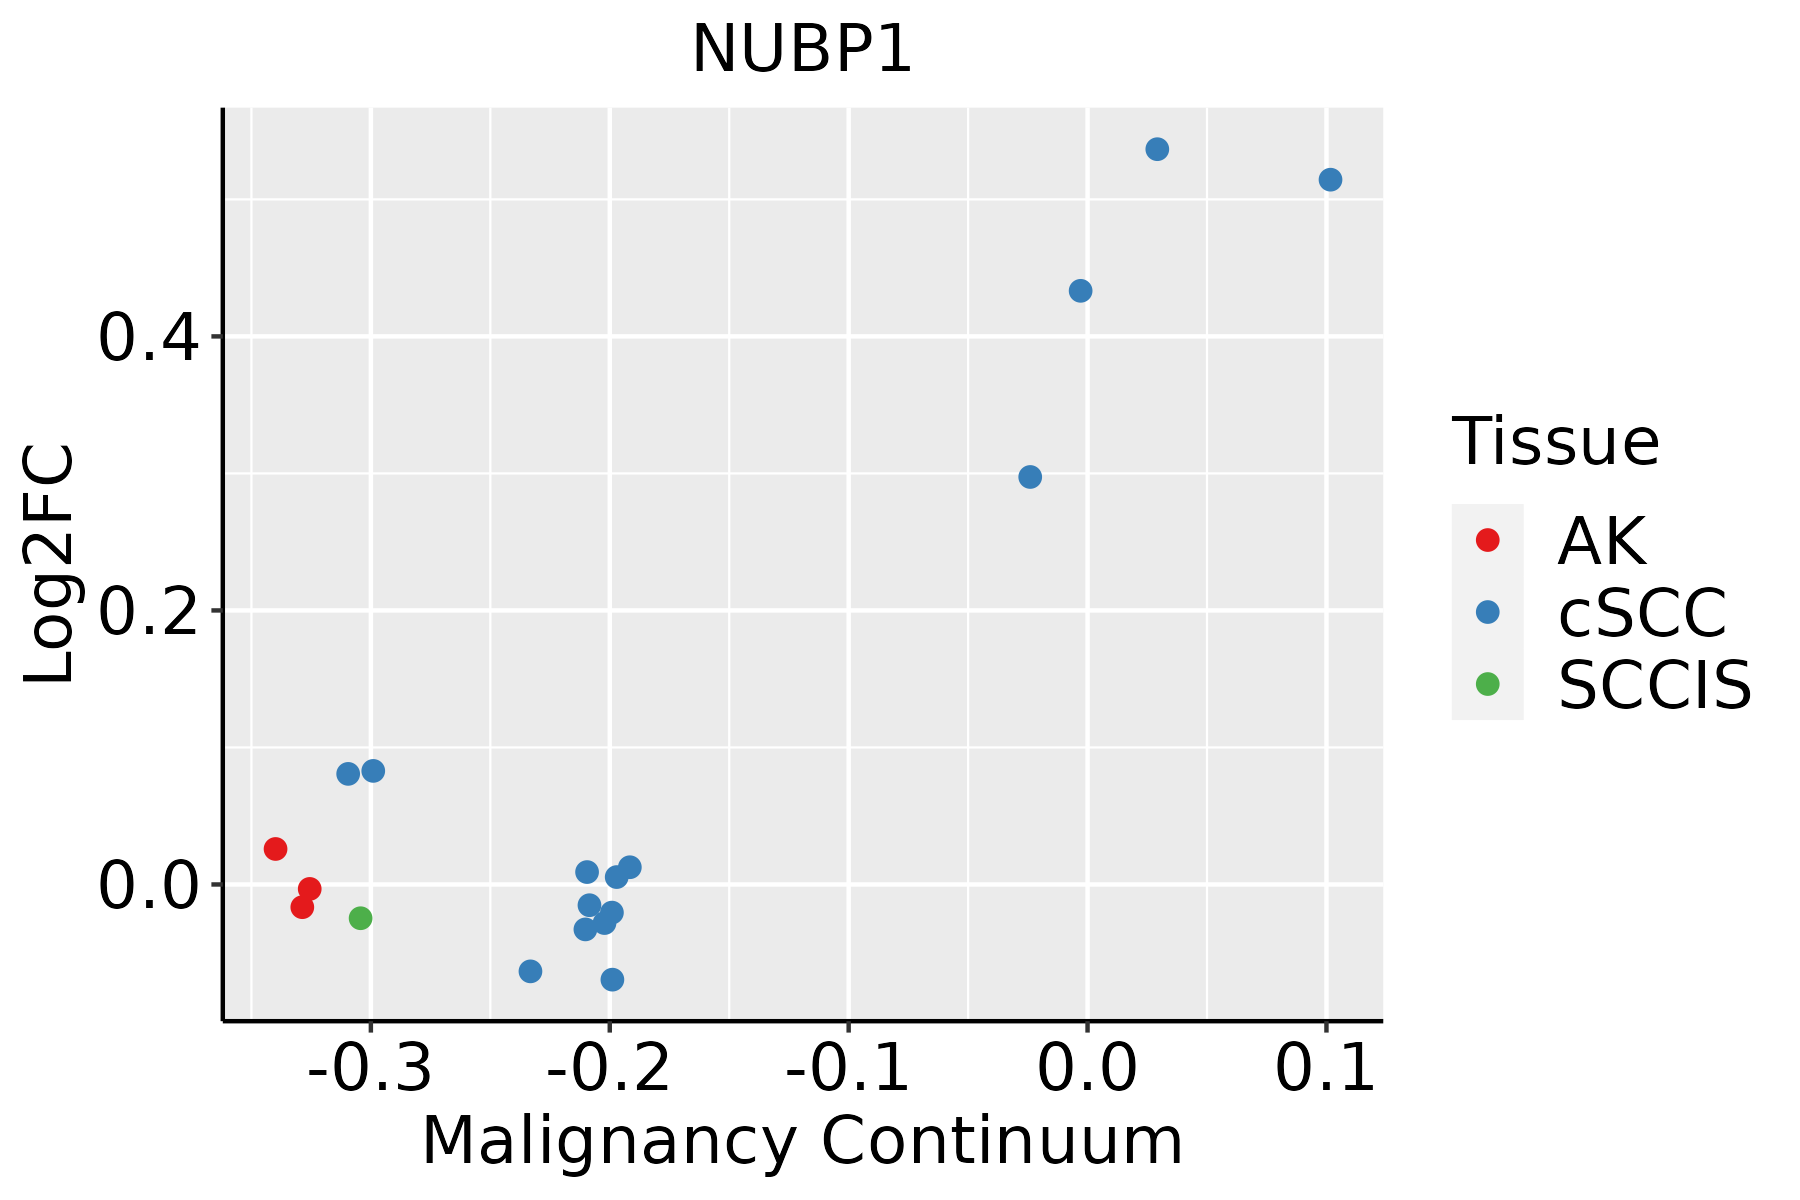 | AK: Actinic keratosis |
| cSCC: Cutaneous squamous cell carcinoma | ||
| SCCIS:squamous cell carcinoma in situ | ||
| Thyroid |  | ATC: Anaplastic thyroid cancer |
| HT: Hashimoto's thyroiditis | ||
| PTC: Papillary thyroid cancer |
| ∗log2FC in expression of this searched gene in stem-like cells from each diseased tissue sample relative to stem-like cells in normal samples in each tissue plotted against the malignancy continuum. Samples are colored based on if they are from different disease stage. |
Top |
Malignant transformation related pathway analysis |
| Find out the enriched GO biological processes and KEGG pathways involved in transition from healthy to precancer to cancer |
| Tissue | Disease Stage | Enriched GO biological Processes |
| Colorectum | AD |  |
| Colorectum | SER |  |
| Colorectum | MSS |  |
| Colorectum | MSI-H |  |
| Colorectum | FAP |  |
| ∗Top 15 enriched GO BP terms are showed in the bar plot of each disease state in each tissue. Each row represents a significant GO biological process which is colored according to the -log10(p.adjust). |
| Page: 1 2 3 4 5 6 7 8 9 |
| GO ID | Tissue | Disease Stage | Description | Gene Ratio | Bg Ratio | pvalue | p.adjust | Count |
| GO:004691615 | Oral cavity | LP | cellular transition metal ion homeostasis | 46/4623 | 115/18723 | 2.02e-04 | 2.20e-03 | 46 |
| GO:000155817 | Oral cavity | LP | regulation of cell growth | 134/4623 | 414/18723 | 2.25e-04 | 2.41e-03 | 134 |
| GO:00162261 | Oral cavity | LP | iron-sulfur cluster assembly | 15/4623 | 26/18723 | 3.34e-04 | 3.34e-03 | 15 |
| GO:00311631 | Oral cavity | LP | metallo-sulfur cluster assembly | 15/4623 | 26/18723 | 3.34e-04 | 3.34e-03 | 15 |
| GO:001094811 | Oral cavity | LP | negative regulation of cell cycle process | 95/4623 | 294/18723 | 1.80e-03 | 1.37e-02 | 95 |
| GO:000679012 | Oral cavity | LP | sulfur compound metabolic process | 106/4623 | 339/18723 | 3.36e-03 | 2.25e-02 | 106 |
| GO:006184214 | Oral cavity | LP | microtubule organizing center localization | 15/4623 | 33/18723 | 7.43e-03 | 4.13e-02 | 15 |
| GO:006184215 | Skin | cSCC | microtubule organizing center localization | 25/4864 | 33/18723 | 3.13e-09 | 1.08e-07 | 25 |
| GO:0010639111 | Skin | cSCC | negative regulation of organelle organization | 140/4864 | 348/18723 | 3.35e-09 | 1.15e-07 | 140 |
| GO:199077824 | Skin | cSCC | protein localization to cell periphery | 134/4864 | 333/18723 | 7.09e-09 | 2.30e-07 | 134 |
| GO:005164214 | Skin | cSCC | centrosome localization | 24/4864 | 32/18723 | 9.21e-09 | 2.87e-07 | 24 |
| GO:001604925 | Skin | cSCC | cell growth | 173/4864 | 482/18723 | 7.21e-07 | 1.34e-05 | 173 |
| GO:004578613 | Skin | cSCC | negative regulation of cell cycle | 140/4864 | 385/18723 | 3.64e-06 | 5.50e-05 | 140 |
| GO:001094812 | Skin | cSCC | negative regulation of cell cycle process | 108/4864 | 294/18723 | 2.75e-05 | 3.09e-04 | 108 |
| GO:005507618 | Skin | cSCC | transition metal ion homeostasis | 57/4864 | 138/18723 | 5.96e-05 | 5.86e-04 | 57 |
| GO:00310234 | Skin | cSCC | microtubule organizing center organization | 58/4864 | 143/18723 | 9.47e-05 | 8.83e-04 | 58 |
| GO:00070983 | Skin | cSCC | centrosome cycle | 53/4864 | 130/18723 | 1.59e-04 | 1.39e-03 | 53 |
| GO:004691610 | Skin | cSCC | cellular transition metal ion homeostasis | 48/4864 | 115/18723 | 1.63e-04 | 1.43e-03 | 48 |
| GO:000155824 | Skin | cSCC | regulation of cell growth | 140/4864 | 414/18723 | 2.07e-04 | 1.72e-03 | 140 |
| GO:00726971 | Skin | cSCC | protein localization to cell cortex | 8/4864 | 11/18723 | 1.56e-03 | 9.60e-03 | 8 |
| Page: 1 2 3 4 5 6 |
| Pathway ID | Tissue | Disease Stage | Description | Gene Ratio | Bg Ratio | pvalue | p.adjust | qvalue | Count |
| Page: 1 |
Top |
Cell-cell communication analysis |
| Identification of potential cell-cell interactions between two cell types and their ligand-receptor pairs for different disease states |
| Ligand | Receptor | LRpair | Pathway | Tissue | Disease Stage |
| Page: 1 |
Top |
Single-cell gene regulatory network inference analysis |
| Find out the significant the regulons (TFs) and the target genes of each regulon across cell types for different disease states |
| TF | Cell Type | Tissue | Disease Stage | Target Gene | RSS | Regulon Activity |
| ∗The dot plots of a searched regulon are shown for all cell subpopulations in each disease state of each tissue based on the regulon specific score inferred using pySCENIC and by calculating the average expression. |
| Page: 1 |
Top |
Somatic mutation of malignant transformation related genes |
| Annotation of somatic variants for genes involved in malignant transformation |
| Hugo Symbol | Variant Class | Variant Classification | dbSNP RS | HGVSc | HGVSp | HGVSp Short | SWISSPROT | BIOTYPE | SIFT | PolyPhen | Tumor Sample Barcode | Tissue | Histology | Sex | Age | Stage | Therapy Types | Drugs | Outcome |
| NUBP1 | SNV | Missense_Mutation | novel | c.874N>T | p.Ala292Ser | p.A292S | P53384 | protein_coding | tolerated(0.17) | possibly_damaging(0.802) | TCGA-E9-A54X-01 | Breast | breast invasive carcinoma | Female | >=65 | I/II | Unknown | Unknown | SD |
| NUBP1 | SNV | Missense_Mutation | c.16C>T | p.His6Tyr | p.H6Y | P53384 | protein_coding | deleterious(0) | benign(0.055) | TCGA-EW-A1IW-01 | Breast | breast invasive carcinoma | Female | >=65 | I/II | Hormone Therapy | aromasin | SD | |
| NUBP1 | insertion | Frame_Shift_Ins | novel | c.520_521insG | p.Pro174ArgfsTer6 | p.P174Rfs*6 | P53384 | protein_coding | TCGA-A8-A08H-01 | Breast | breast invasive carcinoma | Female | >=65 | I/II | Unknown | Unknown | SD | ||
| NUBP1 | insertion | Frame_Shift_Ins | novel | c.521_522insCTGTAATCCCAGCACTT | p.Gly175CysfsTer28 | p.G175Cfs*28 | P53384 | protein_coding | TCGA-A8-A08H-01 | Breast | breast invasive carcinoma | Female | >=65 | I/II | Unknown | Unknown | SD | ||
| NUBP1 | SNV | Missense_Mutation | c.492N>T | p.Glu164Asp | p.E164D | P53384 | protein_coding | tolerated(0.65) | benign(0.001) | TCGA-A6-2672-01 | Colorectum | colon adenocarcinoma | Female | >=65 | III/IV | Unknown | Unknown | SD | |
| NUBP1 | SNV | Missense_Mutation | novel | c.106N>C | p.Gly36Arg | p.G36R | P53384 | protein_coding | tolerated(0.12) | benign(0.003) | TCGA-AG-3580-01 | Colorectum | rectum adenocarcinoma | Male | >=65 | I/II | Unknown | Unknown | SD |
| NUBP1 | insertion | Frame_Shift_Ins | novel | c.493_494insAATCCACAGGGGATGCTTACTTT | p.Val165GlufsTer40 | p.V165Efs*40 | P53384 | protein_coding | TCGA-AA-3492-01 | Colorectum | colon adenocarcinoma | Female | >=65 | I/II | Unknown | Unknown | SD | ||
| NUBP1 | SNV | Missense_Mutation | c.725C>A | p.Ser242Tyr | p.S242Y | P53384 | protein_coding | deleterious(0) | probably_damaging(0.954) | TCGA-AP-A051-01 | Endometrium | uterine corpus endometrioid carcinoma | Female | >=65 | I/II | Unknown | Unknown | SD | |
| NUBP1 | SNV | Missense_Mutation | c.16C>T | p.His6Tyr | p.H6Y | P53384 | protein_coding | deleterious(0) | benign(0.055) | TCGA-B5-A0JX-01 | Endometrium | uterine corpus endometrioid carcinoma | Female | <65 | I/II | Unknown | Unknown | SD | |
| NUBP1 | SNV | Missense_Mutation | c.413N>A | p.Pro138His | p.P138H | P53384 | protein_coding | deleterious(0.02) | possibly_damaging(0.779) | TCGA-B5-A11E-01 | Endometrium | uterine corpus endometrioid carcinoma | Female | <65 | I/II | Unknown | Unknown | SD |
| Page: 1 2 3 |
Top |
Related drugs of malignant transformation related genes |
| Identification of chemicals and drugs interact with genes involved in malignant transfromation |
| (DGIdb 4.0) |
| Entrez ID | Symbol | Category | Interaction Types | Drug Claim Name | Drug Name | PMIDs |
| Page: 1 |

Copyright 2023-Present -The University of Texas Health Science Center at Houston |