
|
|||||
|
 | |
| |
| |
| |
| |
| |
|
Gene: NSA2 |
Gene summary for NSA2 |
| Gene information | Species | Human | Gene symbol | NSA2 | Gene ID | 10412 |
| Gene name | NSA2 ribosome biogenesis factor | |
| Gene Alias | CDK105 | |
| Cytomap | 5q13.3 | |
| Gene Type | protein-coding | GO ID | GO:0000460 | UniProtAcc | A0A0A0MQZ6 |
Top |
Malignant transformation analysis |
| Identification of the aberrant gene expression in precancerous and cancerous lesions by comparing the gene expression of stem-like cells in diseased tissues with normal stem cells |
| Entrez ID | Symbol | Replicates | Species | Organ | Tissue | Adj P-value | Log2FC | Malignancy |
| 10412 | NSA2 | CA_HPV_1 | Human | Cervix | CC | 1.05e-05 | -2.23e-01 | 0.0264 |
| 10412 | NSA2 | CA_HPV_3 | Human | Cervix | CC | 2.80e-02 | -6.21e-03 | 0.0414 |
| 10412 | NSA2 | CCI_1 | Human | Cervix | CC | 1.25e-11 | -8.40e-01 | 0.528 |
| 10412 | NSA2 | CCI_2 | Human | Cervix | CC | 1.75e-03 | -3.88e-01 | 0.5249 |
| 10412 | NSA2 | CCI_3 | Human | Cervix | CC | 1.78e-07 | -6.60e-01 | 0.516 |
| 10412 | NSA2 | CCII_1 | Human | Cervix | CC | 4.84e-24 | -8.76e-01 | 0.3249 |
| 10412 | NSA2 | Tumor | Human | Cervix | CC | 2.03e-18 | -6.32e-01 | 0.1241 |
| 10412 | NSA2 | sample3 | Human | Cervix | CC | 6.23e-26 | -6.55e-01 | 0.1387 |
| 10412 | NSA2 | L1 | Human | Cervix | CC | 1.81e-13 | -6.53e-01 | 0.0802 |
| 10412 | NSA2 | T1 | Human | Cervix | CC | 1.41e-03 | -3.52e-01 | 0.0918 |
| 10412 | NSA2 | T3 | Human | Cervix | CC | 4.15e-24 | -6.21e-01 | 0.1389 |
| 10412 | NSA2 | HTA11_347_2000001011 | Human | Colorectum | AD | 9.33e-06 | 3.52e-01 | -0.1954 |
| 10412 | NSA2 | HTA11_866_3004761011 | Human | Colorectum | AD | 3.33e-02 | 1.69e-01 | 0.096 |
| 10412 | NSA2 | HTA11_99999970781_79442 | Human | Colorectum | MSS | 4.86e-10 | 4.61e-01 | 0.294 |
| 10412 | NSA2 | HTA11_99999965062_69753 | Human | Colorectum | MSI-H | 4.50e-02 | 1.01e+00 | 0.3487 |
| 10412 | NSA2 | HTA11_99999965104_69814 | Human | Colorectum | MSS | 6.61e-04 | 3.63e-01 | 0.281 |
| 10412 | NSA2 | HTA11_99999971662_82457 | Human | Colorectum | MSS | 8.76e-10 | 4.51e-01 | 0.3859 |
| 10412 | NSA2 | HTA11_99999974143_84620 | Human | Colorectum | MSS | 1.02e-05 | 2.04e-01 | 0.3005 |
| 10412 | NSA2 | AEH-subject1 | Human | Endometrium | AEH | 2.69e-21 | -5.46e-01 | -0.3059 |
| 10412 | NSA2 | AEH-subject2 | Human | Endometrium | AEH | 5.99e-26 | -5.68e-01 | -0.2525 |
| Page: 1 2 3 4 5 6 7 8 9 10 |
| Tissue | Expression Dynamics | Abbreviation |
| Cervix |  | CC: Cervix cancer |
| HSIL_HPV: HPV-infected high-grade squamous intraepithelial lesions | ||
| N_HPV: HPV-infected normal cervix | ||
| Colorectum (GSE201348) |  | FAP: Familial adenomatous polyposis |
| CRC: Colorectal cancer | ||
| Colorectum (HTA11) |  | AD: Adenomas |
| SER: Sessile serrated lesions | ||
| MSI-H: Microsatellite-high colorectal cancer | ||
| MSS: Microsatellite stable colorectal cancer | ||
| Endometrium | 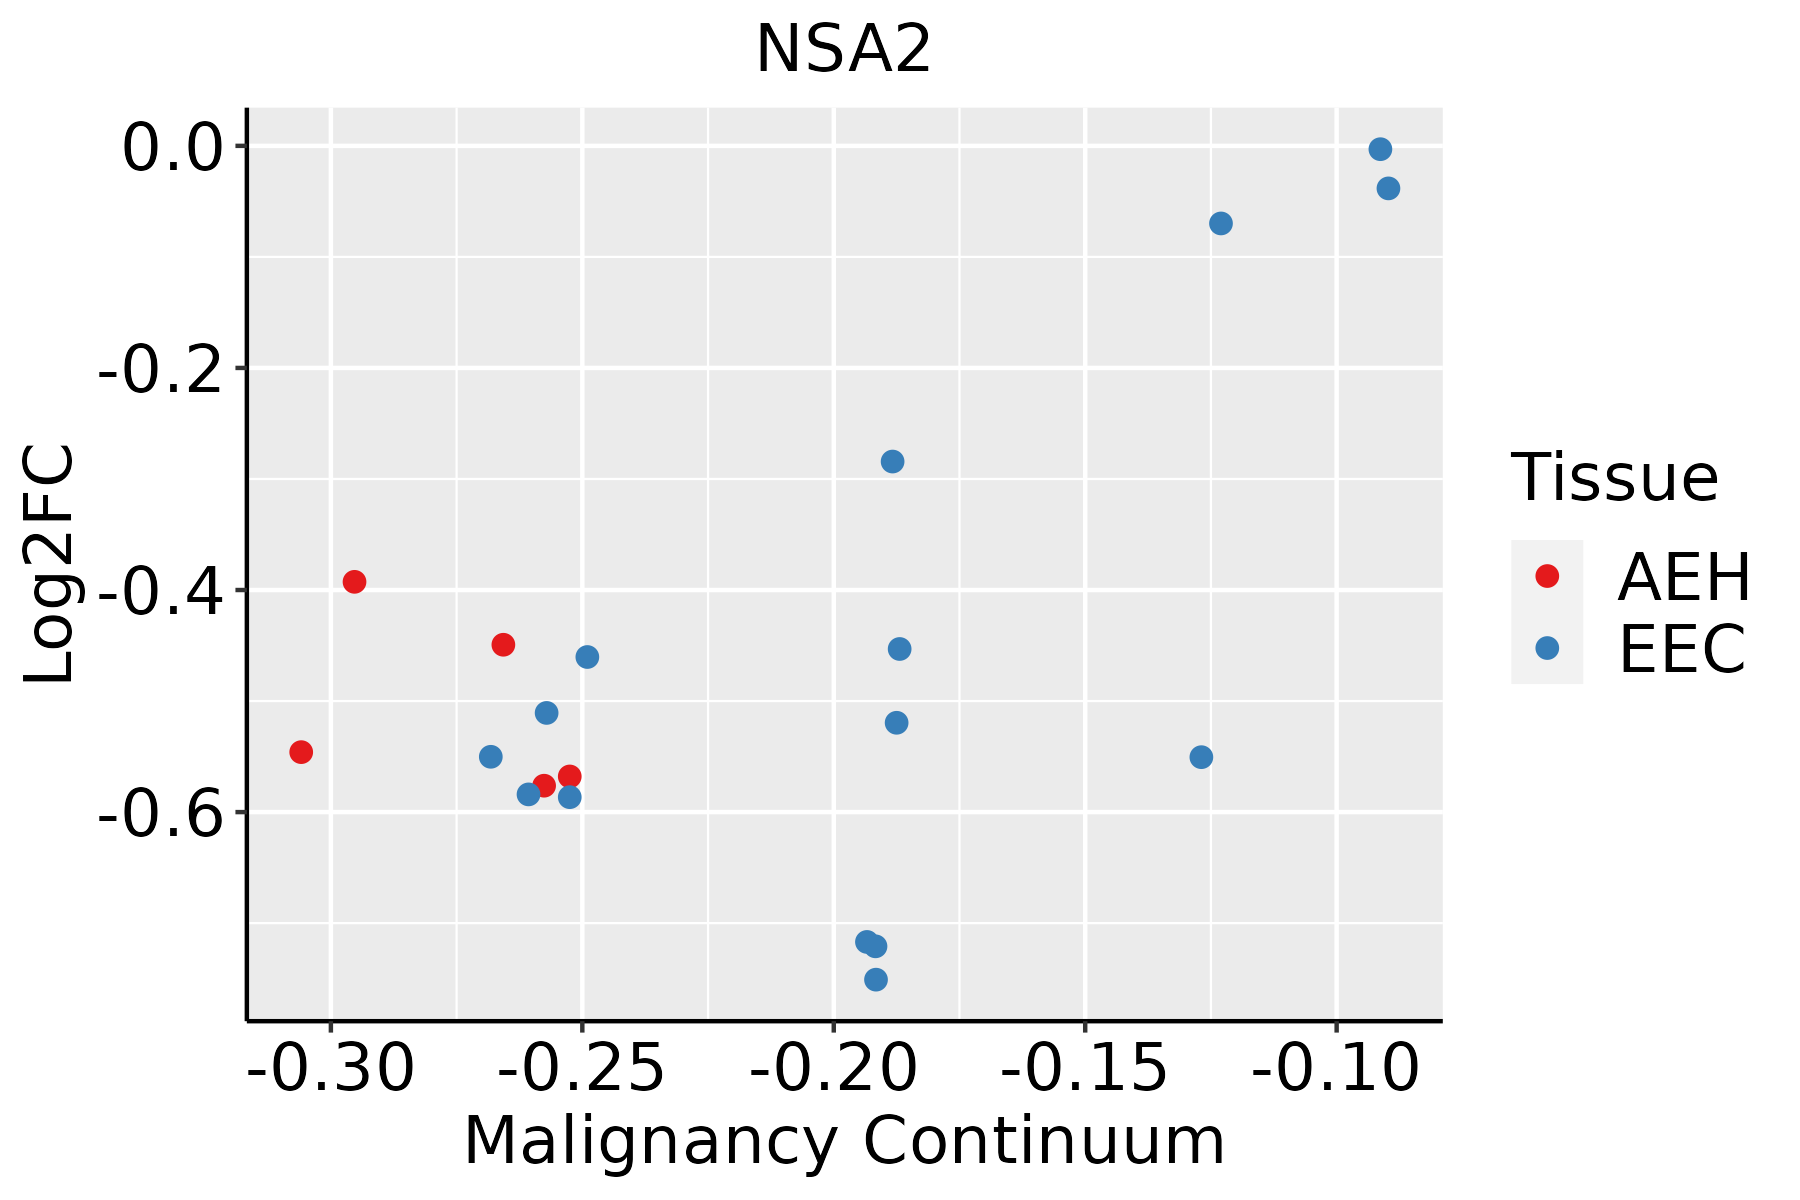 | AEH: Atypical endometrial hyperplasia |
| EEC: Endometrioid Cancer | ||
| Esophagus | 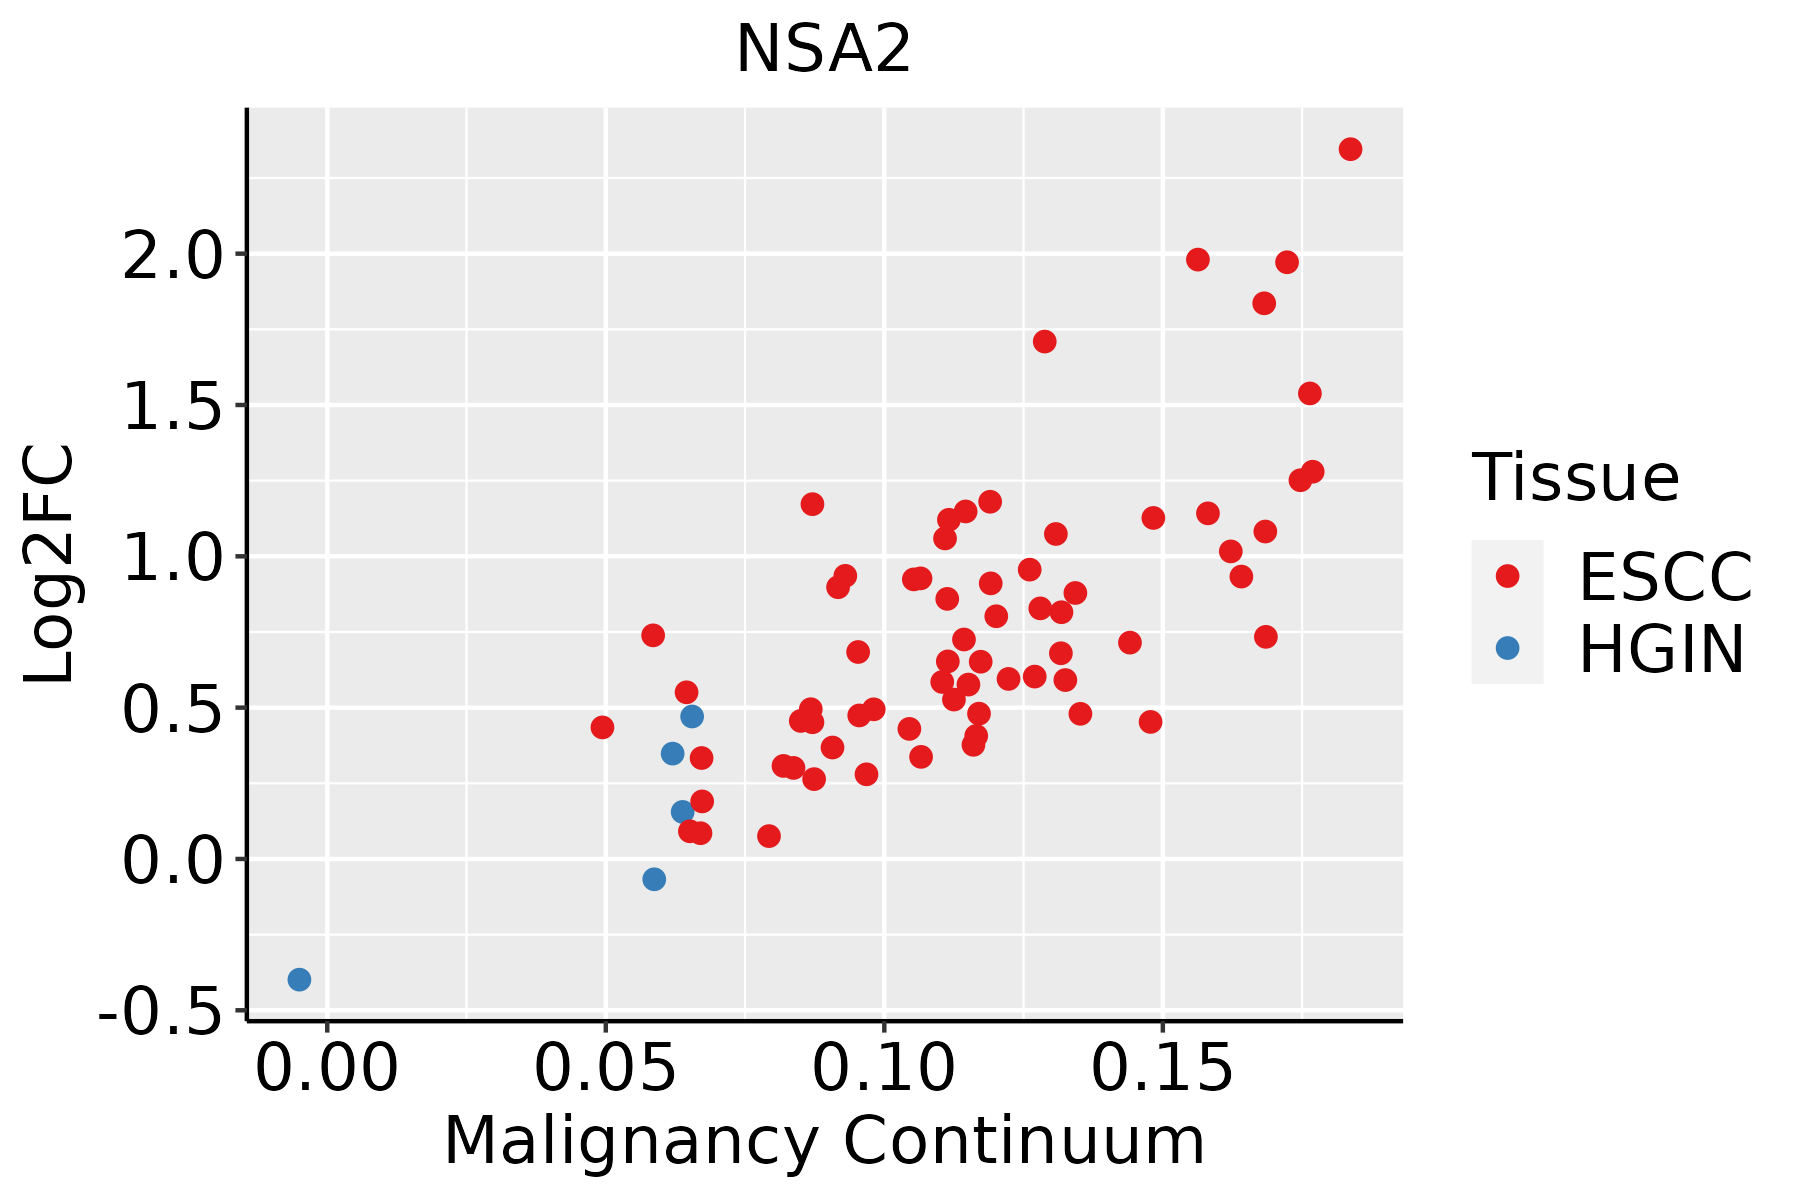 | ESCC: Esophageal squamous cell carcinoma |
| HGIN: High-grade intraepithelial neoplasias | ||
| LGIN: Low-grade intraepithelial neoplasias | ||
| Liver |  | HCC: Hepatocellular carcinoma |
| NAFLD: Non-alcoholic fatty liver disease | ||
| Oral Cavity |  | EOLP: Erosive Oral lichen planus |
| LP: leukoplakia | ||
| NEOLP: Non-erosive oral lichen planus | ||
| OSCC: Oral squamous cell carcinoma | ||
| Prostate |  | BPH: Benign Prostatic Hyperplasia |
| Skin | 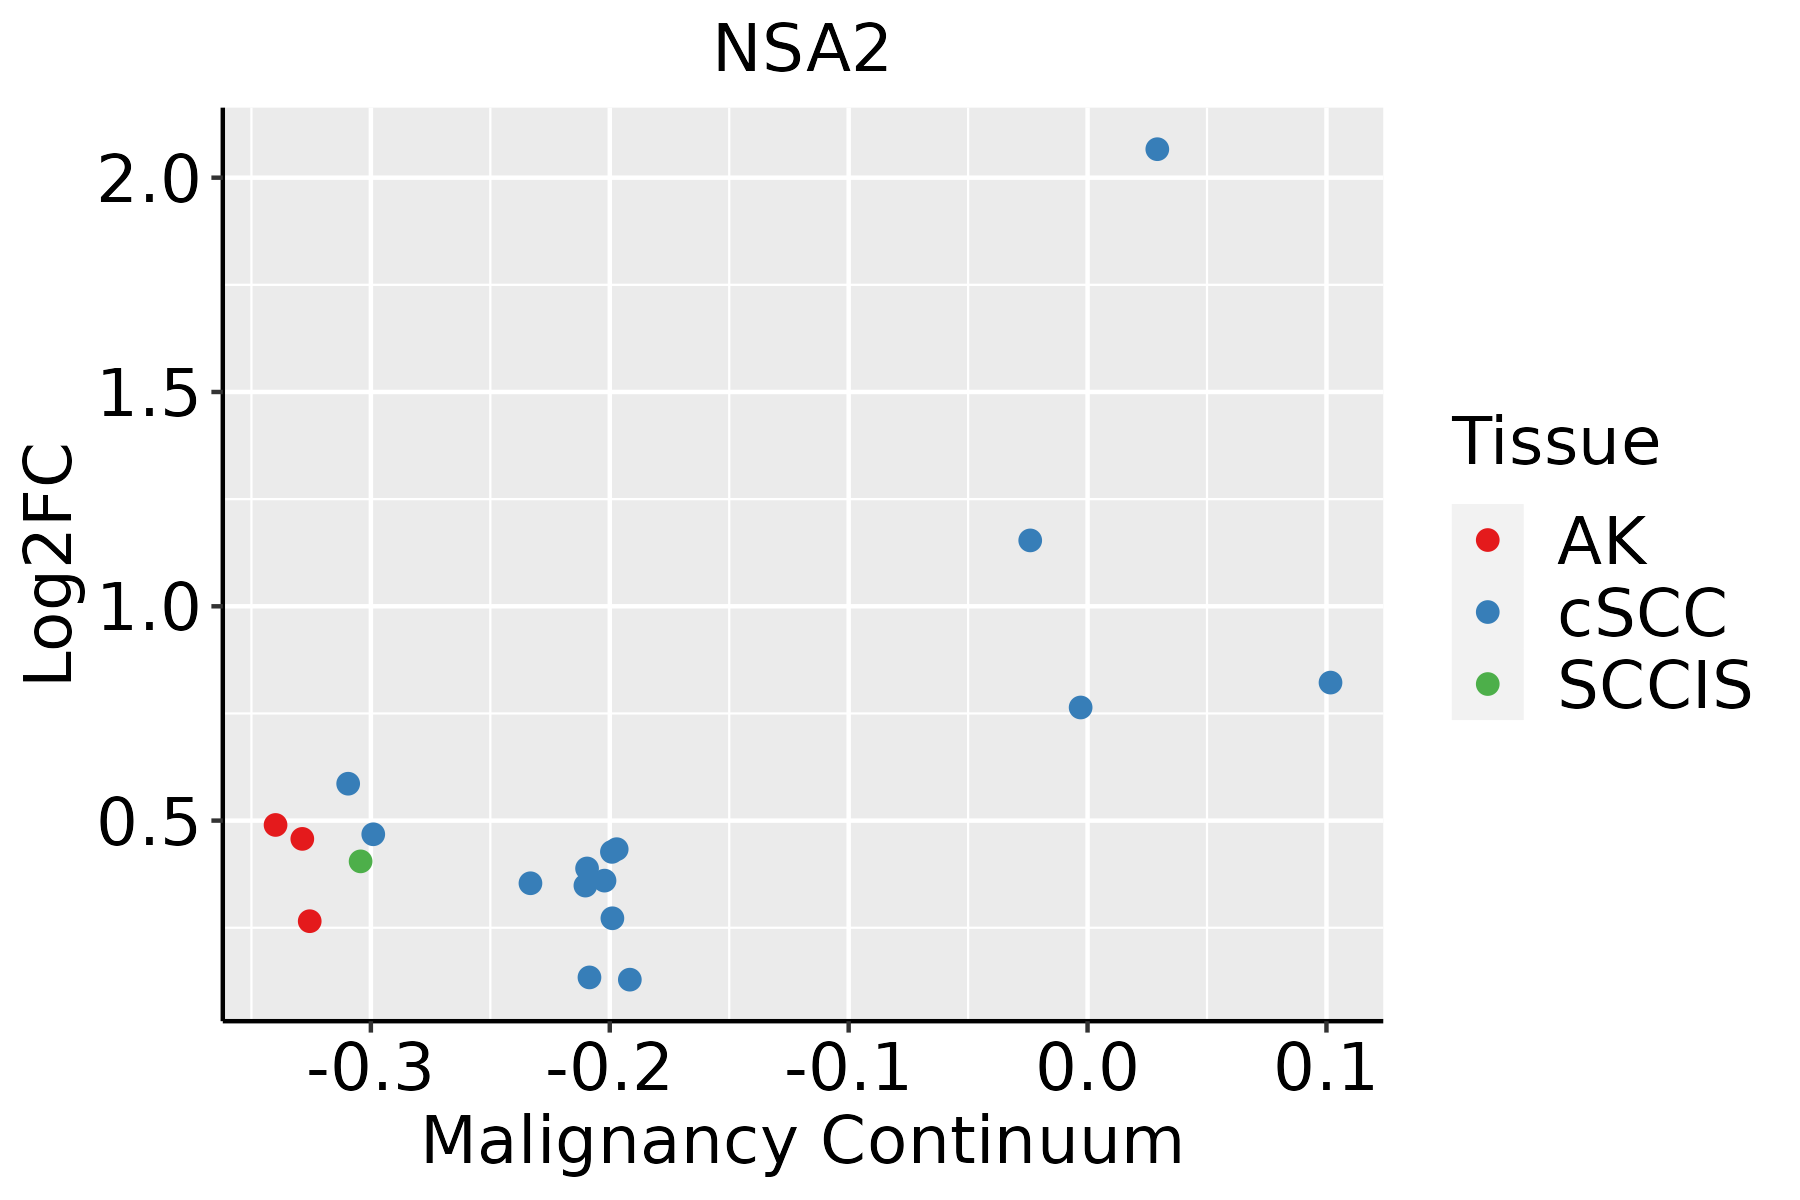 | AK: Actinic keratosis |
| cSCC: Cutaneous squamous cell carcinoma | ||
| SCCIS:squamous cell carcinoma in situ | ||
| Thyroid |  | ATC: Anaplastic thyroid cancer |
| HT: Hashimoto's thyroiditis | ||
| PTC: Papillary thyroid cancer |
| ∗log2FC in expression of this searched gene in stem-like cells from each diseased tissue sample relative to stem-like cells in normal samples in each tissue plotted against the malignancy continuum. Samples are colored based on if they are from different disease stage. |
Top |
Malignant transformation related pathway analysis |
| Find out the enriched GO biological processes and KEGG pathways involved in transition from healthy to precancer to cancer |
| Tissue | Disease Stage | Enriched GO biological Processes |
| Colorectum | AD |  |
| Colorectum | SER |  |
| Colorectum | MSS |  |
| Colorectum | MSI-H |  |
| Colorectum | FAP |  |
| ∗Top 15 enriched GO BP terms are showed in the bar plot of each disease state in each tissue. Each row represents a significant GO biological process which is colored according to the -log10(p.adjust). |
| Page: 1 2 3 4 5 6 7 8 9 |
| GO ID | Tissue | Disease Stage | Description | Gene Ratio | Bg Ratio | pvalue | p.adjust | Count |
| GO:003447010 | Esophagus | HGIN | ncRNA processing | 97/2587 | 395/18723 | 5.92e-09 | 3.90e-07 | 97 |
| GO:00346606 | Esophagus | HGIN | ncRNA metabolic process | 104/2587 | 485/18723 | 2.26e-06 | 8.23e-05 | 104 |
| GO:00004707 | Esophagus | HGIN | maturation of LSU-rRNA | 10/2587 | 28/18723 | 3.04e-03 | 2.88e-02 | 10 |
| GO:0022613111 | Esophagus | ESCC | ribonucleoprotein complex biogenesis | 365/8552 | 463/18723 | 1.74e-49 | 1.11e-45 | 365 |
| GO:0042254111 | Esophagus | ESCC | ribosome biogenesis | 252/8552 | 299/18723 | 3.27e-44 | 1.04e-40 | 252 |
| GO:003447015 | Esophagus | ESCC | ncRNA processing | 300/8552 | 395/18723 | 3.09e-35 | 3.26e-32 | 300 |
| GO:0016072110 | Esophagus | ESCC | rRNA metabolic process | 197/8552 | 236/18723 | 1.31e-33 | 1.18e-30 | 197 |
| GO:0006364110 | Esophagus | ESCC | rRNA processing | 189/8552 | 225/18723 | 4.88e-33 | 3.87e-30 | 189 |
| GO:003466012 | Esophagus | ESCC | ncRNA metabolic process | 346/8552 | 485/18723 | 4.35e-31 | 2.51e-28 | 346 |
| GO:0042273111 | Esophagus | ESCC | ribosomal large subunit biogenesis | 65/8552 | 72/18723 | 1.53e-15 | 9.82e-14 | 65 |
| GO:000047016 | Esophagus | ESCC | maturation of LSU-rRNA | 27/8552 | 28/18723 | 9.94e-09 | 2.00e-07 | 27 |
| GO:00004603 | Esophagus | ESCC | maturation of 5.8S rRNA | 30/8552 | 35/18723 | 1.07e-06 | 1.34e-05 | 30 |
| GO:002261312 | Liver | Cirrhotic | ribonucleoprotein complex biogenesis | 231/4634 | 463/18723 | 3.28e-32 | 6.86e-29 | 231 |
| GO:004225412 | Liver | Cirrhotic | ribosome biogenesis | 154/4634 | 299/18723 | 1.18e-23 | 6.72e-21 | 154 |
| GO:000636412 | Liver | Cirrhotic | rRNA processing | 115/4634 | 225/18723 | 1.12e-17 | 1.64e-15 | 115 |
| GO:00160724 | Liver | Cirrhotic | rRNA metabolic process | 119/4634 | 236/18723 | 1.19e-17 | 1.70e-15 | 119 |
| GO:004227312 | Liver | Cirrhotic | ribosomal large subunit biogenesis | 47/4634 | 72/18723 | 4.20e-13 | 3.29e-11 | 47 |
| GO:00344701 | Liver | Cirrhotic | ncRNA processing | 158/4634 | 395/18723 | 1.09e-11 | 6.96e-10 | 158 |
| GO:00346603 | Liver | Cirrhotic | ncRNA metabolic process | 173/4634 | 485/18723 | 3.64e-08 | 1.21e-06 | 173 |
| GO:00004702 | Liver | Cirrhotic | maturation of LSU-rRNA | 19/4634 | 28/18723 | 1.84e-06 | 3.48e-05 | 19 |
| Page: 1 2 3 4 5 6 7 8 |
| Pathway ID | Tissue | Disease Stage | Description | Gene Ratio | Bg Ratio | pvalue | p.adjust | qvalue | Count |
| Page: 1 |
Top |
Cell-cell communication analysis |
| Identification of potential cell-cell interactions between two cell types and their ligand-receptor pairs for different disease states |
| Ligand | Receptor | LRpair | Pathway | Tissue | Disease Stage |
| Page: 1 |
Top |
Single-cell gene regulatory network inference analysis |
| Find out the significant the regulons (TFs) and the target genes of each regulon across cell types for different disease states |
| TF | Cell Type | Tissue | Disease Stage | Target Gene | RSS | Regulon Activity |
| ∗The dot plots of a searched regulon are shown for all cell subpopulations in each disease state of each tissue based on the regulon specific score inferred using pySCENIC and by calculating the average expression. |
| Page: 1 |
Top |
Somatic mutation of malignant transformation related genes |
| Annotation of somatic variants for genes involved in malignant transformation |
| Hugo Symbol | Variant Class | Variant Classification | dbSNP RS | HGVSc | HGVSp | HGVSp Short | SWISSPROT | BIOTYPE | SIFT | PolyPhen | Tumor Sample Barcode | Tissue | Histology | Sex | Age | Stage | Therapy Types | Drugs | Outcome |
| NSA2 | SNV | Missense_Mutation | rs368758562 | c.685N>A | p.Leu229Ile | p.L229I | O95478 | protein_coding | tolerated(0.14) | benign(0.209) | TCGA-EA-A3HS-01 | Cervix | cervical & endocervical cancer | Female | <65 | I/II | Unknown | Unknown | SD |
| NSA2 | SNV | Missense_Mutation | c.572C>G | p.Thr191Ser | p.T191S | O95478 | protein_coding | deleterious(0.01) | probably_damaging(0.992) | TCGA-CK-4951-01 | Colorectum | colon adenocarcinoma | Female | >=65 | I/II | Unknown | Unknown | PD | |
| NSA2 | SNV | Missense_Mutation | c.530N>A | p.Arg177His | p.R177H | O95478 | protein_coding | deleterious(0.04) | benign(0) | TCGA-CM-5349-01 | Colorectum | colon adenocarcinoma | Female | >=65 | I/II | Unknown | Unknown | SD | |
| NSA2 | SNV | Missense_Mutation | c.364N>T | p.Pro122Ser | p.P122S | O95478 | protein_coding | deleterious(0.03) | possibly_damaging(0.703) | TCGA-G4-6309-01 | Colorectum | colon adenocarcinoma | Female | <65 | III/IV | Chemotherapy | xeloda | PD | |
| NSA2 | SNV | Missense_Mutation | novel | c.429N>C | p.Lys143Asn | p.K143N | O95478 | protein_coding | tolerated(0.07) | benign(0.333) | TCGA-AG-A01J-01 | Colorectum | rectum adenocarcinoma | Female | <65 | I/II | Unknown | Unknown | SD |
| NSA2 | SNV | Missense_Mutation | novel | c.251N>T | p.Gly84Val | p.G84V | O95478 | protein_coding | deleterious(0.01) | possibly_damaging(0.72) | TCGA-EF-5831-01 | Colorectum | rectum adenocarcinoma | Male | >=65 | I/II | Unknown | Unknown | SD |
| NSA2 | SNV | Missense_Mutation | c.586N>C | p.Ile196Leu | p.I196L | O95478 | protein_coding | deleterious(0.02) | benign(0.007) | TCGA-B5-A0K8-01 | Endometrium | uterine corpus endometrioid carcinoma | Female | >=65 | I/II | Chemotherapy | carboplatin | SD | |
| NSA2 | SNV | Missense_Mutation | rs769700489 | c.104N>A | p.Arg35His | p.R35H | O95478 | protein_coding | tolerated(0.27) | benign(0) | TCGA-B5-A3FC-01 | Endometrium | uterine corpus endometrioid carcinoma | Female | <65 | I/II | Unknown | Unknown | SD |
| NSA2 | SNV | Missense_Mutation | c.249N>T | p.Gln83His | p.Q83H | O95478 | protein_coding | tolerated(0.09) | benign(0.21) | TCGA-BS-A0TA-01 | Endometrium | uterine corpus endometrioid carcinoma | Female | <65 | III/IV | Chemotherapy | taxol | PD | |
| NSA2 | SNV | Missense_Mutation | c.574T>C | p.Phe192Leu | p.F192L | O95478 | protein_coding | deleterious(0.02) | benign(0.199) | TCGA-BS-A0UJ-01 | Endometrium | uterine corpus endometrioid carcinoma | Female | >=65 | I/II | Unknown | Unknown | SD |
| Page: 1 2 3 |
Top |
Related drugs of malignant transformation related genes |
| Identification of chemicals and drugs interact with genes involved in malignant transfromation |
| (DGIdb 4.0) |
| Entrez ID | Symbol | Category | Interaction Types | Drug Claim Name | Drug Name | PMIDs |
| Page: 1 |

Copyright 2023-Present -The University of Texas Health Science Center at Houston |