
|
|||||
|
 | |
| |
| |
| |
| |
| |
|
Gene: NPPC |
Gene summary for NPPC |
| Gene information | Species | Human | Gene symbol | NPPC | Gene ID | 4880 |
| Gene name | natriuretic peptide C | |
| Gene Alias | CNP | |
| Cytomap | 2q37.1 | |
| Gene Type | protein-coding | GO ID | GO:0000003 | UniProtAcc | E5LCN7 |
Top |
Malignant transformation analysis |
| Identification of the aberrant gene expression in precancerous and cancerous lesions by comparing the gene expression of stem-like cells in diseased tissues with normal stem cells |
| Entrez ID | Symbol | Replicates | Species | Organ | Tissue | Adj P-value | Log2FC | Malignancy |
| 4880 | NPPC | LZE24T | Human | Esophagus | ESCC | 5.50e-05 | 5.63e-01 | 0.0596 |
| 4880 | NPPC | LZE21T | Human | Esophagus | ESCC | 2.17e-02 | 3.69e-01 | 0.0655 |
| 4880 | NPPC | P2T-E | Human | Esophagus | ESCC | 3.35e-06 | 3.34e-01 | 0.1177 |
| 4880 | NPPC | P4T-E | Human | Esophagus | ESCC | 6.28e-17 | 6.78e-01 | 0.1323 |
| 4880 | NPPC | P11T-E | Human | Esophagus | ESCC | 1.50e-06 | 9.55e-01 | 0.1426 |
| 4880 | NPPC | P12T-E | Human | Esophagus | ESCC | 2.57e-22 | 9.37e-01 | 0.1122 |
| 4880 | NPPC | P15T-E | Human | Esophagus | ESCC | 2.51e-14 | 5.53e-01 | 0.1149 |
| 4880 | NPPC | P16T-E | Human | Esophagus | ESCC | 4.01e-23 | 8.71e-01 | 0.1153 |
| 4880 | NPPC | P20T-E | Human | Esophagus | ESCC | 2.87e-05 | 3.48e-01 | 0.1124 |
| 4880 | NPPC | P26T-E | Human | Esophagus | ESCC | 4.01e-07 | 6.56e-01 | 0.1276 |
| 4880 | NPPC | P27T-E | Human | Esophagus | ESCC | 4.16e-30 | 1.01e+00 | 0.1055 |
| 4880 | NPPC | P28T-E | Human | Esophagus | ESCC | 9.48e-06 | 2.80e-01 | 0.1149 |
| 4880 | NPPC | P32T-E | Human | Esophagus | ESCC | 5.51e-03 | -7.43e-02 | 0.1666 |
| 4880 | NPPC | P48T-E | Human | Esophagus | ESCC | 5.11e-06 | 5.20e-01 | 0.0959 |
| 4880 | NPPC | P54T-E | Human | Esophagus | ESCC | 1.94e-03 | 2.27e-01 | 0.0975 |
| 4880 | NPPC | P56T-E | Human | Esophagus | ESCC | 1.12e-04 | 5.84e-01 | 0.1613 |
| 4880 | NPPC | P57T-E | Human | Esophagus | ESCC | 4.42e-04 | 1.27e+00 | 0.0926 |
| 4880 | NPPC | P61T-E | Human | Esophagus | ESCC | 1.07e-11 | 5.18e-01 | 0.099 |
| 4880 | NPPC | P62T-E | Human | Esophagus | ESCC | 6.46e-29 | 2.46e+00 | 0.1302 |
| 4880 | NPPC | P65T-E | Human | Esophagus | ESCC | 1.51e-07 | 2.90e-01 | 0.0978 |
| Page: 1 2 3 |
| Tissue | Expression Dynamics | Abbreviation |
| Esophagus |  | ESCC: Esophageal squamous cell carcinoma |
| HGIN: High-grade intraepithelial neoplasias | ||
| LGIN: Low-grade intraepithelial neoplasias | ||
| Oral Cavity | 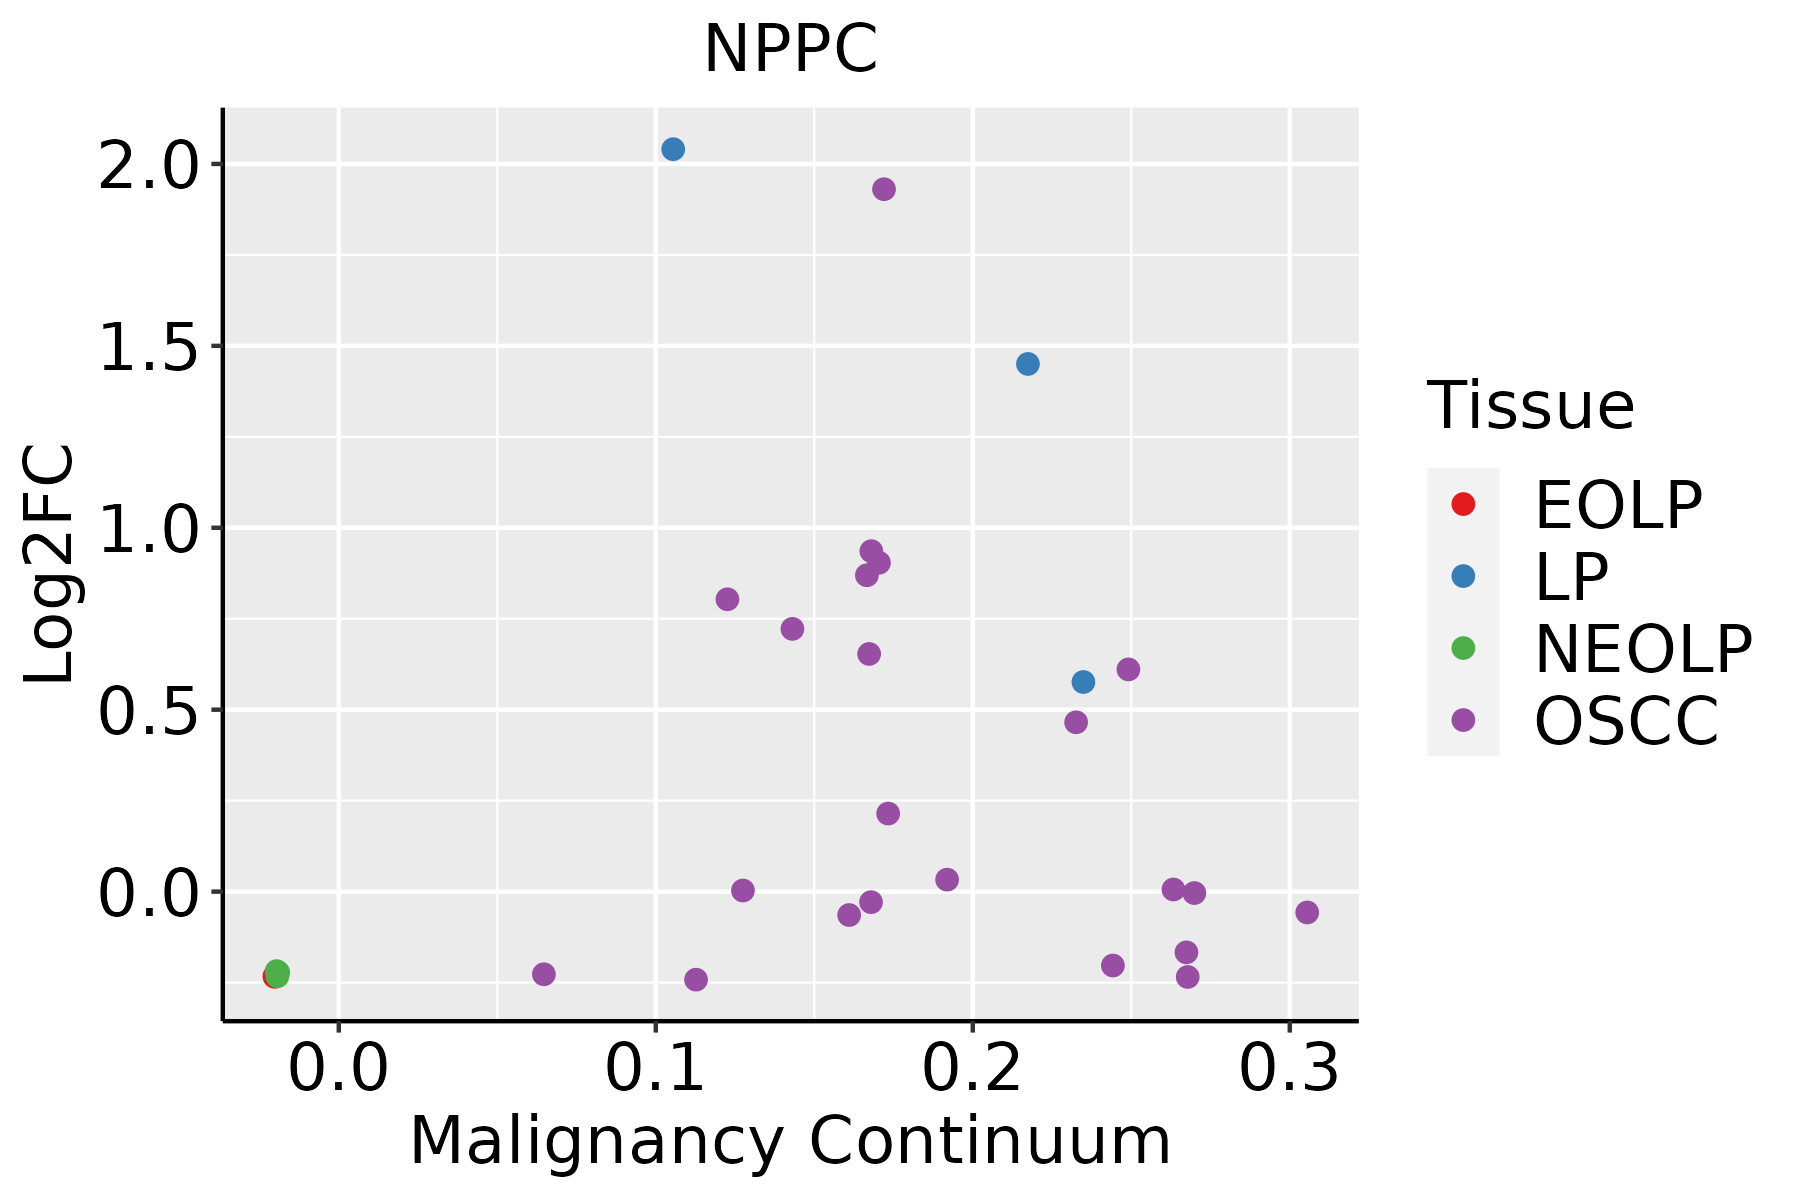 | EOLP: Erosive Oral lichen planus |
| LP: leukoplakia | ||
| NEOLP: Non-erosive oral lichen planus | ||
| OSCC: Oral squamous cell carcinoma | ||
| Prostate | 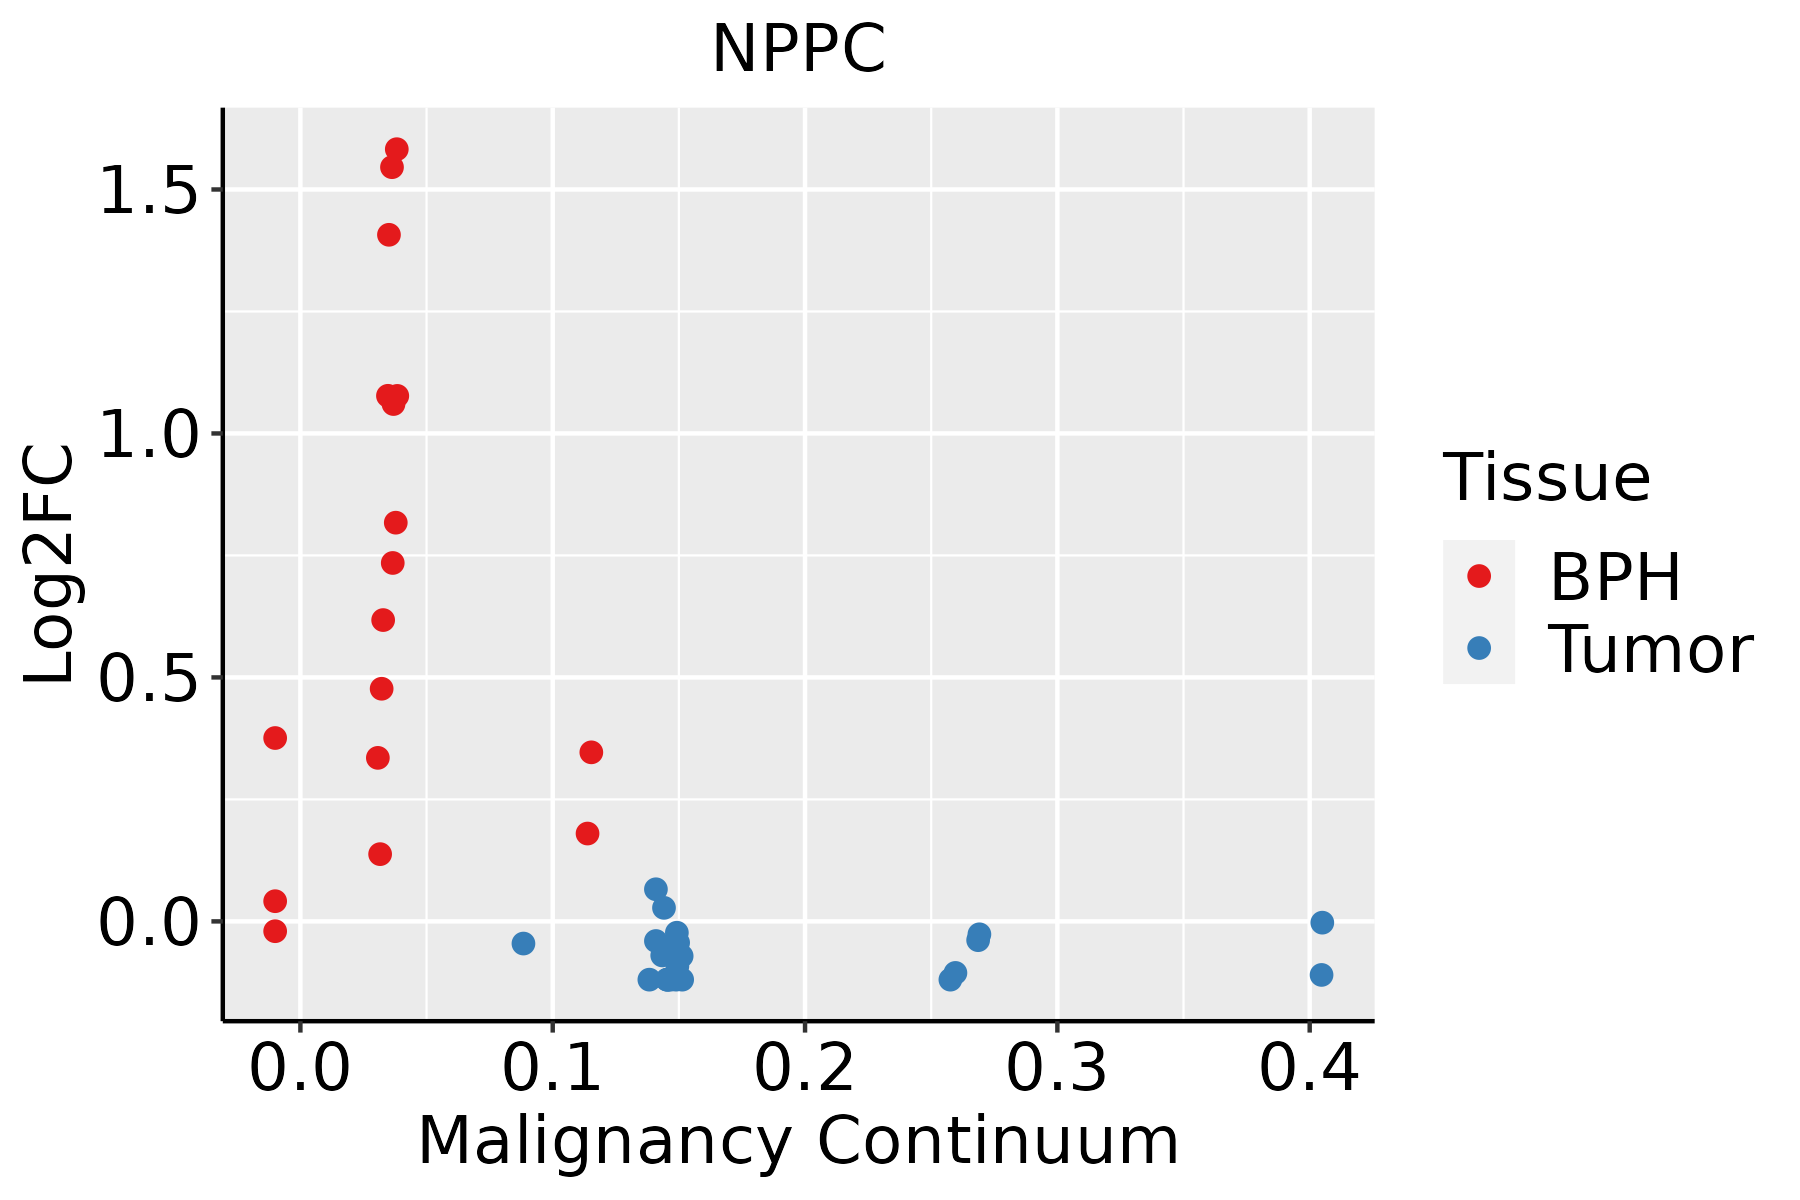 | BPH: Benign Prostatic Hyperplasia |
| Thyroid | 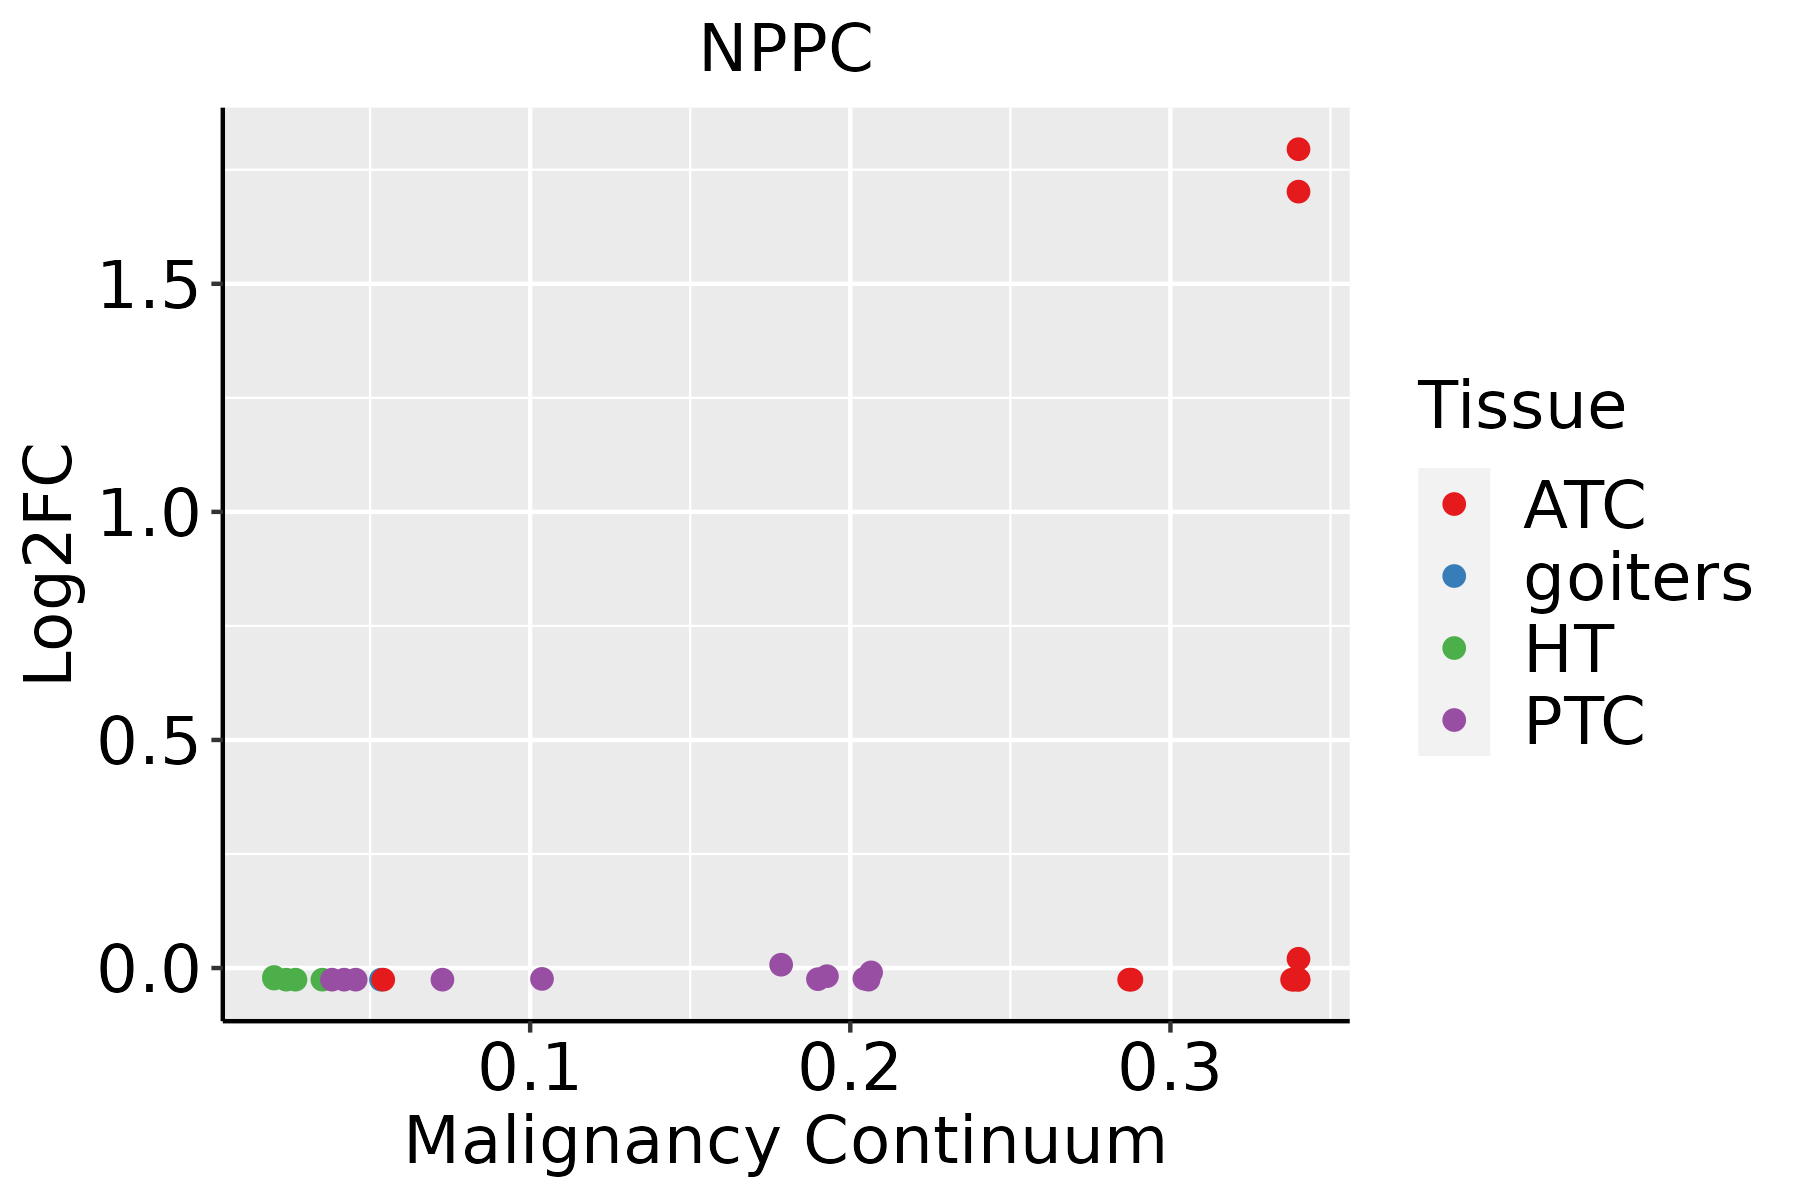 | ATC: Anaplastic thyroid cancer |
| HT: Hashimoto's thyroiditis | ||
| PTC: Papillary thyroid cancer |
| ∗log2FC in expression of this searched gene in stem-like cells from each diseased tissue sample relative to stem-like cells in normal samples in each tissue plotted against the malignancy continuum. Samples are colored based on if they are from different disease stage. |
Top |
Malignant transformation related pathway analysis |
| Find out the enriched GO biological processes and KEGG pathways involved in transition from healthy to precancer to cancer |
| Tissue | Disease Stage | Enriched GO biological Processes |
| Colorectum | AD |  |
| Colorectum | SER |  |
| Colorectum | MSS |  |
| Colorectum | MSI-H |  |
| Colorectum | FAP |  |
| ∗Top 15 enriched GO BP terms are showed in the bar plot of each disease state in each tissue. Each row represents a significant GO biological process which is colored according to the -log10(p.adjust). |
| Page: 1 2 3 4 5 6 7 8 9 |
| GO ID | Tissue | Disease Stage | Description | Gene Ratio | Bg Ratio | pvalue | p.adjust | Count |
| GO:005105210 | Oral cavity | OSCC | regulation of DNA metabolic process | 207/7305 | 359/18723 | 4.45e-13 | 2.17e-11 | 207 |
| GO:007048219 | Oral cavity | OSCC | response to oxygen levels | 200/7305 | 347/18723 | 1.17e-12 | 5.13e-11 | 200 |
| GO:000166619 | Oral cavity | OSCC | response to hypoxia | 177/7305 | 307/18723 | 2.21e-11 | 7.50e-10 | 177 |
| GO:003629319 | Oral cavity | OSCC | response to decreased oxygen levels | 182/7305 | 322/18723 | 1.14e-10 | 3.41e-09 | 182 |
| GO:00457864 | Oral cavity | OSCC | negative regulation of cell cycle | 206/7305 | 385/18723 | 4.28e-09 | 9.55e-08 | 206 |
| GO:00718979 | Oral cavity | OSCC | DNA biosynthetic process | 106/7305 | 180/18723 | 4.86e-08 | 8.95e-07 | 106 |
| GO:200027817 | Oral cavity | OSCC | regulation of DNA biosynthetic process | 67/7305 | 106/18723 | 3.85e-07 | 5.75e-06 | 67 |
| GO:000675318 | Oral cavity | OSCC | nucleoside phosphate metabolic process | 247/7305 | 497/18723 | 6.28e-07 | 8.96e-06 | 247 |
| GO:000911719 | Oral cavity | OSCC | nucleotide metabolic process | 243/7305 | 489/18723 | 7.80e-07 | 1.09e-05 | 243 |
| GO:001969319 | Oral cavity | OSCC | ribose phosphate metabolic process | 199/7305 | 396/18723 | 2.97e-06 | 3.64e-05 | 199 |
| GO:000150310 | Oral cavity | OSCC | ossification | 203/7305 | 408/18723 | 5.54e-06 | 6.19e-05 | 203 |
| GO:00097918 | Oral cavity | OSCC | post-embryonic development | 51/7305 | 80/18723 | 6.43e-06 | 7.13e-05 | 51 |
| GO:000925919 | Oral cavity | OSCC | ribonucleotide metabolic process | 189/7305 | 385/18723 | 3.18e-05 | 2.87e-04 | 189 |
| GO:000941018 | Oral cavity | OSCC | response to xenobiotic stimulus | 222/7305 | 462/18723 | 4.00e-05 | 3.48e-04 | 222 |
| GO:000164910 | Oral cavity | OSCC | osteoblast differentiation | 118/7305 | 229/18723 | 7.51e-05 | 5.85e-04 | 118 |
| GO:007252120 | Oral cavity | OSCC | purine-containing compound metabolic process | 199/7305 | 416/18723 | 1.34e-04 | 9.53e-04 | 199 |
| GO:000915020 | Oral cavity | OSCC | purine ribonucleotide metabolic process | 178/7305 | 368/18723 | 1.45e-04 | 1.02e-03 | 178 |
| GO:009730519 | Oral cavity | OSCC | response to alcohol | 127/7305 | 253/18723 | 1.81e-04 | 1.24e-03 | 127 |
| GO:000616320 | Oral cavity | OSCC | purine nucleotide metabolic process | 188/7305 | 396/18723 | 3.31e-04 | 2.04e-03 | 188 |
| GO:19012938 | Oral cavity | OSCC | nucleoside phosphate biosynthetic process | 125/7305 | 256/18723 | 8.32e-04 | 4.41e-03 | 125 |
| Page: 1 2 3 4 5 6 7 8 9 10 |
| Pathway ID | Tissue | Disease Stage | Description | Gene Ratio | Bg Ratio | pvalue | p.adjust | qvalue | Count |
| hsa05418211 | Esophagus | ESCC | Fluid shear stress and atherosclerosis | 109/4205 | 139/8465 | 2.00e-12 | 3.72e-11 | 1.90e-11 | 109 |
| hsa05418310 | Esophagus | ESCC | Fluid shear stress and atherosclerosis | 109/4205 | 139/8465 | 2.00e-12 | 3.72e-11 | 1.90e-11 | 109 |
| hsa0541830 | Oral cavity | OSCC | Fluid shear stress and atherosclerosis | 92/3704 | 139/8465 | 6.51e-08 | 4.84e-07 | 2.47e-07 | 92 |
| hsa05418114 | Oral cavity | OSCC | Fluid shear stress and atherosclerosis | 92/3704 | 139/8465 | 6.51e-08 | 4.84e-07 | 2.47e-07 | 92 |
| hsa0541828 | Prostate | BPH | Fluid shear stress and atherosclerosis | 58/1718 | 139/8465 | 5.48e-09 | 7.24e-08 | 4.48e-08 | 58 |
| hsa05418113 | Prostate | BPH | Fluid shear stress and atherosclerosis | 58/1718 | 139/8465 | 5.48e-09 | 7.24e-08 | 4.48e-08 | 58 |
| Page: 1 |
Top |
Cell-cell communication analysis |
| Identification of potential cell-cell interactions between two cell types and their ligand-receptor pairs for different disease states |
| Ligand | Receptor | LRpair | Pathway | Tissue | Disease Stage |
| Page: 1 |
Top |
Single-cell gene regulatory network inference analysis |
| Find out the significant the regulons (TFs) and the target genes of each regulon across cell types for different disease states |
| TF | Cell Type | Tissue | Disease Stage | Target Gene | RSS | Regulon Activity |
| ∗The dot plots of a searched regulon are shown for all cell subpopulations in each disease state of each tissue based on the regulon specific score inferred using pySCENIC and by calculating the average expression. |
| Page: 1 |
Top |
Somatic mutation of malignant transformation related genes |
| Annotation of somatic variants for genes involved in malignant transformation |
| Hugo Symbol | Variant Class | Variant Classification | dbSNP RS | HGVSc | HGVSp | HGVSp Short | SWISSPROT | BIOTYPE | SIFT | PolyPhen | Tumor Sample Barcode | Tissue | Histology | Sex | Age | Stage | Therapy Types | Drugs | Outcome |
| NPPC | insertion | Frame_Shift_Ins | novel | c.332_333insT | p.Gly112ArgfsTer32 | p.G112Rfs*32 | P23582 | protein_coding | TCGA-AD-6889-01 | Colorectum | colon adenocarcinoma | Male | >=65 | I/II | Chemotherapy | xeloda | PD | ||
| NPPC | SNV | Missense_Mutation | novel | c.233N>G | p.Asp78Gly | p.D78G | P23582 | protein_coding | deleterious(0.01) | possibly_damaging(0.736) | TCGA-EO-A22U-01 | Endometrium | uterine corpus endometrioid carcinoma | Female | >=65 | I/II | Unknown | Unknown | SD |
| NPPC | SNV | Missense_Mutation | c.176N>C | p.Gly59Ala | p.G59A | P23582 | protein_coding | tolerated(0.16) | benign(0.01) | TCGA-55-A491-01 | Lung | lung adenocarcinoma | Female | >=65 | I/II | Unknown | Unknown | SD | |
| NPPC | SNV | Missense_Mutation | c.370N>A | p.Leu124Met | p.L124M | P23582 | protein_coding | tolerated(0.39) | possibly_damaging(0.737) | TCGA-55-A493-01 | Lung | lung adenocarcinoma | Female | <65 | I/II | Unknown | Unknown | SD | |
| NPPC | insertion | Frame_Shift_Ins | novel | c.104_105insC | p.Pro36AlafsTer108 | p.P36Afs*108 | P23582 | protein_coding | TCGA-BA-5151-01 | Oral cavity | head & neck squamous cell carcinoma | Male | >=65 | I/II | Unknown | Unknown | PD | ||
| NPPC | SNV | Missense_Mutation | novel | c.251N>T | p.Ala84Val | p.A84V | P23582 | protein_coding | tolerated(0.11) | benign(0.01) | TCGA-VQ-A924-01 | Stomach | stomach adenocarcinoma | Male | >=65 | I/II | Unknown | Unknown | PD |
| Page: 1 |
Top |
Related drugs of malignant transformation related genes |
| Identification of chemicals and drugs interact with genes involved in malignant transfromation |
| (DGIdb 4.0) |
| Entrez ID | Symbol | Category | Interaction Types | Drug Claim Name | Drug Name | PMIDs |
| 4880 | NPPC | DRUGGABLE GENOME, HORMONE ACTIVITY | PMA | 8879350 | ||
| 4880 | NPPC | DRUGGABLE GENOME, HORMONE ACTIVITY | IMMUNOMODULATORS | 7769089 | ||
| 4880 | NPPC | DRUGGABLE GENOME, HORMONE ACTIVITY | ANDROSTENEDIONE | ANDROSTENEDIONE | 8404664 | |
| 4880 | NPPC | DRUGGABLE GENOME, HORMONE ACTIVITY | DES | DIETHYLSTILBESTROL | 10650935 | |
| 4880 | NPPC | DRUGGABLE GENOME, HORMONE ACTIVITY | CORTISOL | HYDROCORTISONE | 7716064 | |
| 4880 | NPPC | DRUGGABLE GENOME, HORMONE ACTIVITY | DEXAMETHASONE | DEXAMETHASONE | 10468226 | |
| 4880 | NPPC | DRUGGABLE GENOME, HORMONE ACTIVITY | ETHER | ETHER | 9721940 | |
| 4880 | NPPC | DRUGGABLE GENOME, HORMONE ACTIVITY | ANTISERUM | 1827257 | ||
| 4880 | NPPC | DRUGGABLE GENOME, HORMONE ACTIVITY | PROGESTERONE | PROGESTERONE | 8404664 | |
| 4880 | NPPC | DRUGGABLE GENOME, HORMONE ACTIVITY | HORMONES | 11445246 |
| Page: 1 2 |

Copyright 2023-Present -The University of Texas Health Science Center at Houston |