
|
|||||
|
 | |
| |
| |
| |
| |
| |
|
Gene: NID1 |
Gene summary for NID1 |
| Gene information | Species | Human | Gene symbol | NID1 | Gene ID | 4811 |
| Gene name | nidogen 1 | |
| Gene Alias | NID | |
| Cytomap | 1q42.3 | |
| Gene Type | protein-coding | GO ID | GO:0001655 | UniProtAcc | P14543 |
Top |
Malignant transformation analysis |
| Identification of the aberrant gene expression in precancerous and cancerous lesions by comparing the gene expression of stem-like cells in diseased tissues with normal stem cells |
| Entrez ID | Symbol | Replicates | Species | Organ | Tissue | Adj P-value | Log2FC | Malignancy |
| 4811 | NID1 | LZE4T | Human | Esophagus | ESCC | 4.52e-04 | 1.76e-01 | 0.0811 |
| 4811 | NID1 | P2T-E | Human | Esophagus | ESCC | 7.21e-39 | 7.71e-01 | 0.1177 |
| 4811 | NID1 | P5T-E | Human | Esophagus | ESCC | 1.75e-08 | 1.53e-01 | 0.1327 |
| 4811 | NID1 | P8T-E | Human | Esophagus | ESCC | 1.37e-02 | 1.48e-01 | 0.0889 |
| 4811 | NID1 | P9T-E | Human | Esophagus | ESCC | 1.37e-03 | 2.73e-01 | 0.1131 |
| 4811 | NID1 | P10T-E | Human | Esophagus | ESCC | 1.83e-52 | 1.08e+00 | 0.116 |
| 4811 | NID1 | P11T-E | Human | Esophagus | ESCC | 4.87e-07 | 2.29e-01 | 0.1426 |
| 4811 | NID1 | P12T-E | Human | Esophagus | ESCC | 1.60e-14 | 2.22e-01 | 0.1122 |
| 4811 | NID1 | P15T-E | Human | Esophagus | ESCC | 8.88e-09 | 3.54e-01 | 0.1149 |
| 4811 | NID1 | P16T-E | Human | Esophagus | ESCC | 6.07e-56 | 1.23e+00 | 0.1153 |
| 4811 | NID1 | P19T-E | Human | Esophagus | ESCC | 1.28e-03 | 4.26e-01 | 0.1662 |
| 4811 | NID1 | P22T-E | Human | Esophagus | ESCC | 2.66e-16 | 3.06e-01 | 0.1236 |
| 4811 | NID1 | P26T-E | Human | Esophagus | ESCC | 2.93e-15 | 3.64e-01 | 0.1276 |
| 4811 | NID1 | P27T-E | Human | Esophagus | ESCC | 6.35e-05 | 1.04e-01 | 0.1055 |
| 4811 | NID1 | P31T-E | Human | Esophagus | ESCC | 2.32e-21 | 3.95e-01 | 0.1251 |
| 4811 | NID1 | P32T-E | Human | Esophagus | ESCC | 5.02e-24 | 4.92e-01 | 0.1666 |
| 4811 | NID1 | P36T-E | Human | Esophagus | ESCC | 1.10e-03 | 3.91e-01 | 0.1187 |
| 4811 | NID1 | P37T-E | Human | Esophagus | ESCC | 5.64e-26 | 7.74e-01 | 0.1371 |
| 4811 | NID1 | P42T-E | Human | Esophagus | ESCC | 3.57e-09 | 4.78e-01 | 0.1175 |
| 4811 | NID1 | P44T-E | Human | Esophagus | ESCC | 3.91e-04 | 3.45e-01 | 0.1096 |
| Page: 1 2 3 |
| Tissue | Expression Dynamics | Abbreviation |
| Esophagus | 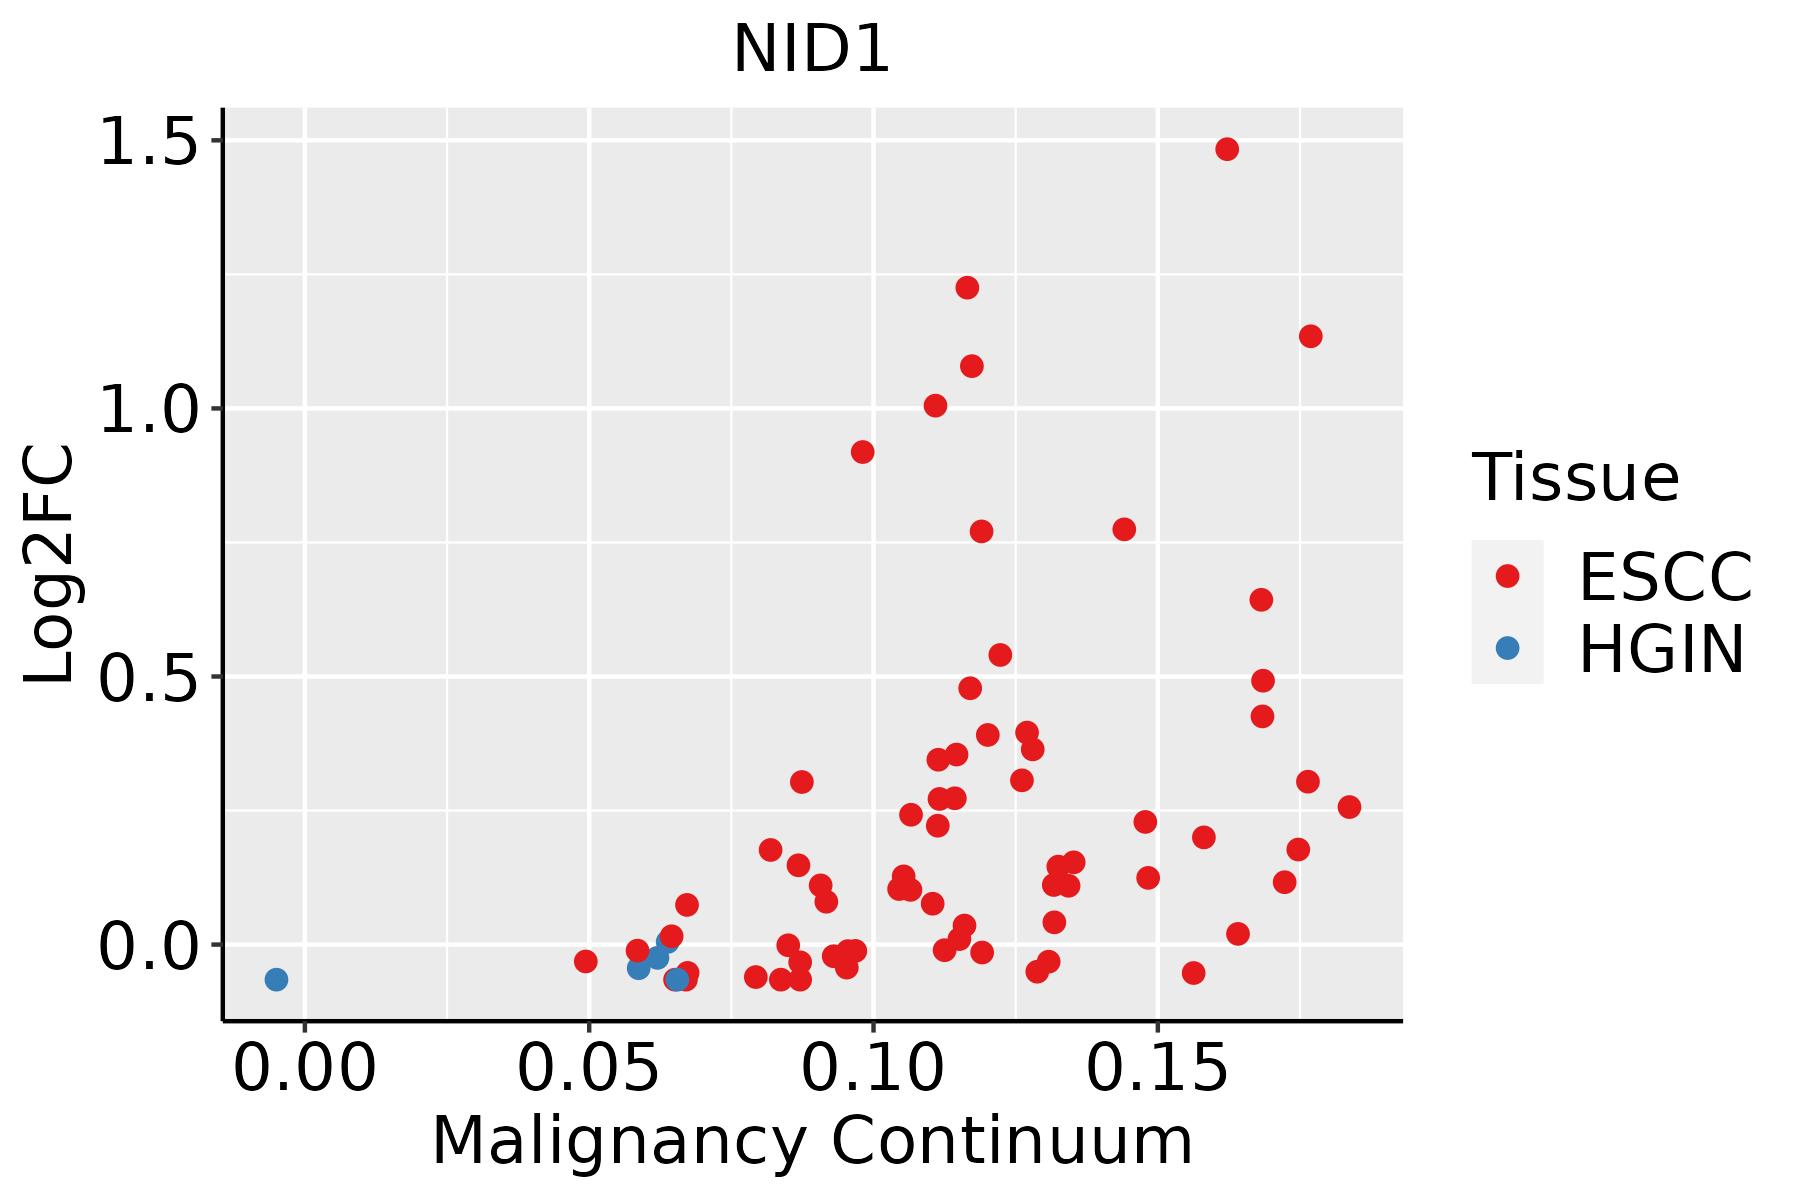 | ESCC: Esophageal squamous cell carcinoma |
| HGIN: High-grade intraepithelial neoplasias | ||
| LGIN: Low-grade intraepithelial neoplasias | ||
| Liver | 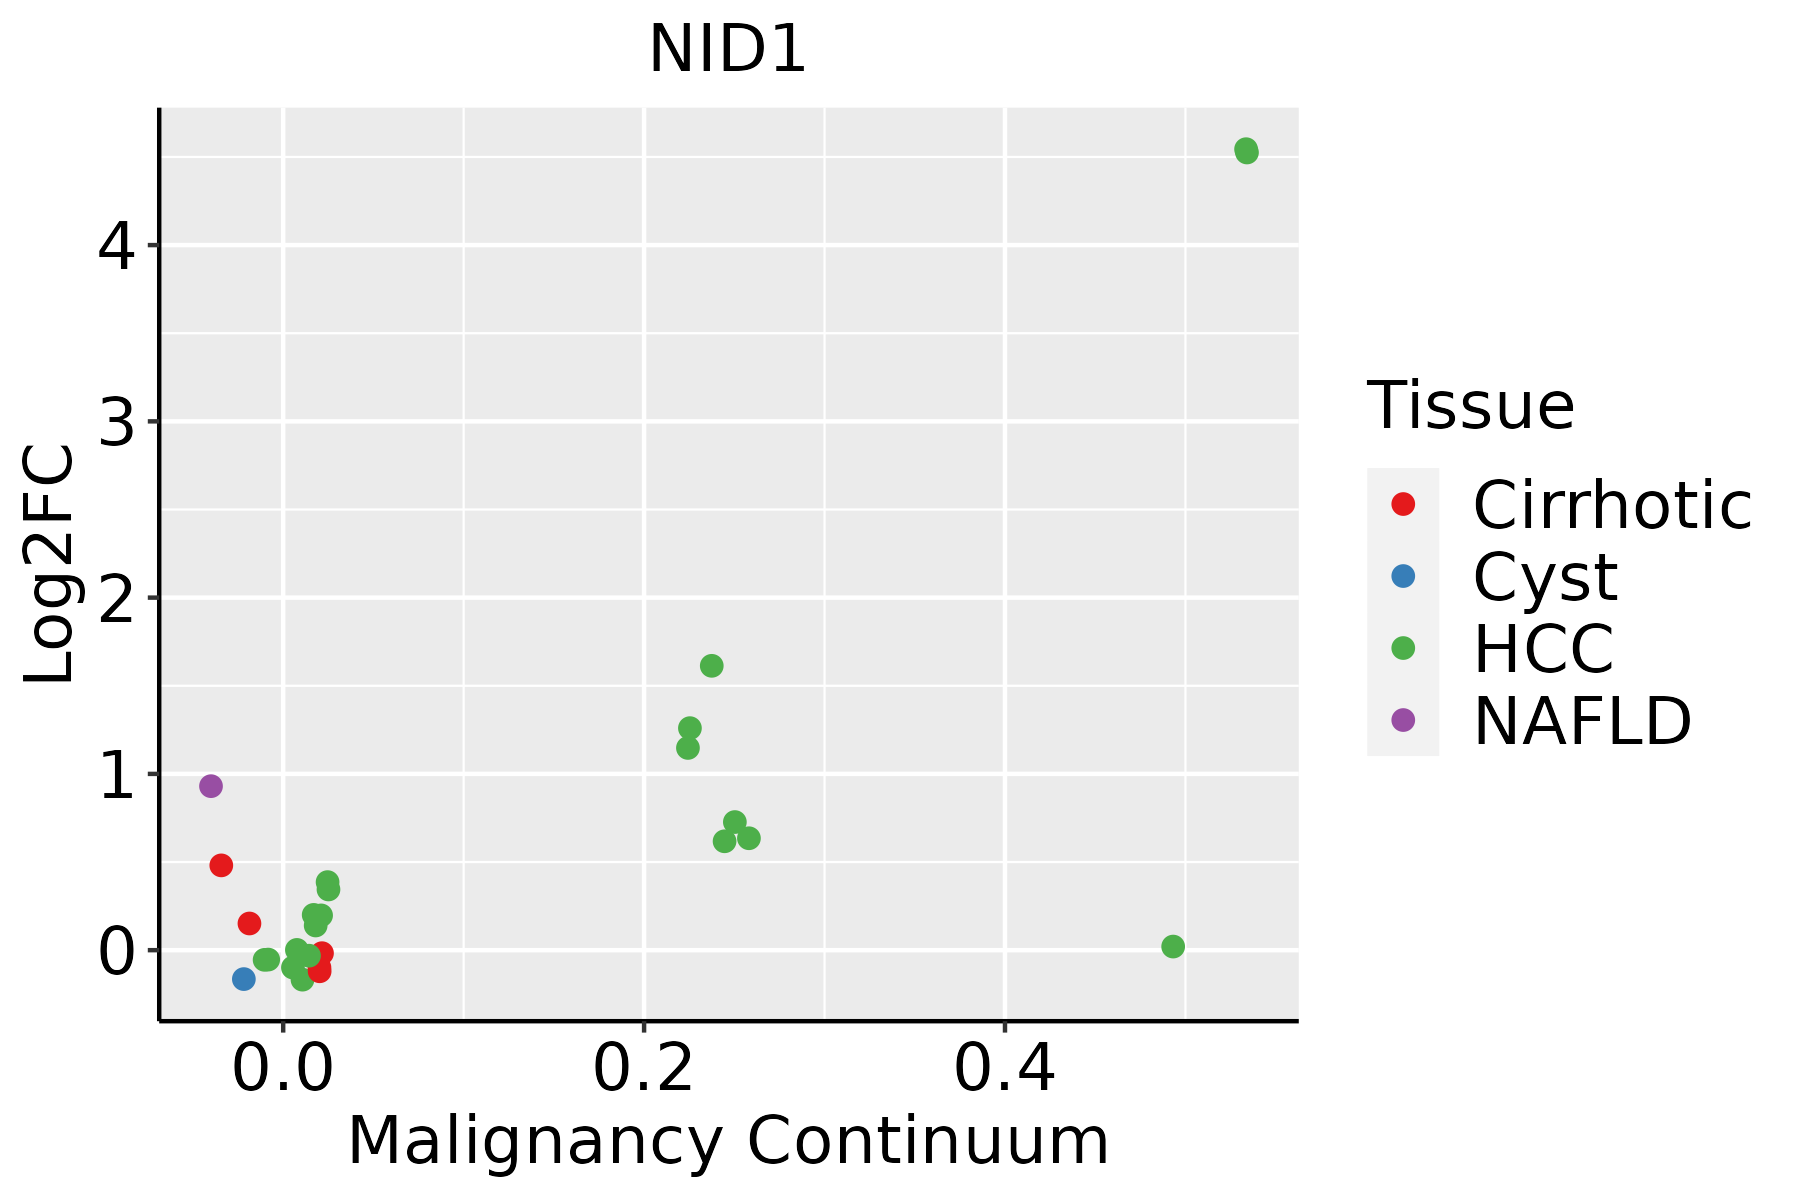 | HCC: Hepatocellular carcinoma |
| NAFLD: Non-alcoholic fatty liver disease | ||
| Thyroid |  | ATC: Anaplastic thyroid cancer |
| HT: Hashimoto's thyroiditis | ||
| PTC: Papillary thyroid cancer |
| ∗log2FC in expression of this searched gene in stem-like cells from each diseased tissue sample relative to stem-like cells in normal samples in each tissue plotted against the malignancy continuum. Samples are colored based on if they are from different disease stage. |
Top |
Malignant transformation related pathway analysis |
| Find out the enriched GO biological processes and KEGG pathways involved in transition from healthy to precancer to cancer |
| Tissue | Disease Stage | Enriched GO biological Processes |
| Colorectum | AD |  |
| Colorectum | SER |  |
| Colorectum | MSS |  |
| Colorectum | MSI-H |  |
| Colorectum | FAP |  |
| ∗Top 15 enriched GO BP terms are showed in the bar plot of each disease state in each tissue. Each row represents a significant GO biological process which is colored according to the -log10(p.adjust). |
| Page: 1 2 3 4 5 6 7 8 9 |
| GO ID | Tissue | Disease Stage | Description | Gene Ratio | Bg Ratio | pvalue | p.adjust | Count |
| GO:00328364 | Thyroid | PTC | glomerular basement membrane development | 9/5968 | 11/18723 | 9.49e-04 | 5.70e-03 | 9 |
| GO:00720067 | Thyroid | PTC | nephron development | 61/5968 | 142/18723 | 3.49e-03 | 1.69e-02 | 61 |
| GO:00328356 | Thyroid | PTC | glomerulus development | 29/5968 | 62/18723 | 9.96e-03 | 4.07e-02 | 29 |
| GO:003158928 | Thyroid | ATC | cell-substrate adhesion | 195/6293 | 363/18723 | 1.58e-15 | 1.17e-13 | 195 |
| GO:001081029 | Thyroid | ATC | regulation of cell-substrate adhesion | 128/6293 | 221/18723 | 8.74e-14 | 4.57e-12 | 128 |
| GO:0007160111 | Thyroid | ATC | cell-matrix adhesion | 128/6293 | 233/18723 | 1.49e-11 | 5.41e-10 | 128 |
| GO:003019812 | Thyroid | ATC | extracellular matrix organization | 152/6293 | 301/18723 | 8.63e-10 | 2.24e-08 | 152 |
| GO:004306212 | Thyroid | ATC | extracellular structure organization | 152/6293 | 302/18723 | 1.17e-09 | 2.94e-08 | 152 |
| GO:004522912 | Thyroid | ATC | external encapsulating structure organization | 152/6293 | 304/18723 | 2.11e-09 | 5.08e-08 | 152 |
| GO:0010811210 | Thyroid | ATC | positive regulation of cell-substrate adhesion | 73/6293 | 123/18723 | 4.12e-09 | 9.37e-08 | 73 |
| GO:000182222 | Thyroid | ATC | kidney development | 146/6293 | 293/18723 | 5.81e-09 | 1.28e-07 | 146 |
| GO:000165522 | Thyroid | ATC | urogenital system development | 164/6293 | 338/18723 | 7.92e-09 | 1.70e-07 | 164 |
| GO:007200122 | Thyroid | ATC | renal system development | 149/6293 | 302/18723 | 9.48e-09 | 1.99e-07 | 149 |
| GO:0045785210 | Thyroid | ATC | positive regulation of cell adhesion | 194/6293 | 437/18723 | 1.40e-06 | 1.75e-05 | 194 |
| GO:007200614 | Thyroid | ATC | nephron development | 69/6293 | 142/18723 | 1.50e-04 | 1.04e-03 | 69 |
| GO:007171113 | Thyroid | ATC | basement membrane organization | 20/6293 | 31/18723 | 4.20e-04 | 2.51e-03 | 20 |
| GO:003283512 | Thyroid | ATC | glomerulus development | 31/6293 | 62/18723 | 5.52e-03 | 2.24e-02 | 31 |
| Page: 1 2 3 |
| Pathway ID | Tissue | Disease Stage | Description | Gene Ratio | Bg Ratio | pvalue | p.adjust | qvalue | Count |
| Page: 1 |
Top |
Cell-cell communication analysis |
| Identification of potential cell-cell interactions between two cell types and their ligand-receptor pairs for different disease states |
| Ligand | Receptor | LRpair | Pathway | Tissue | Disease Stage |
| Page: 1 |
Top |
Single-cell gene regulatory network inference analysis |
| Find out the significant the regulons (TFs) and the target genes of each regulon across cell types for different disease states |
| TF | Cell Type | Tissue | Disease Stage | Target Gene | RSS | Regulon Activity |
| ∗The dot plots of a searched regulon are shown for all cell subpopulations in each disease state of each tissue based on the regulon specific score inferred using pySCENIC and by calculating the average expression. |
| Page: 1 |
Top |
Somatic mutation of malignant transformation related genes |
| Annotation of somatic variants for genes involved in malignant transformation |
| Hugo Symbol | Variant Class | Variant Classification | dbSNP RS | HGVSc | HGVSp | HGVSp Short | SWISSPROT | BIOTYPE | SIFT | PolyPhen | Tumor Sample Barcode | Tissue | Histology | Sex | Age | Stage | Therapy Types | Drugs | Outcome |
| NID1 | SNV | Missense_Mutation | novel | c.724N>A | p.Asp242Asn | p.D242N | P14543 | protein_coding | tolerated(0.18) | benign(0.038) | TCGA-3C-AALI-01 | Breast | breast invasive carcinoma | Female | <65 | I/II | Unspecific | Poly E | Complete Response |
| NID1 | SNV | Missense_Mutation | rs765670423 | c.1219G>A | p.Ala407Thr | p.A407T | P14543 | protein_coding | tolerated(0.4) | benign(0) | TCGA-A2-A0CP-01 | Breast | breast invasive carcinoma | Female | <65 | I/II | Chemotherapy | cytoxan | SD |
| NID1 | SNV | Missense_Mutation | rs765549848 | c.520N>C | p.Gly174Arg | p.G174R | P14543 | protein_coding | tolerated(0.28) | benign(0.011) | TCGA-A8-A06X-01 | Breast | breast invasive carcinoma | Female | >=65 | I/II | Unknown | Unknown | SD |
| NID1 | SNV | Missense_Mutation | c.1074G>C | p.Glu358Asp | p.E358D | P14543 | protein_coding | tolerated(0.27) | benign(0.003) | TCGA-AC-A23H-01 | Breast | breast invasive carcinoma | Female | >=65 | I/II | Unknown | Unknown | PD | |
| NID1 | SNV | Missense_Mutation | c.766N>A | p.Gly256Arg | p.G256R | P14543 | protein_coding | deleterious(0) | probably_damaging(0.996) | TCGA-AN-A0G0-01 | Breast | breast invasive carcinoma | Female | <65 | I/II | Unknown | Unknown | SD | |
| NID1 | SNV | Missense_Mutation | c.952N>G | p.Leu318Val | p.L318V | P14543 | protein_coding | tolerated(0.45) | benign(0) | TCGA-AO-A0J6-01 | Breast | breast invasive carcinoma | Female | <65 | I/II | Chemotherapy | doxorubicin | SD | |
| NID1 | SNV | Missense_Mutation | rs771262101 | c.2423N>A | p.Pro808Gln | p.P808Q | P14543 | protein_coding | tolerated(0.6) | benign(0.003) | TCGA-AR-A1AY-01 | Breast | breast invasive carcinoma | Female | >=65 | I/II | Unspecific | Doxorubicin | SD |
| NID1 | SNV | Missense_Mutation | c.388A>G | p.Ile130Val | p.I130V | P14543 | protein_coding | tolerated(1) | benign(0) | TCGA-AR-A24Q-01 | Breast | breast invasive carcinoma | Female | <65 | I/II | Chemotherapy | doxorubicin | SD | |
| NID1 | SNV | Missense_Mutation | novel | c.2639N>A | p.Ala880Glu | p.A880E | P14543 | protein_coding | tolerated(1) | benign(0.001) | TCGA-B6-A40C-01 | Breast | breast invasive carcinoma | Female | <65 | I/II | Hormone Therapy | cyclophosphamide | SD |
| NID1 | SNV | Missense_Mutation | rs202192927 | c.326N>T | p.Ala109Val | p.A109V | P14543 | protein_coding | tolerated(0.08) | benign(0.067) | TCGA-BH-A0HA-01 | Breast | breast invasive carcinoma | Female | <65 | I/II | Unknown | Unknown | SD |
| Page: 1 2 3 4 5 6 7 8 9 10 11 12 13 14 15 16 17 18 19 20 |
Top |
Related drugs of malignant transformation related genes |
| Identification of chemicals and drugs interact with genes involved in malignant transfromation |
| (DGIdb 4.0) |
| Entrez ID | Symbol | Category | Interaction Types | Drug Claim Name | Drug Name | PMIDs |
| Page: 1 |

Copyright 2023-Present -The University of Texas Health Science Center at Houston |