
|
|||||
|
 | |
| |
| |
| |
| |
| |
|
Gene: NEK1 |
Gene summary for NEK1 |
| Gene information | Species | Human | Gene symbol | NEK1 | Gene ID | 4750 |
| Gene name | NIMA related kinase 1 | |
| Gene Alias | ALS24 | |
| Cytomap | 4q33 | |
| Gene Type | protein-coding | GO ID | GO:0006464 | UniProtAcc | Q96PY6 |
Top |
Malignant transformation analysis |
| Identification of the aberrant gene expression in precancerous and cancerous lesions by comparing the gene expression of stem-like cells in diseased tissues with normal stem cells |
| Entrez ID | Symbol | Replicates | Species | Organ | Tissue | Adj P-value | Log2FC | Malignancy |
| 4750 | NEK1 | LZE4T | Human | Esophagus | ESCC | 8.72e-12 | 3.92e-01 | 0.0811 |
| 4750 | NEK1 | LZE7T | Human | Esophagus | ESCC | 2.09e-02 | 1.74e-01 | 0.0667 |
| 4750 | NEK1 | LZE8T | Human | Esophagus | ESCC | 3.25e-07 | 1.44e-01 | 0.067 |
| 4750 | NEK1 | LZE24T | Human | Esophagus | ESCC | 4.66e-06 | 1.62e-01 | 0.0596 |
| 4750 | NEK1 | P2T-E | Human | Esophagus | ESCC | 3.44e-34 | 5.23e-01 | 0.1177 |
| 4750 | NEK1 | P4T-E | Human | Esophagus | ESCC | 6.34e-10 | 2.77e-01 | 0.1323 |
| 4750 | NEK1 | P5T-E | Human | Esophagus | ESCC | 2.37e-06 | 9.91e-02 | 0.1327 |
| 4750 | NEK1 | P8T-E | Human | Esophagus | ESCC | 2.39e-08 | 1.16e-01 | 0.0889 |
| 4750 | NEK1 | P9T-E | Human | Esophagus | ESCC | 9.92e-10 | 2.99e-01 | 0.1131 |
| 4750 | NEK1 | P10T-E | Human | Esophagus | ESCC | 2.67e-11 | 1.49e-01 | 0.116 |
| 4750 | NEK1 | P11T-E | Human | Esophagus | ESCC | 2.44e-10 | 3.71e-01 | 0.1426 |
| 4750 | NEK1 | P12T-E | Human | Esophagus | ESCC | 1.80e-32 | 6.00e-01 | 0.1122 |
| 4750 | NEK1 | P15T-E | Human | Esophagus | ESCC | 1.45e-14 | 2.84e-01 | 0.1149 |
| 4750 | NEK1 | P16T-E | Human | Esophagus | ESCC | 3.59e-23 | 4.22e-01 | 0.1153 |
| 4750 | NEK1 | P17T-E | Human | Esophagus | ESCC | 3.61e-05 | 2.43e-01 | 0.1278 |
| 4750 | NEK1 | P19T-E | Human | Esophagus | ESCC | 4.84e-02 | 2.26e-01 | 0.1662 |
| 4750 | NEK1 | P20T-E | Human | Esophagus | ESCC | 1.06e-06 | 1.57e-01 | 0.1124 |
| 4750 | NEK1 | P21T-E | Human | Esophagus | ESCC | 3.45e-13 | 1.36e-01 | 0.1617 |
| 4750 | NEK1 | P22T-E | Human | Esophagus | ESCC | 7.29e-11 | 2.12e-01 | 0.1236 |
| 4750 | NEK1 | P23T-E | Human | Esophagus | ESCC | 2.40e-06 | 9.92e-02 | 0.108 |
| Page: 1 2 3 4 |
| Tissue | Expression Dynamics | Abbreviation |
| Esophagus |  | ESCC: Esophageal squamous cell carcinoma |
| HGIN: High-grade intraepithelial neoplasias | ||
| LGIN: Low-grade intraepithelial neoplasias | ||
| Liver | 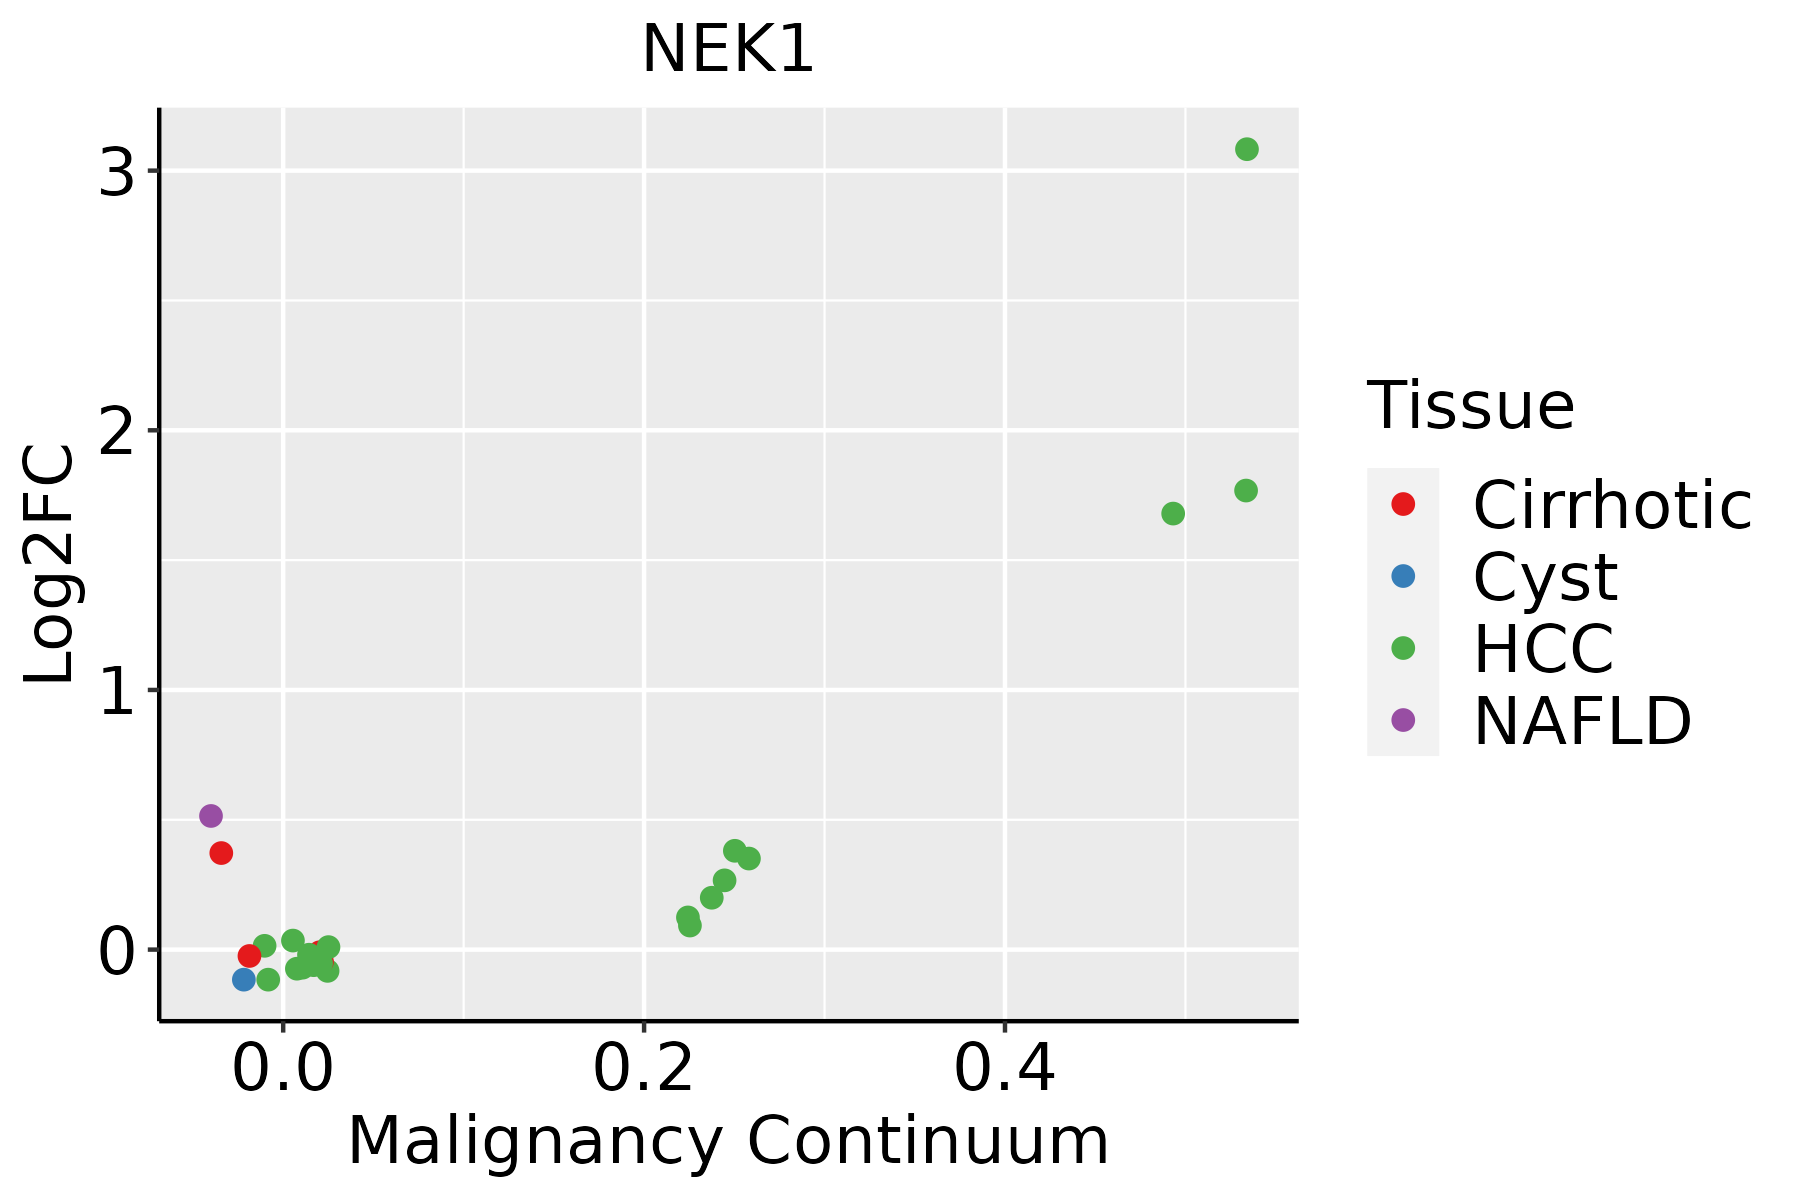 | HCC: Hepatocellular carcinoma |
| NAFLD: Non-alcoholic fatty liver disease |
| ∗log2FC in expression of this searched gene in stem-like cells from each diseased tissue sample relative to stem-like cells in normal samples in each tissue plotted against the malignancy continuum. Samples are colored based on if they are from different disease stage. |
Top |
Malignant transformation related pathway analysis |
| Find out the enriched GO biological processes and KEGG pathways involved in transition from healthy to precancer to cancer |
| Tissue | Disease Stage | Enriched GO biological Processes |
| Colorectum | AD |  |
| Colorectum | SER |  |
| Colorectum | MSS |  |
| Colorectum | MSI-H |  |
| Colorectum | FAP |  |
| ∗Top 15 enriched GO BP terms are showed in the bar plot of each disease state in each tissue. Each row represents a significant GO biological process which is colored according to the -log10(p.adjust). |
| Page: 1 2 3 4 5 6 7 8 9 |
| GO ID | Tissue | Disease Stage | Description | Gene Ratio | Bg Ratio | pvalue | p.adjust | Count |
| GO:00447732 | Lung | MIAC | mitotic DNA damage checkpoint | 13/967 | 81/18723 | 2.46e-04 | 8.13e-03 | 13 |
| GO:00447742 | Lung | MIAC | mitotic DNA integrity checkpoint | 13/967 | 85/18723 | 4.00e-04 | 1.16e-02 | 13 |
| GO:00000772 | Lung | MIAC | DNA damage checkpoint | 15/967 | 115/18723 | 8.47e-04 | 1.83e-02 | 15 |
| GO:00315702 | Lung | MIAC | DNA integrity checkpoint | 15/967 | 123/18723 | 1.69e-03 | 2.84e-02 | 15 |
| GO:00070931 | Lung | MIAC | mitotic cell cycle checkpoint | 15/967 | 129/18723 | 2.71e-03 | 3.75e-02 | 15 |
| GO:190198711 | Lung | MIAC | regulation of cell cycle phase transition | 33/967 | 390/18723 | 3.79e-03 | 4.68e-02 | 33 |
| Page: 1 2 3 |
| Pathway ID | Tissue | Disease Stage | Description | Gene Ratio | Bg Ratio | pvalue | p.adjust | qvalue | Count |
| Page: 1 |
Top |
Cell-cell communication analysis |
| Identification of potential cell-cell interactions between two cell types and their ligand-receptor pairs for different disease states |
| Ligand | Receptor | LRpair | Pathway | Tissue | Disease Stage |
| Page: 1 |
Top |
Single-cell gene regulatory network inference analysis |
| Find out the significant the regulons (TFs) and the target genes of each regulon across cell types for different disease states |
| TF | Cell Type | Tissue | Disease Stage | Target Gene | RSS | Regulon Activity |
| ∗The dot plots of a searched regulon are shown for all cell subpopulations in each disease state of each tissue based on the regulon specific score inferred using pySCENIC and by calculating the average expression. |
| Page: 1 |
Top |
Somatic mutation of malignant transformation related genes |
| Annotation of somatic variants for genes involved in malignant transformation |
| Hugo Symbol | Variant Class | Variant Classification | dbSNP RS | HGVSc | HGVSp | HGVSp Short | SWISSPROT | BIOTYPE | SIFT | PolyPhen | Tumor Sample Barcode | Tissue | Histology | Sex | Age | Stage | Therapy Types | Drugs | Outcome |
| NEK1 | SNV | Missense_Mutation | novel | c.2695G>A | p.Glu899Lys | p.E899K | Q96PY6 | protein_coding | tolerated(0.1) | benign(0.311) | TCGA-AR-A2LE-01 | Breast | breast invasive carcinoma | Female | >=65 | I/II | Hormone Therapy | tamoxiphen | PD |
| NEK1 | SNV | Missense_Mutation | rs776493440 | c.2094N>A | p.Met698Ile | p.M698I | Q96PY6 | protein_coding | tolerated(0.52) | benign(0.001) | TCGA-AR-A2LN-01 | Breast | breast invasive carcinoma | Female | >=65 | I/II | Hormone Therapy | letrozole | SD |
| NEK1 | SNV | Missense_Mutation | c.1261N>A | p.Val421Ile | p.V421I | Q96PY6 | protein_coding | tolerated(0.32) | benign(0.015) | TCGA-BH-A0HF-01 | Breast | breast invasive carcinoma | Female | >=65 | I/II | Hormone Therapy | arimidex | SD | |
| NEK1 | deletion | Frame_Shift_Del | c.1457delG | p.Gly486AspfsTer22 | p.G486Dfs*22 | Q96PY6 | protein_coding | TCGA-BH-A0DH-01 | Breast | breast invasive carcinoma | Female | <65 | I/II | Chemotherapy | cyclophosphamide | SD | |||
| NEK1 | SNV | Missense_Mutation | novel | c.1697G>A | p.Gly566Glu | p.G566E | Q96PY6 | protein_coding | deleterious(0.01) | probably_damaging(0.993) | TCGA-C5-A7X5-01 | Cervix | cervical & endocervical cancer | Female | >=65 | I/II | Chemotherapy | carboplatin | PD |
| NEK1 | SNV | Missense_Mutation | rs764750478 | c.2305N>G | p.His769Asp | p.H769D | Q96PY6 | protein_coding | tolerated(0.23) | benign(0) | TCGA-IR-A3LA-01 | Cervix | cervical & endocervical cancer | Female | <65 | I/II | Chemotherapy | cisplatin | CR |
| NEK1 | SNV | Missense_Mutation | c.2305C>T | p.His769Tyr | p.H769Y | Q96PY6 | protein_coding | tolerated(0.88) | benign(0) | TCGA-VS-A9UD-01 | Cervix | cervical & endocervical cancer | Female | >=65 | III/IV | Chemotherapy | cisplatin | CR | |
| NEK1 | SNV | Missense_Mutation | novel | c.2911N>A | p.Glu971Lys | p.E971K | Q96PY6 | protein_coding | tolerated(0.27) | benign(0) | TCGA-ZJ-AAXU-01 | Cervix | cervical & endocervical cancer | Female | <65 | I/II | Unknown | Unknown | SD |
| NEK1 | insertion | Frame_Shift_Ins | novel | c.1897_1898insA | p.Ile633AsnfsTer28 | p.I633Nfs*28 | Q96PY6 | protein_coding | TCGA-EA-A3HS-01 | Cervix | cervical & endocervical cancer | Female | <65 | I/II | Unknown | Unknown | SD | ||
| NEK1 | SNV | Missense_Mutation | c.1562G>A | p.Arg521Lys | p.R521K | Q96PY6 | protein_coding | tolerated(0.08) | benign(0.053) | TCGA-AA-3488-01 | Colorectum | colon adenocarcinoma | Male | <65 | III/IV | Unknown | Unknown | PD |
| Page: 1 2 3 4 5 6 7 8 9 10 11 12 13 |
Top |
Related drugs of malignant transformation related genes |
| Identification of chemicals and drugs interact with genes involved in malignant transfromation |
| (DGIdb 4.0) |
| Entrez ID | Symbol | Category | Interaction Types | Drug Claim Name | Drug Name | PMIDs |
| 4750 | NEK1 | ENZYME, DRUGGABLE GENOME, KINASE, SERINE THREONINE KINASE, TYROSINE KINASE | inhibitor | 249565860 |
| Page: 1 |

Copyright 2023-Present -The University of Texas Health Science Center at Houston |