
|
|||||
|
 | |
| |
| |
| |
| |
| |
|
Gene: NCF1 |
Gene summary for NCF1 |
| Gene information | Species | Human | Gene symbol | NCF1 | Gene ID | 653361 |
| Gene name | neutrophil cytosolic factor 1 | |
| Gene Alias | CGD1 | |
| Cytomap | 7q11.23 | |
| Gene Type | protein-coding | GO ID | GO:0000165 | UniProtAcc | P14598 |
Top |
Malignant transformation analysis |
| Identification of the aberrant gene expression in precancerous and cancerous lesions by comparing the gene expression of stem-like cells in diseased tissues with normal stem cells |
| Entrez ID | Symbol | Replicates | Species | Organ | Tissue | Adj P-value | Log2FC | Malignancy |
| 653361 | NCF1 | LZE4T | Human | Esophagus | ESCC | 6.35e-03 | 1.21e-01 | 0.0811 |
| 653361 | NCF1 | LZE7T | Human | Esophagus | ESCC | 6.13e-07 | 3.01e-01 | 0.0667 |
| 653361 | NCF1 | LZE20T | Human | Esophagus | ESCC | 1.20e-05 | 3.32e-01 | 0.0662 |
| 653361 | NCF1 | LZE21D1 | Human | Esophagus | HGIN | 4.41e-04 | 2.97e-01 | 0.0632 |
| 653361 | NCF1 | LZE22T | Human | Esophagus | ESCC | 1.40e-06 | 4.90e-01 | 0.068 |
| 653361 | NCF1 | LZE24T | Human | Esophagus | ESCC | 5.13e-03 | 1.21e-01 | 0.0596 |
| 653361 | NCF1 | LZE21T | Human | Esophagus | ESCC | 6.52e-03 | 2.54e-01 | 0.0655 |
| 653361 | NCF1 | P1T-E | Human | Esophagus | ESCC | 3.50e-13 | 6.56e-01 | 0.0875 |
| 653361 | NCF1 | P4T-E | Human | Esophagus | ESCC | 1.26e-16 | 3.87e-01 | 0.1323 |
| 653361 | NCF1 | P5T-E | Human | Esophagus | ESCC | 1.35e-23 | 4.01e-01 | 0.1327 |
| 653361 | NCF1 | P8T-E | Human | Esophagus | ESCC | 3.75e-03 | 1.08e-01 | 0.0889 |
| 653361 | NCF1 | P9T-E | Human | Esophagus | ESCC | 2.41e-06 | 1.69e-01 | 0.1131 |
| 653361 | NCF1 | P12T-E | Human | Esophagus | ESCC | 1.25e-26 | 4.60e-01 | 0.1122 |
| 653361 | NCF1 | P15T-E | Human | Esophagus | ESCC | 3.26e-02 | 9.31e-02 | 0.1149 |
| 653361 | NCF1 | P21T-E | Human | Esophagus | ESCC | 4.41e-07 | 1.63e-01 | 0.1617 |
| 653361 | NCF1 | P22T-E | Human | Esophagus | ESCC | 1.88e-04 | 1.11e-01 | 0.1236 |
| 653361 | NCF1 | P23T-E | Human | Esophagus | ESCC | 9.87e-03 | 1.03e-01 | 0.108 |
| 653361 | NCF1 | P27T-E | Human | Esophagus | ESCC | 6.56e-15 | 2.72e-01 | 0.1055 |
| 653361 | NCF1 | P28T-E | Human | Esophagus | ESCC | 3.89e-12 | 2.92e-01 | 0.1149 |
| 653361 | NCF1 | P31T-E | Human | Esophagus | ESCC | 2.06e-08 | 2.00e-01 | 0.1251 |
| Page: 1 2 3 |
| Tissue | Expression Dynamics | Abbreviation |
| Esophagus | 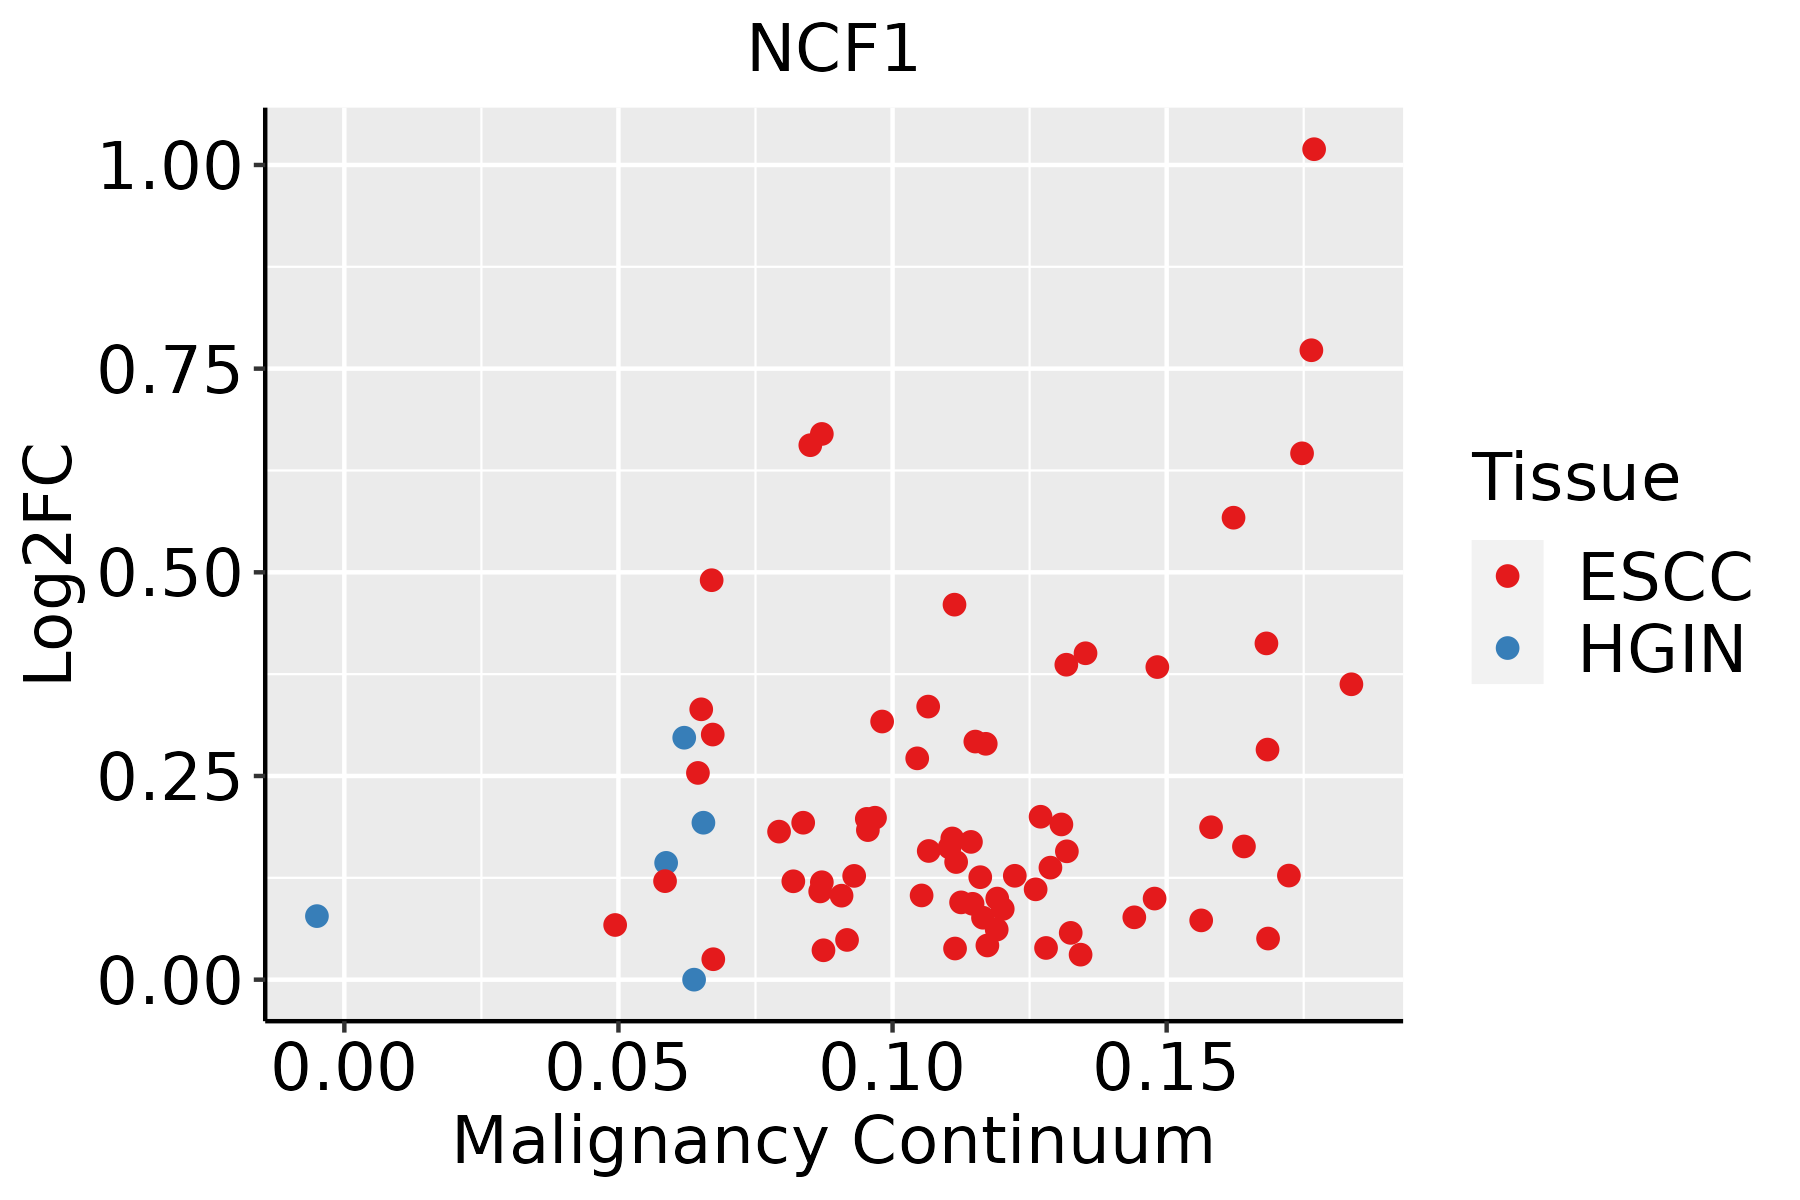 | ESCC: Esophageal squamous cell carcinoma |
| HGIN: High-grade intraepithelial neoplasias | ||
| LGIN: Low-grade intraepithelial neoplasias |
| ∗log2FC in expression of this searched gene in stem-like cells from each diseased tissue sample relative to stem-like cells in normal samples in each tissue plotted against the malignancy continuum. Samples are colored based on if they are from different disease stage. |
Top |
Malignant transformation related pathway analysis |
| Find out the enriched GO biological processes and KEGG pathways involved in transition from healthy to precancer to cancer |
| Tissue | Disease Stage | Enriched GO biological Processes |
| Colorectum | AD |  |
| Colorectum | SER |  |
| Colorectum | MSS |  |
| Colorectum | MSI-H |  |
| Colorectum | FAP |  |
| ∗Top 15 enriched GO BP terms are showed in the bar plot of each disease state in each tissue. Each row represents a significant GO biological process which is colored according to the -log10(p.adjust). |
| Page: 1 2 3 4 5 6 7 8 9 |
| GO ID | Tissue | Disease Stage | Description | Gene Ratio | Bg Ratio | pvalue | p.adjust | Count |
| GO:00182124 | Esophagus | ESCC | peptidyl-tyrosine modification | 202/8552 | 378/18723 | 1.34e-03 | 6.39e-03 | 202 |
| GO:00181084 | Esophagus | ESCC | peptidyl-tyrosine phosphorylation | 200/8552 | 375/18723 | 1.60e-03 | 7.45e-03 | 200 |
| GO:000717611 | Esophagus | ESCC | regulation of epidermal growth factor-activated receptor activity | 22/8552 | 30/18723 | 1.98e-03 | 8.90e-03 | 22 |
| GO:007124117 | Esophagus | ESCC | cellular response to inorganic substance | 125/8552 | 226/18723 | 2.17e-03 | 9.67e-03 | 125 |
| GO:00507303 | Esophagus | ESCC | regulation of peptidyl-tyrosine phosphorylation | 144/8552 | 264/18723 | 2.22e-03 | 9.78e-03 | 144 |
| GO:00610972 | Esophagus | ESCC | regulation of protein tyrosine kinase activity | 55/8552 | 90/18723 | 2.27e-03 | 9.99e-03 | 55 |
| GO:00703046 | Esophagus | ESCC | positive regulation of stress-activated protein kinase signaling cascade | 74/8552 | 128/18723 | 3.77e-03 | 1.53e-02 | 74 |
| GO:007127615 | Esophagus | ESCC | cellular response to cadmium ion | 27/8552 | 40/18723 | 4.39e-03 | 1.73e-02 | 27 |
| GO:00328745 | Esophagus | ESCC | positive regulation of stress-activated MAPK cascade | 72/8552 | 126/18723 | 6.24e-03 | 2.29e-02 | 72 |
| GO:00463302 | Esophagus | ESCC | positive regulation of JNK cascade | 52/8552 | 89/18723 | 1.04e-02 | 3.56e-02 | 52 |
| Page: 1 2 3 |
| Pathway ID | Tissue | Disease Stage | Description | Gene Ratio | Bg Ratio | pvalue | p.adjust | qvalue | Count |
| hsa0502030 | Esophagus | HGIN | Prion disease | 117/1383 | 273/8465 | 4.15e-26 | 3.38e-24 | 2.69e-24 | 117 |
| hsa0520839 | Esophagus | HGIN | Chemical carcinogenesis - reactive oxygen species | 92/1383 | 223/8465 | 2.41e-19 | 9.83e-18 | 7.80e-18 | 92 |
| hsa0541530 | Esophagus | HGIN | Diabetic cardiomyopathy | 80/1383 | 203/8465 | 1.35e-15 | 3.38e-14 | 2.69e-14 | 80 |
| hsa0541839 | Esophagus | HGIN | Fluid shear stress and atherosclerosis | 42/1383 | 139/8465 | 2.92e-05 | 3.81e-04 | 3.02e-04 | 42 |
| hsa0541739 | Esophagus | HGIN | Lipid and atherosclerosis | 51/1383 | 215/8465 | 2.95e-03 | 2.41e-02 | 1.91e-02 | 51 |
| hsa05020113 | Esophagus | HGIN | Prion disease | 117/1383 | 273/8465 | 4.15e-26 | 3.38e-24 | 2.69e-24 | 117 |
| hsa05208115 | Esophagus | HGIN | Chemical carcinogenesis - reactive oxygen species | 92/1383 | 223/8465 | 2.41e-19 | 9.83e-18 | 7.80e-18 | 92 |
| hsa05415114 | Esophagus | HGIN | Diabetic cardiomyopathy | 80/1383 | 203/8465 | 1.35e-15 | 3.38e-14 | 2.69e-14 | 80 |
| hsa05418115 | Esophagus | HGIN | Fluid shear stress and atherosclerosis | 42/1383 | 139/8465 | 2.92e-05 | 3.81e-04 | 3.02e-04 | 42 |
| hsa05417114 | Esophagus | HGIN | Lipid and atherosclerosis | 51/1383 | 215/8465 | 2.95e-03 | 2.41e-02 | 1.91e-02 | 51 |
| hsa05208211 | Esophagus | ESCC | Chemical carcinogenesis - reactive oxygen species | 168/4205 | 223/8465 | 1.83e-15 | 6.81e-14 | 3.49e-14 | 168 |
| hsa05020210 | Esophagus | ESCC | Prion disease | 193/4205 | 273/8465 | 6.42e-13 | 1.34e-11 | 6.89e-12 | 193 |
| hsa05418211 | Esophagus | ESCC | Fluid shear stress and atherosclerosis | 109/4205 | 139/8465 | 2.00e-12 | 3.72e-11 | 1.90e-11 | 109 |
| hsa05415211 | Esophagus | ESCC | Diabetic cardiomyopathy | 146/4205 | 203/8465 | 5.81e-11 | 7.78e-10 | 3.99e-10 | 146 |
| hsa05417211 | Esophagus | ESCC | Lipid and atherosclerosis | 143/4205 | 215/8465 | 3.30e-07 | 2.45e-06 | 1.26e-06 | 143 |
| hsa0414530 | Esophagus | ESCC | Phagosome | 100/4205 | 152/8465 | 3.81e-05 | 1.72e-04 | 8.82e-05 | 100 |
| hsa0466620 | Esophagus | ESCC | Fc gamma R-mediated phagocytosis | 63/4205 | 97/8465 | 1.63e-03 | 4.89e-03 | 2.50e-03 | 63 |
| hsa05208310 | Esophagus | ESCC | Chemical carcinogenesis - reactive oxygen species | 168/4205 | 223/8465 | 1.83e-15 | 6.81e-14 | 3.49e-14 | 168 |
| hsa0502038 | Esophagus | ESCC | Prion disease | 193/4205 | 273/8465 | 6.42e-13 | 1.34e-11 | 6.89e-12 | 193 |
| hsa05418310 | Esophagus | ESCC | Fluid shear stress and atherosclerosis | 109/4205 | 139/8465 | 2.00e-12 | 3.72e-11 | 1.90e-11 | 109 |
| Page: 1 2 |
Top |
Cell-cell communication analysis |
| Identification of potential cell-cell interactions between two cell types and their ligand-receptor pairs for different disease states |
| Ligand | Receptor | LRpair | Pathway | Tissue | Disease Stage |
| Page: 1 |
Top |
Single-cell gene regulatory network inference analysis |
| Find out the significant the regulons (TFs) and the target genes of each regulon across cell types for different disease states |
| TF | Cell Type | Tissue | Disease Stage | Target Gene | RSS | Regulon Activity |
| ∗The dot plots of a searched regulon are shown for all cell subpopulations in each disease state of each tissue based on the regulon specific score inferred using pySCENIC and by calculating the average expression. |
| Page: 1 |
Top |
Somatic mutation of malignant transformation related genes |
| Annotation of somatic variants for genes involved in malignant transformation |
| Hugo Symbol | Variant Class | Variant Classification | dbSNP RS | HGVSc | HGVSp | HGVSp Short | SWISSPROT | BIOTYPE | SIFT | PolyPhen | Tumor Sample Barcode | Tissue | Histology | Sex | Age | Stage | Therapy Types | Drugs | Outcome |
| NCF1 | SNV | Missense_Mutation | novel | c.286N>A | p.Glu96Lys | p.E96K | P14598 | protein_coding | deleterious(0.01) | benign(0.04) | TCGA-BH-A1FC-01 | Breast | breast invasive carcinoma | Female | >=65 | I/II | Unknown | Unknown | SD |
| NCF1 | SNV | Missense_Mutation | rs367985113 | c.487N>A | p.Ala163Thr | p.A163T | P14598 | protein_coding | deleterious(0.01) | benign(0.294) | TCGA-E2-A1LL-01 | Breast | breast invasive carcinoma | Female | >=65 | III/IV | Chemotherapy | docetaxel | PD |
| NCF1 | SNV | Missense_Mutation | novel | c.176N>T | p.Pro59Leu | p.P59L | P14598 | protein_coding | deleterious(0.03) | possibly_damaging(0.904) | TCGA-C5-A8XJ-01 | Cervix | cervical & endocervical cancer | Female | >=65 | I/II | Chemotherapy | cisplatin | SD |
| NCF1 | SNV | Missense_Mutation | novel | c.230N>G | p.Ala77Gly | p.A77G | P14598 | protein_coding | tolerated(0.42) | benign(0.027) | TCGA-VS-A958-01 | Cervix | cervical & endocervical cancer | Female | <65 | I/II | Chemotherapy | cisplatin | CR |
| NCF1 | SNV | Missense_Mutation | c.556N>A | p.Val186Ile | p.V186I | P14598 | protein_coding | tolerated(0.22) | possibly_damaging(0.551) | TCGA-A6-6654-01 | Colorectum | colon adenocarcinoma | Female | >=65 | III/IV | Chemotherapy | oxaliplatin | SD | |
| NCF1 | SNV | Missense_Mutation | rs782730949 | c.484C>T | p.Arg162Cys | p.R162C | P14598 | protein_coding | tolerated(0.09) | possibly_damaging(0.602) | TCGA-AA-3947-01 | Colorectum | colon adenocarcinoma | Female | <65 | I/II | Unknown | Unknown | SD |
| NCF1 | SNV | Missense_Mutation | c.107N>T | p.Ser36Leu | p.S36L | P14598 | protein_coding | deleterious(0.02) | possibly_damaging(0.893) | TCGA-CM-6171-01 | Colorectum | colon adenocarcinoma | Female | >=65 | I/II | Unknown | Unknown | SD | |
| NCF1 | SNV | Missense_Mutation | c.1009C>T | p.Arg337Cys | p.R337C | P14598 | protein_coding | deleterious(0.01) | possibly_damaging(0.571) | TCGA-AF-A56K-01 | Colorectum | rectum adenocarcinoma | Male | <65 | I/II | Unknown | Unknown | PD | |
| NCF1 | SNV | Missense_Mutation | novel | c.145G>A | p.Glu49Lys | p.E49K | P14598 | protein_coding | tolerated(0.05) | possibly_damaging(0.699) | TCGA-F5-6814-01 | Colorectum | rectum adenocarcinoma | Male | <65 | I/II | Unknown | Unknown | SD |
| NCF1 | SNV | Missense_Mutation | rs782730949 | c.484C>T | p.Arg162Cys | p.R162C | P14598 | protein_coding | tolerated(0.09) | possibly_damaging(0.602) | TCGA-A5-A0G2-01 | Endometrium | uterine corpus endometrioid carcinoma | Female | <65 | III/IV | Unknown | Unknown | SD |
| Page: 1 2 3 |
Top |
Related drugs of malignant transformation related genes |
| Identification of chemicals and drugs interact with genes involved in malignant transfromation |
| (DGIdb 4.0) |
| Entrez ID | Symbol | Category | Interaction Types | Drug Claim Name | Drug Name | PMIDs |
| 653361 | NCF1 | ENZYME | HYDROGEN PEROXIDE | 15840036 |
| Page: 1 |

Copyright 2023-Present -The University of Texas Health Science Center at Houston |