| Tissue | Expression Dynamics | Abbreviation |
| Colorectum (GSE201348) |  | FAP: Familial adenomatous polyposis |
| CRC: Colorectal cancer |
| Colorectum (HTA11) |  | AD: Adenomas |
| SER: Sessile serrated lesions |
| MSI-H: Microsatellite-high colorectal cancer |
| MSS: Microsatellite stable colorectal cancer |
| Esophagus | 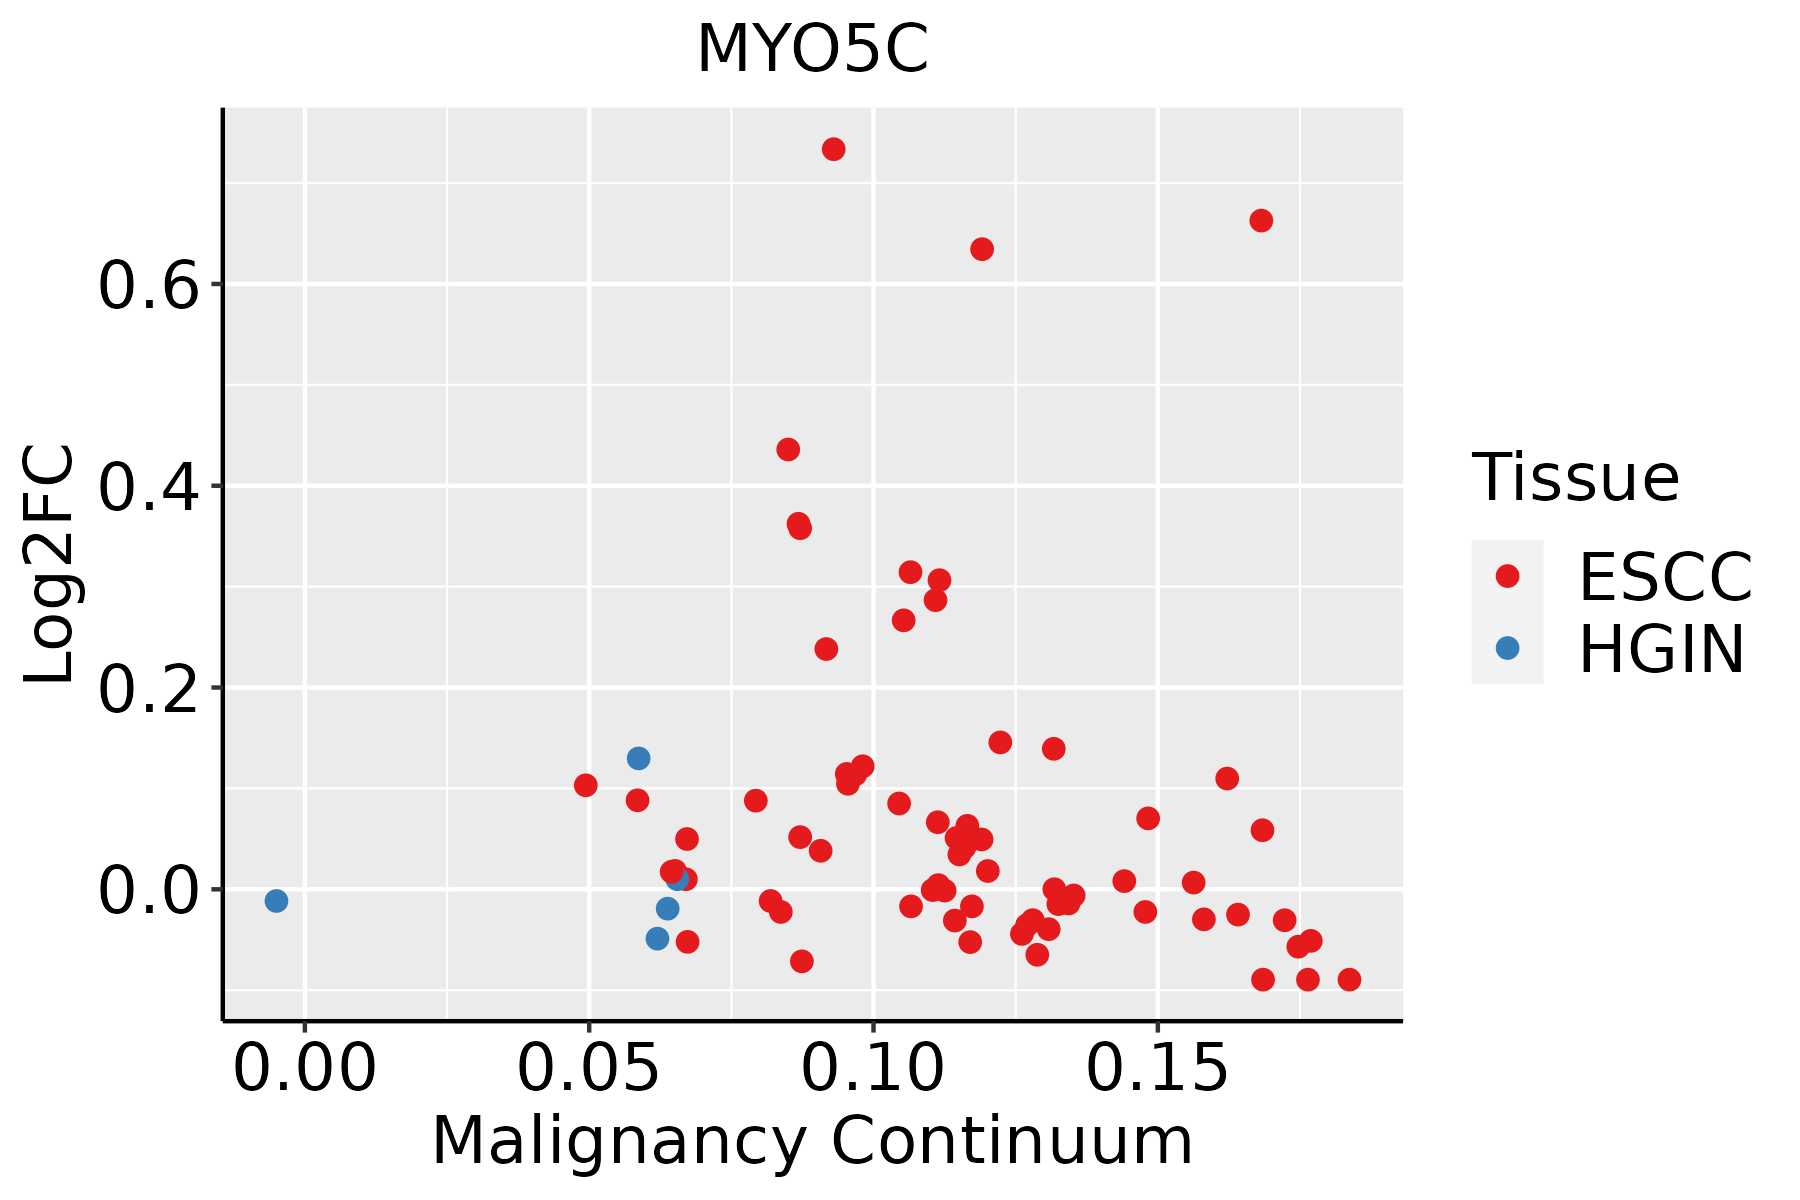 | ESCC: Esophageal squamous cell carcinoma |
| HGIN: High-grade intraepithelial neoplasias |
| LGIN: Low-grade intraepithelial neoplasias |
| Lung | 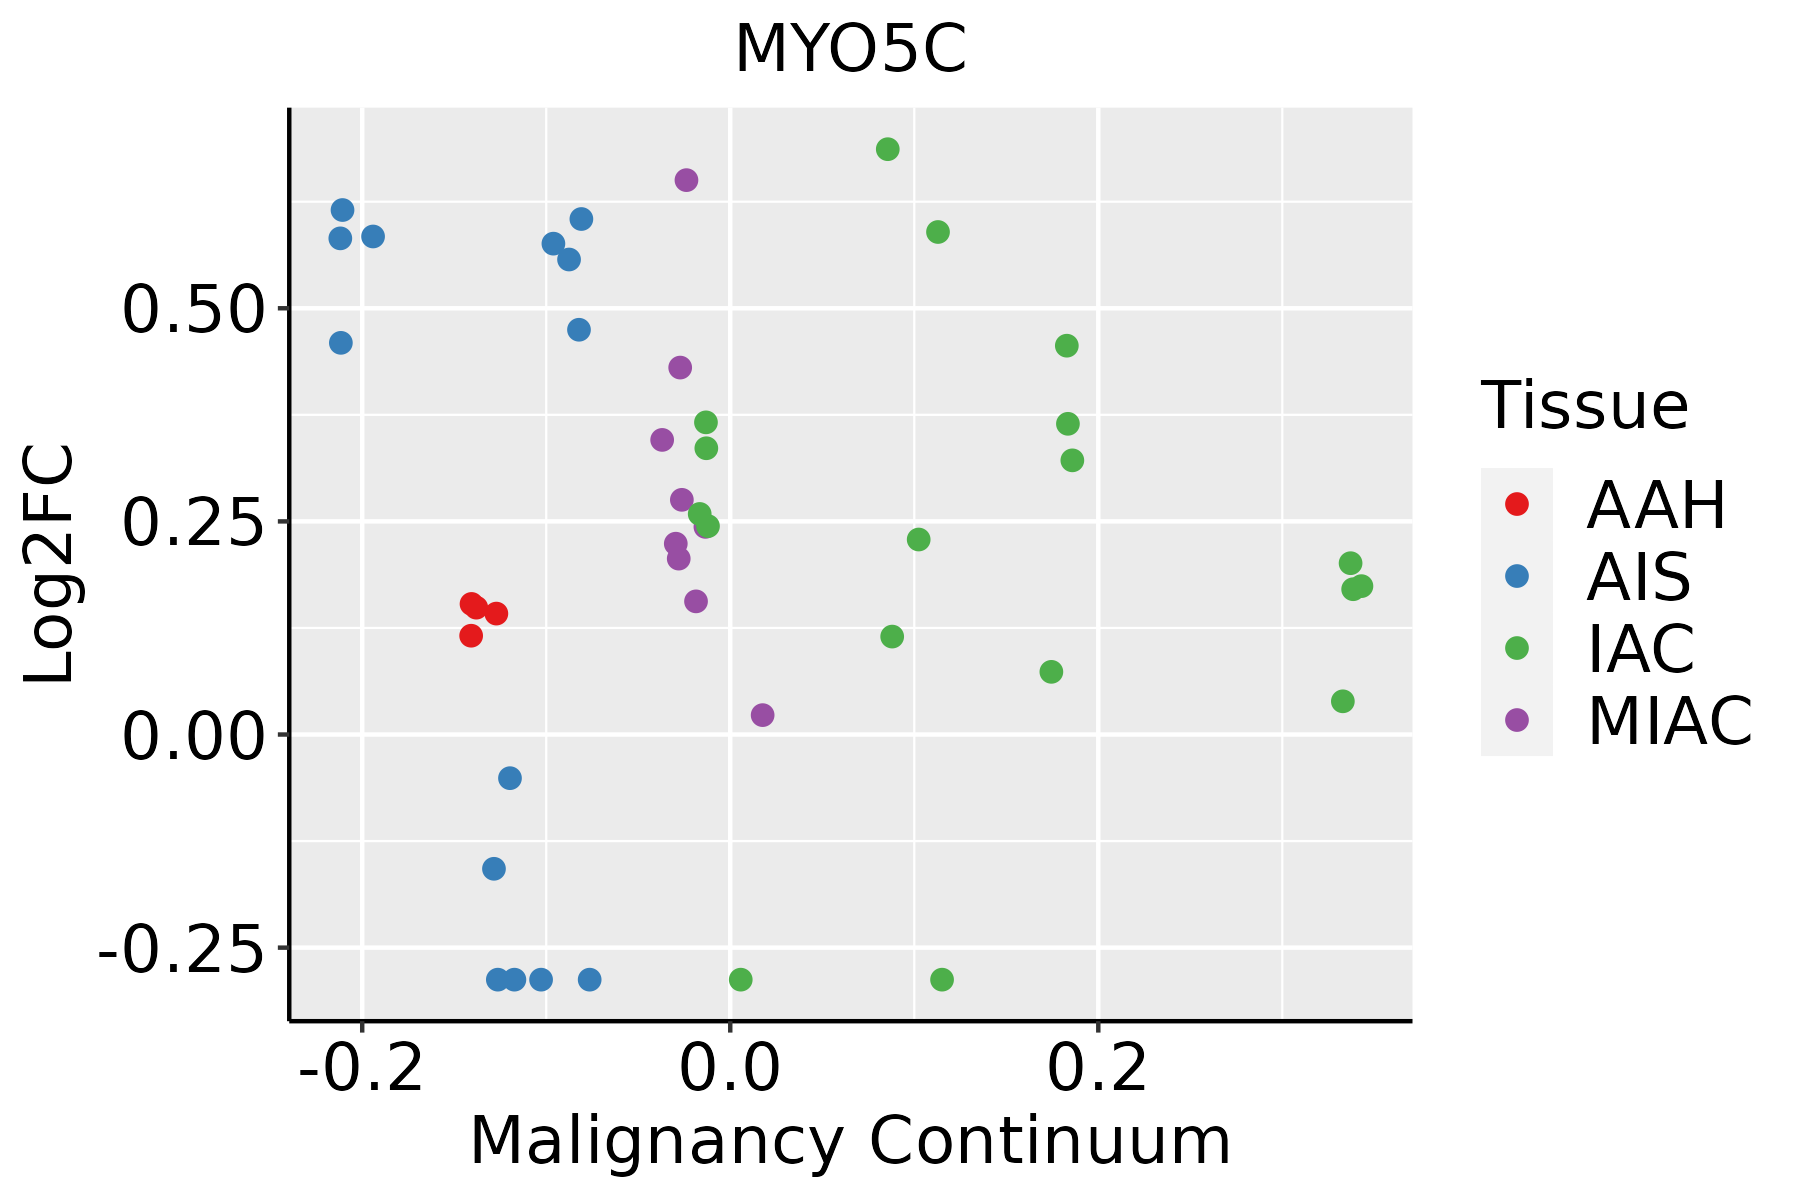 | AAH: Atypical adenomatous hyperplasia |
| AIS: Adenocarcinoma in situ |
| IAC: Invasive lung adenocarcinoma |
| MIA: Minimally invasive adenocarcinoma |
| Thyroid | 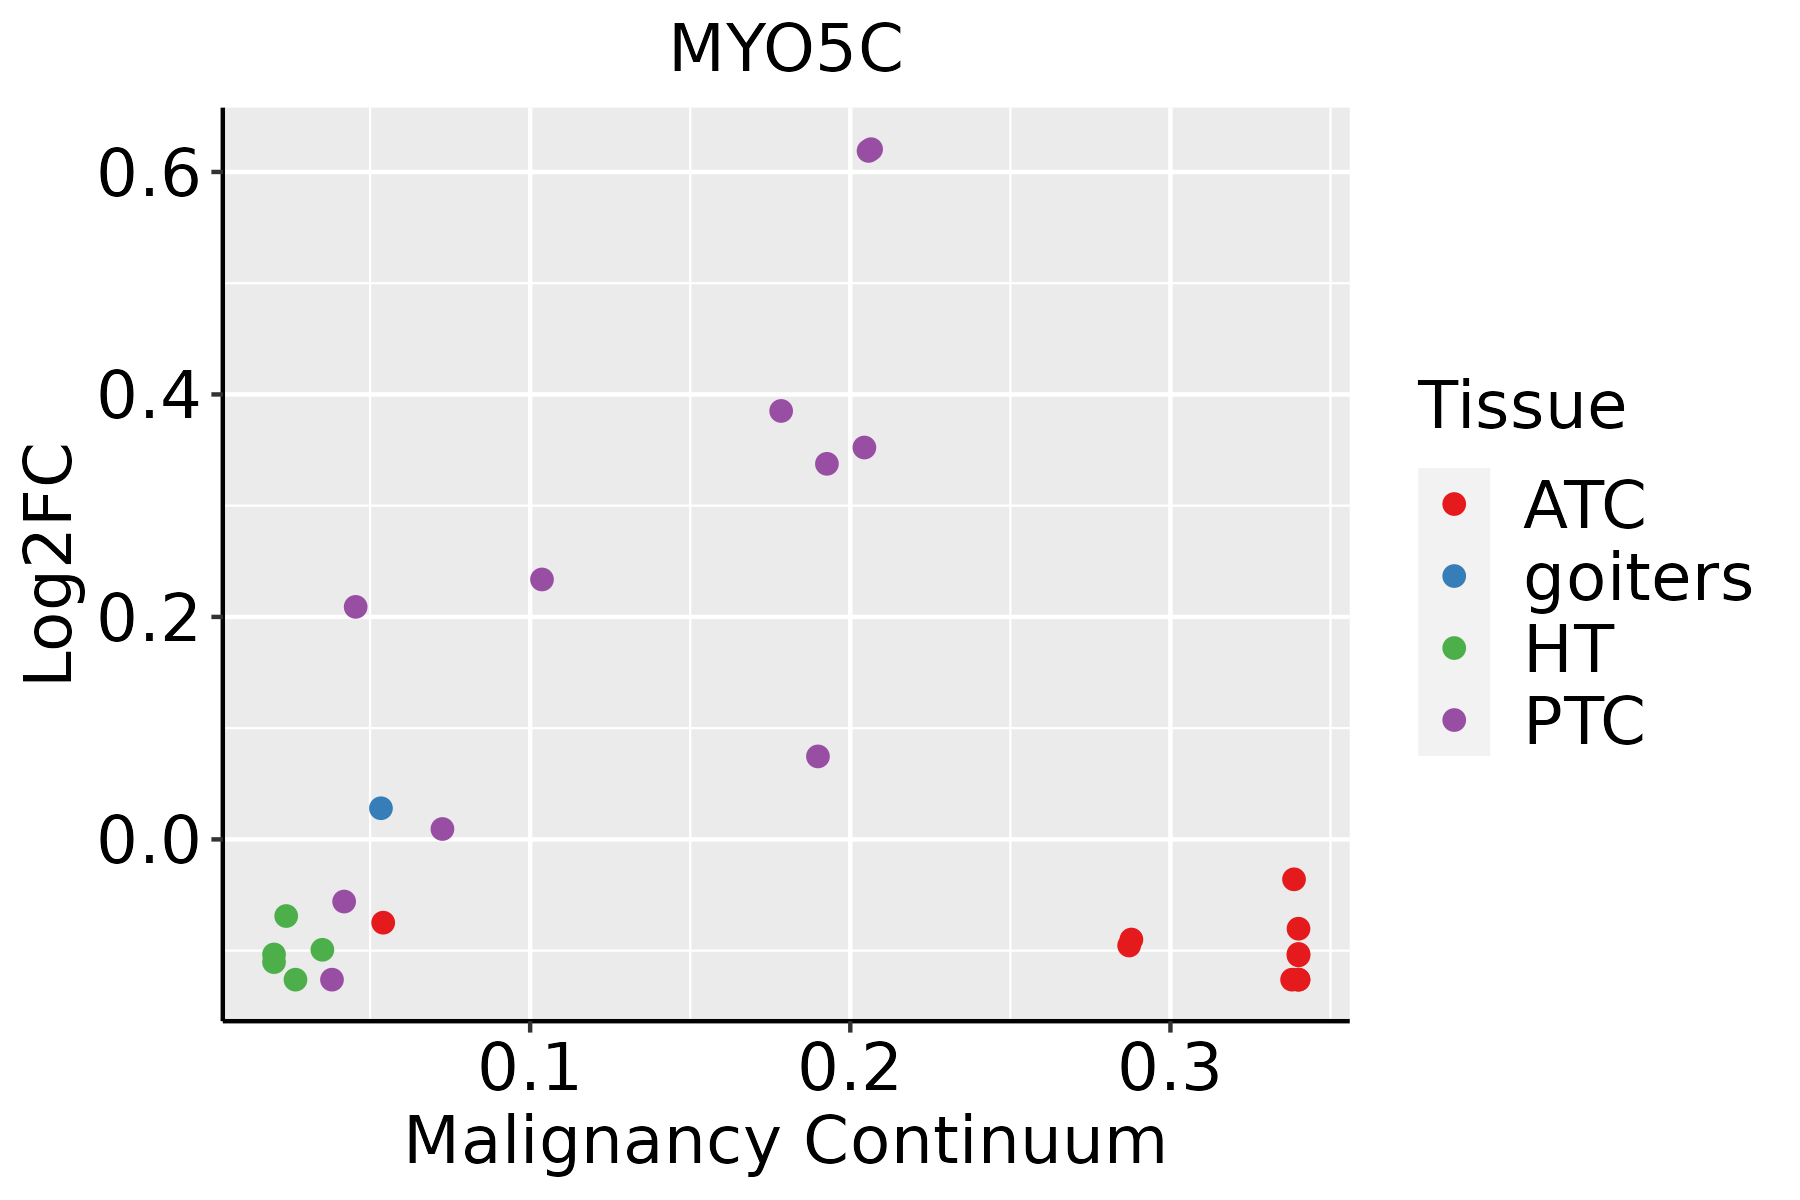 | ATC: Anaplastic thyroid cancer |
| HT: Hashimoto's thyroiditis |
| PTC: Papillary thyroid cancer |
| GO ID | Tissue | Disease Stage | Description | Gene Ratio | Bg Ratio | pvalue | p.adjust | Count |
| GO:00070158 | Lung | IAC | actin filament organization | 92/2061 | 442/18723 | 1.01e-09 | 1.93e-07 | 92 |
| GO:00307056 | Lung | IAC | cytoskeleton-dependent intracellular transport | 40/2061 | 195/18723 | 7.30e-05 | 1.54e-03 | 40 |
| GO:00300486 | Lung | IAC | actin filament-based movement | 27/2061 | 127/18723 | 5.70e-04 | 7.89e-03 | 27 |
| GO:00516506 | Lung | IAC | establishment of vesicle localization | 32/2061 | 161/18723 | 6.53e-04 | 8.87e-03 | 32 |
| GO:00516566 | Lung | IAC | establishment of organelle localization | 64/2061 | 390/18723 | 7.12e-04 | 9.50e-03 | 64 |
| GO:00516486 | Lung | IAC | vesicle localization | 34/2061 | 177/18723 | 8.53e-04 | 1.09e-02 | 34 |
| GO:00995156 | Lung | IAC | actin filament-based transport | 8/2061 | 21/18723 | 1.16e-03 | 1.35e-02 | 8 |
| GO:00300506 | Lung | IAC | vesicle transport along actin filament | 7/2061 | 19/18723 | 2.95e-03 | 2.61e-02 | 7 |
| GO:000701513 | Lung | AIS | actin filament organization | 88/1849 | 442/18723 | 1.02e-10 | 3.13e-08 | 88 |
| GO:003070512 | Lung | AIS | cytoskeleton-dependent intracellular transport | 37/1849 | 195/18723 | 7.68e-05 | 1.95e-03 | 37 |
| GO:005165012 | Lung | AIS | establishment of vesicle localization | 31/1849 | 161/18723 | 2.15e-04 | 4.36e-03 | 31 |
| GO:005164812 | Lung | AIS | vesicle localization | 33/1849 | 177/18723 | 2.56e-04 | 4.96e-03 | 33 |
| GO:009951512 | Lung | AIS | actin filament-based transport | 8/1849 | 21/18723 | 5.58e-04 | 8.73e-03 | 8 |
| GO:003004812 | Lung | AIS | actin filament-based movement | 25/1849 | 127/18723 | 5.99e-04 | 9.14e-03 | 25 |
| GO:005165612 | Lung | AIS | establishment of organelle localization | 59/1849 | 390/18723 | 6.08e-04 | 9.24e-03 | 59 |
| GO:003005012 | Lung | AIS | vesicle transport along actin filament | 7/1849 | 19/18723 | 1.57e-03 | 1.83e-02 | 7 |
| GO:000701533 | Lung | MIAC | actin filament organization | 50/967 | 442/18723 | 1.64e-07 | 3.81e-05 | 50 |
| GO:009951522 | Lung | MIAC | actin filament-based transport | 6/967 | 21/18723 | 5.19e-04 | 1.37e-02 | 6 |
| GO:003004831 | Lung | MIAC | actin filament-based movement | 16/967 | 127/18723 | 8.47e-04 | 1.83e-02 | 16 |
| GO:005165622 | Lung | MIAC | establishment of organelle localization | 35/967 | 390/18723 | 1.09e-03 | 2.16e-02 | 35 |
| Pathway ID | Tissue | Disease Stage | Description | Gene Ratio | Bg Ratio | pvalue | p.adjust | qvalue | Count |
| hsa05130 | Colorectum | AD | Pathogenic Escherichia coli infection | 79/2092 | 197/8465 | 1.05e-06 | 1.36e-05 | 8.65e-06 | 79 |
| hsa051301 | Colorectum | AD | Pathogenic Escherichia coli infection | 79/2092 | 197/8465 | 1.05e-06 | 1.36e-05 | 8.65e-06 | 79 |
| hsa051304 | Colorectum | MSS | Pathogenic Escherichia coli infection | 73/1875 | 197/8465 | 1.10e-06 | 1.48e-05 | 9.06e-06 | 73 |
| hsa051305 | Colorectum | MSS | Pathogenic Escherichia coli infection | 73/1875 | 197/8465 | 1.10e-06 | 1.48e-05 | 9.06e-06 | 73 |
| hsa051308 | Colorectum | FAP | Pathogenic Escherichia coli infection | 62/1404 | 197/8465 | 1.37e-07 | 3.08e-06 | 1.87e-06 | 62 |
| hsa051309 | Colorectum | FAP | Pathogenic Escherichia coli infection | 62/1404 | 197/8465 | 1.37e-07 | 3.08e-06 | 1.87e-06 | 62 |
| hsa0513010 | Colorectum | CRC | Pathogenic Escherichia coli infection | 47/1091 | 197/8465 | 1.49e-05 | 3.84e-04 | 2.60e-04 | 47 |
| hsa0513011 | Colorectum | CRC | Pathogenic Escherichia coli infection | 47/1091 | 197/8465 | 1.49e-05 | 3.84e-04 | 2.60e-04 | 47 |
| hsa05130211 | Esophagus | ESCC | Pathogenic Escherichia coli infection | 142/4205 | 197/8465 | 8.21e-11 | 1.06e-09 | 5.42e-10 | 142 |
| hsa05130310 | Esophagus | ESCC | Pathogenic Escherichia coli infection | 142/4205 | 197/8465 | 8.21e-11 | 1.06e-09 | 5.42e-10 | 142 |
| hsa0513016 | Lung | IAC | Pathogenic Escherichia coli infection | 45/1053 | 197/8465 | 2.93e-05 | 6.14e-04 | 4.08e-04 | 45 |
| hsa0513017 | Lung | IAC | Pathogenic Escherichia coli infection | 45/1053 | 197/8465 | 2.93e-05 | 6.14e-04 | 4.08e-04 | 45 |
| hsa0513023 | Lung | AIS | Pathogenic Escherichia coli infection | 42/961 | 197/8465 | 3.43e-05 | 5.62e-04 | 3.59e-04 | 42 |
| hsa0513033 | Lung | AIS | Pathogenic Escherichia coli infection | 42/961 | 197/8465 | 3.43e-05 | 5.62e-04 | 3.59e-04 | 42 |
| hsa04814 | Lung | MIAC | Motor proteins | 21/507 | 193/8465 | 5.64e-03 | 3.82e-02 | 2.76e-02 | 21 |
| hsa048141 | Lung | MIAC | Motor proteins | 21/507 | 193/8465 | 5.64e-03 | 3.82e-02 | 2.76e-02 | 21 |
| Hugo Symbol | Variant Class | Variant Classification | dbSNP RS | HGVSc | HGVSp | HGVSp Short | SWISSPROT | BIOTYPE | SIFT | PolyPhen | Tumor Sample Barcode | Tissue | Histology | Sex | Age | Stage | Therapy Types | Drugs | Outcome |
| MYO5C | SNV | Missense_Mutation | | c.4616N>A | p.Ser1539Asn | p.S1539N | Q9NQX4 | protein_coding | deleterious(0.03) | probably_damaging(0.968) | TCGA-A8-A07R-01 | Breast | breast invasive carcinoma | Female | >=65 | III/IV | Ancillary | zoledronic | SD |
| MYO5C | SNV | Missense_Mutation | | c.4133T>C | p.Leu1378Pro | p.L1378P | Q9NQX4 | protein_coding | deleterious(0) | probably_damaging(0.973) | TCGA-A8-A09Z-01 | Breast | breast invasive carcinoma | Female | >=65 | I/II | Unknown | Unknown | SD |
| MYO5C | SNV | Missense_Mutation | | c.1666G>C | p.Glu556Gln | p.E556Q | Q9NQX4 | protein_coding | tolerated(0.06) | benign(0.444) | TCGA-AC-A23H-01 | Breast | breast invasive carcinoma | Female | >=65 | I/II | Unknown | Unknown | PD |
| MYO5C | SNV | Missense_Mutation | | c.4786N>A | p.Asp1596Asn | p.D1596N | Q9NQX4 | protein_coding | deleterious(0) | probably_damaging(0.999) | TCGA-BH-A0BP-01 | Breast | breast invasive carcinoma | Female | >=65 | I/II | Unknown | Unknown | SD |
| MYO5C | SNV | Missense_Mutation | | c.2809G>A | p.Ala937Thr | p.A937T | Q9NQX4 | protein_coding | tolerated(0.72) | benign(0.001) | TCGA-BH-A1F8-01 | Breast | breast invasive carcinoma | Female | >=65 | III/IV | Unknown | Unknown | PD |
| MYO5C | SNV | Missense_Mutation | | c.3583G>A | p.Glu1195Lys | p.E1195K | Q9NQX4 | protein_coding | tolerated(0.28) | benign(0.044) | TCGA-C8-A1HM-01 | Breast | breast invasive carcinoma | Female | >=65 | I/II | Chemotherapy | doxorubicin | CR |
| MYO5C | deletion | Frame_Shift_Del | novel | c.4963delN | p.Tyr1655ThrfsTer13 | p.Y1655Tfs*13 | Q9NQX4 | protein_coding | | | TCGA-EW-A2FV-01 | Breast | breast invasive carcinoma | Female | <65 | III/IV | Chemotherapy | docetaxel | SD |
| MYO5C | SNV | Missense_Mutation | rs771283105 | c.4607N>A | p.Arg1536His | p.R1536H | Q9NQX4 | protein_coding | deleterious(0) | probably_damaging(0.985) | TCGA-2W-A8YY-01 | Cervix | cervical & endocervical cancer | Female | <65 | I/II | Chemotherapy | cisplatin | CR |
| MYO5C | SNV | Missense_Mutation | novel | c.4465N>A | p.Leu1489Ile | p.L1489I | Q9NQX4 | protein_coding | deleterious(0.05) | benign(0.176) | TCGA-2W-A8YY-01 | Cervix | cervical & endocervical cancer | Female | <65 | I/II | Chemotherapy | cisplatin | CR |
| MYO5C | SNV | Missense_Mutation | novel | c.2396N>A | p.Ala799Asp | p.A799D | Q9NQX4 | protein_coding | tolerated(0.21) | benign(0.092) | TCGA-2W-A8YY-01 | Cervix | cervical & endocervical cancer | Female | <65 | I/II | Chemotherapy | cisplatin | CR |


