| Tissue | Expression Dynamics | Abbreviation |
| Cervix | 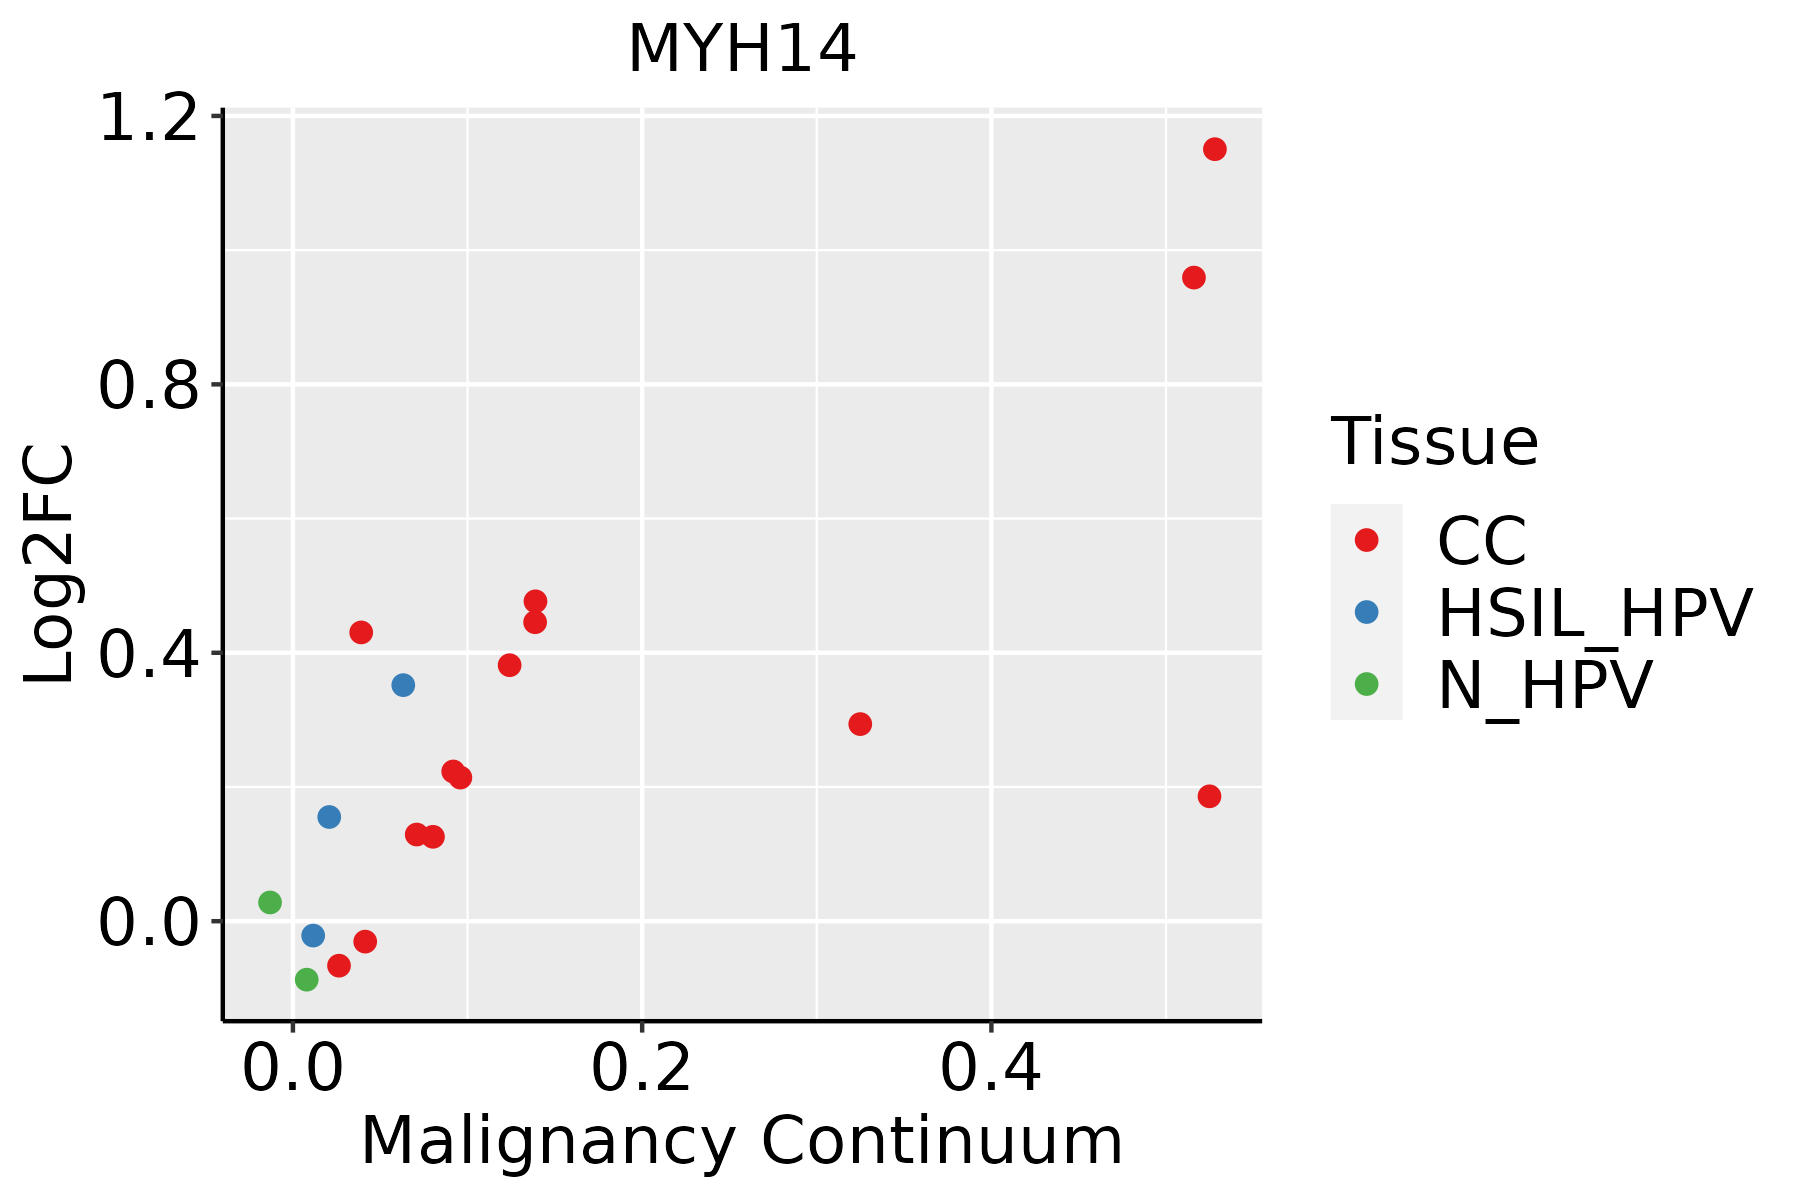 | CC: Cervix cancer |
| HSIL_HPV: HPV-infected high-grade squamous intraepithelial lesions |
| N_HPV: HPV-infected normal cervix |
| Colorectum (GSE201348) |  | FAP: Familial adenomatous polyposis |
| CRC: Colorectal cancer |
| Colorectum (HTA11) |  | AD: Adenomas |
| SER: Sessile serrated lesions |
| MSI-H: Microsatellite-high colorectal cancer |
| MSS: Microsatellite stable colorectal cancer |
| Endometrium | 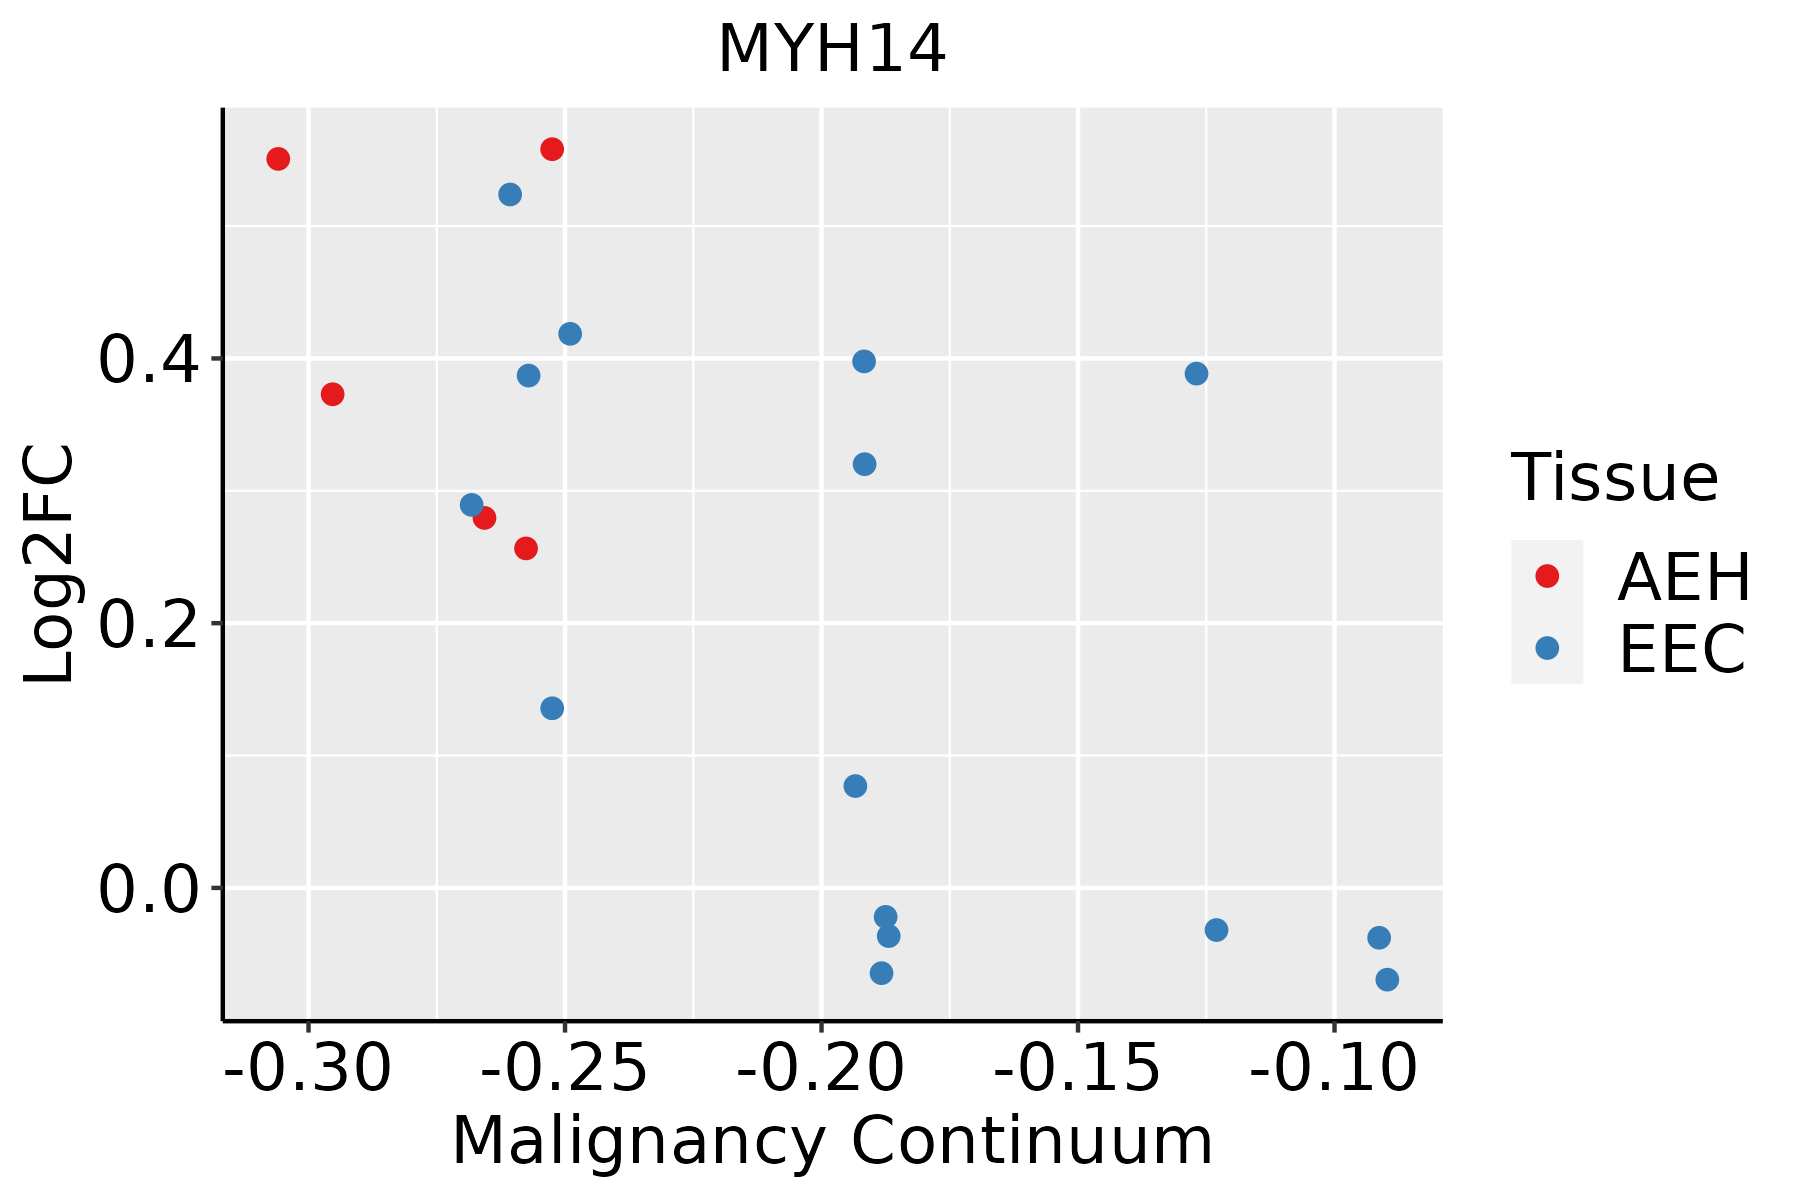 | AEH: Atypical endometrial hyperplasia |
| EEC: Endometrioid Cancer |
| Esophagus |  | ESCC: Esophageal squamous cell carcinoma |
| HGIN: High-grade intraepithelial neoplasias |
| LGIN: Low-grade intraepithelial neoplasias |
| GC | 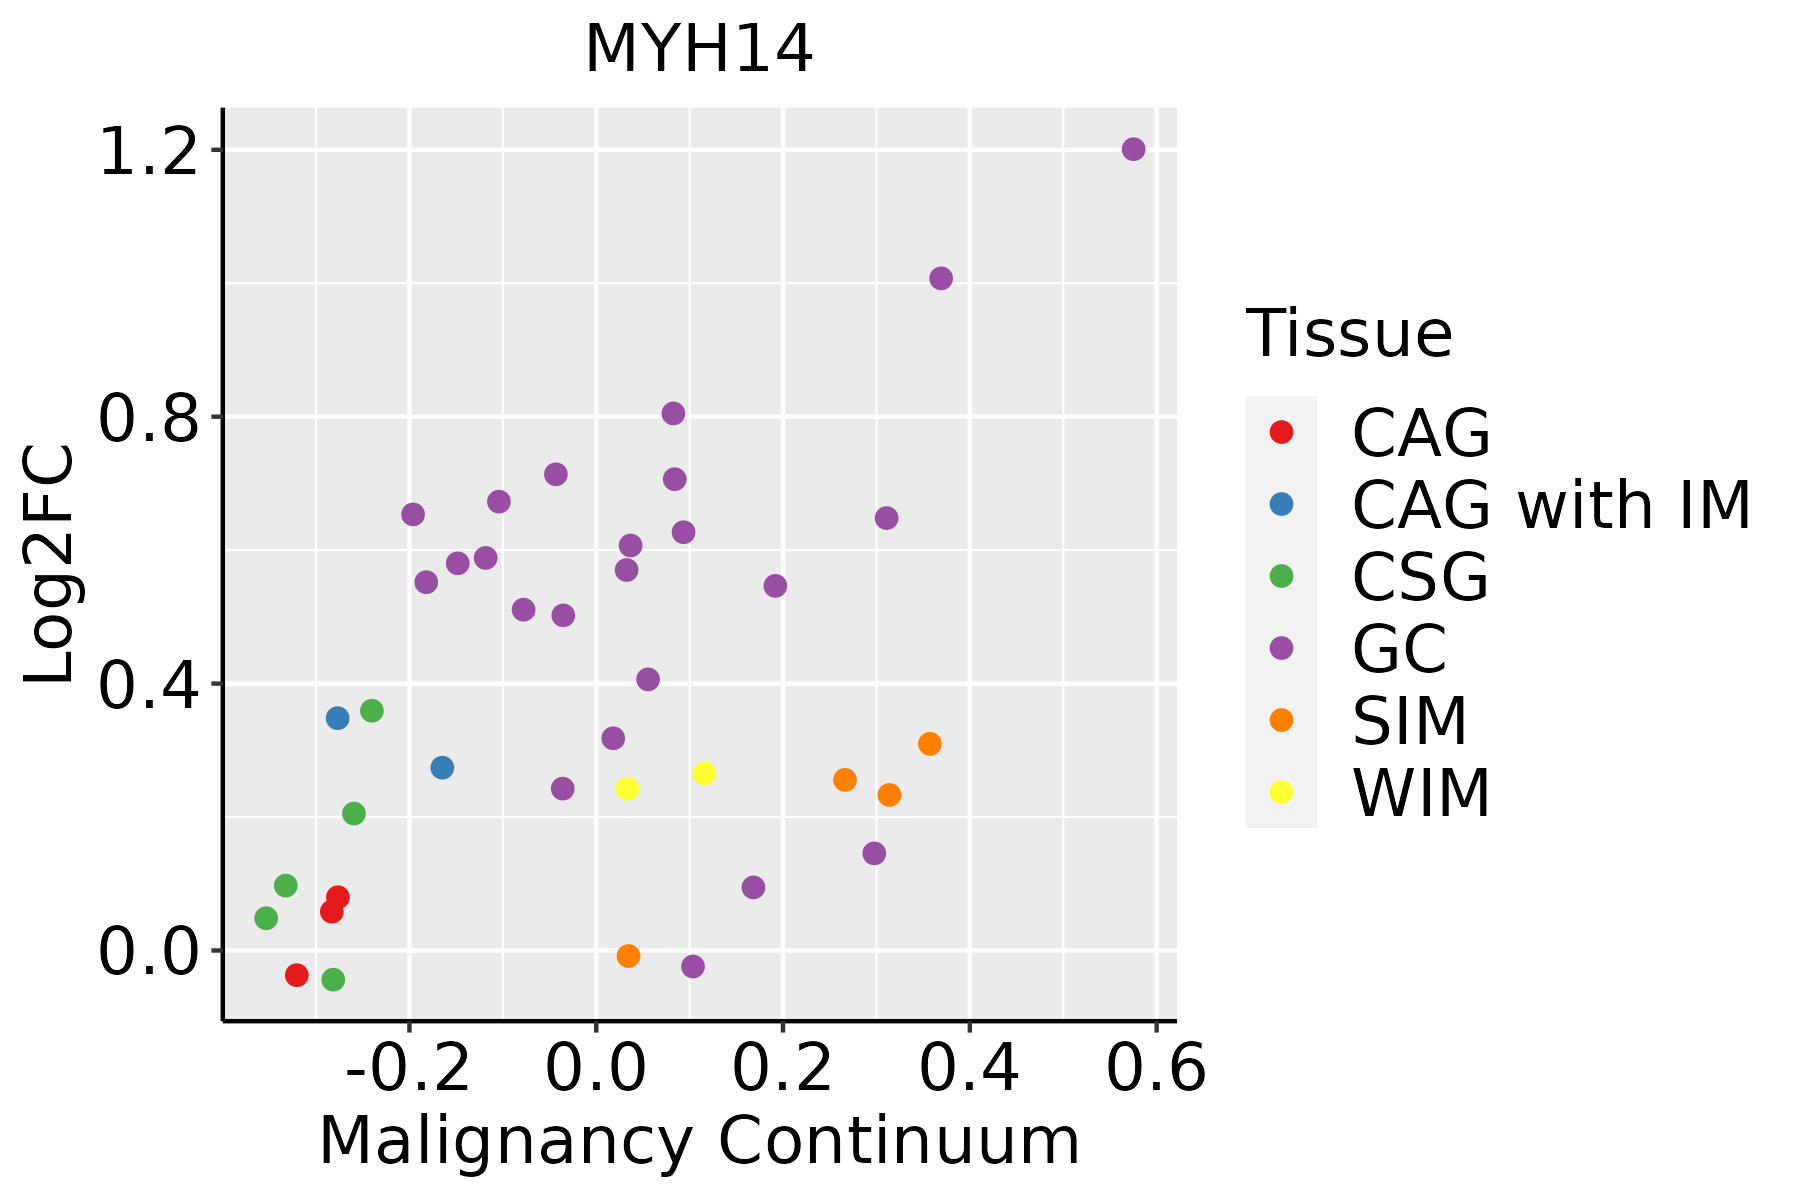 | CAG: Chronic atrophic gastritis |
| CAG with IM: Chronic atrophic gastritis with intestinal metaplasia |
| CSG: Chronic superficial gastritis |
| GC: Gastric cancer |
| SIM: Severe intestinal metaplasia |
| WIM: Wild intestinal metaplasia |
| Liver |  | HCC: Hepatocellular carcinoma |
| NAFLD: Non-alcoholic fatty liver disease |
| Lung |  | AAH: Atypical adenomatous hyperplasia |
| AIS: Adenocarcinoma in situ |
| IAC: Invasive lung adenocarcinoma |
| MIA: Minimally invasive adenocarcinoma |
| Oral Cavity | 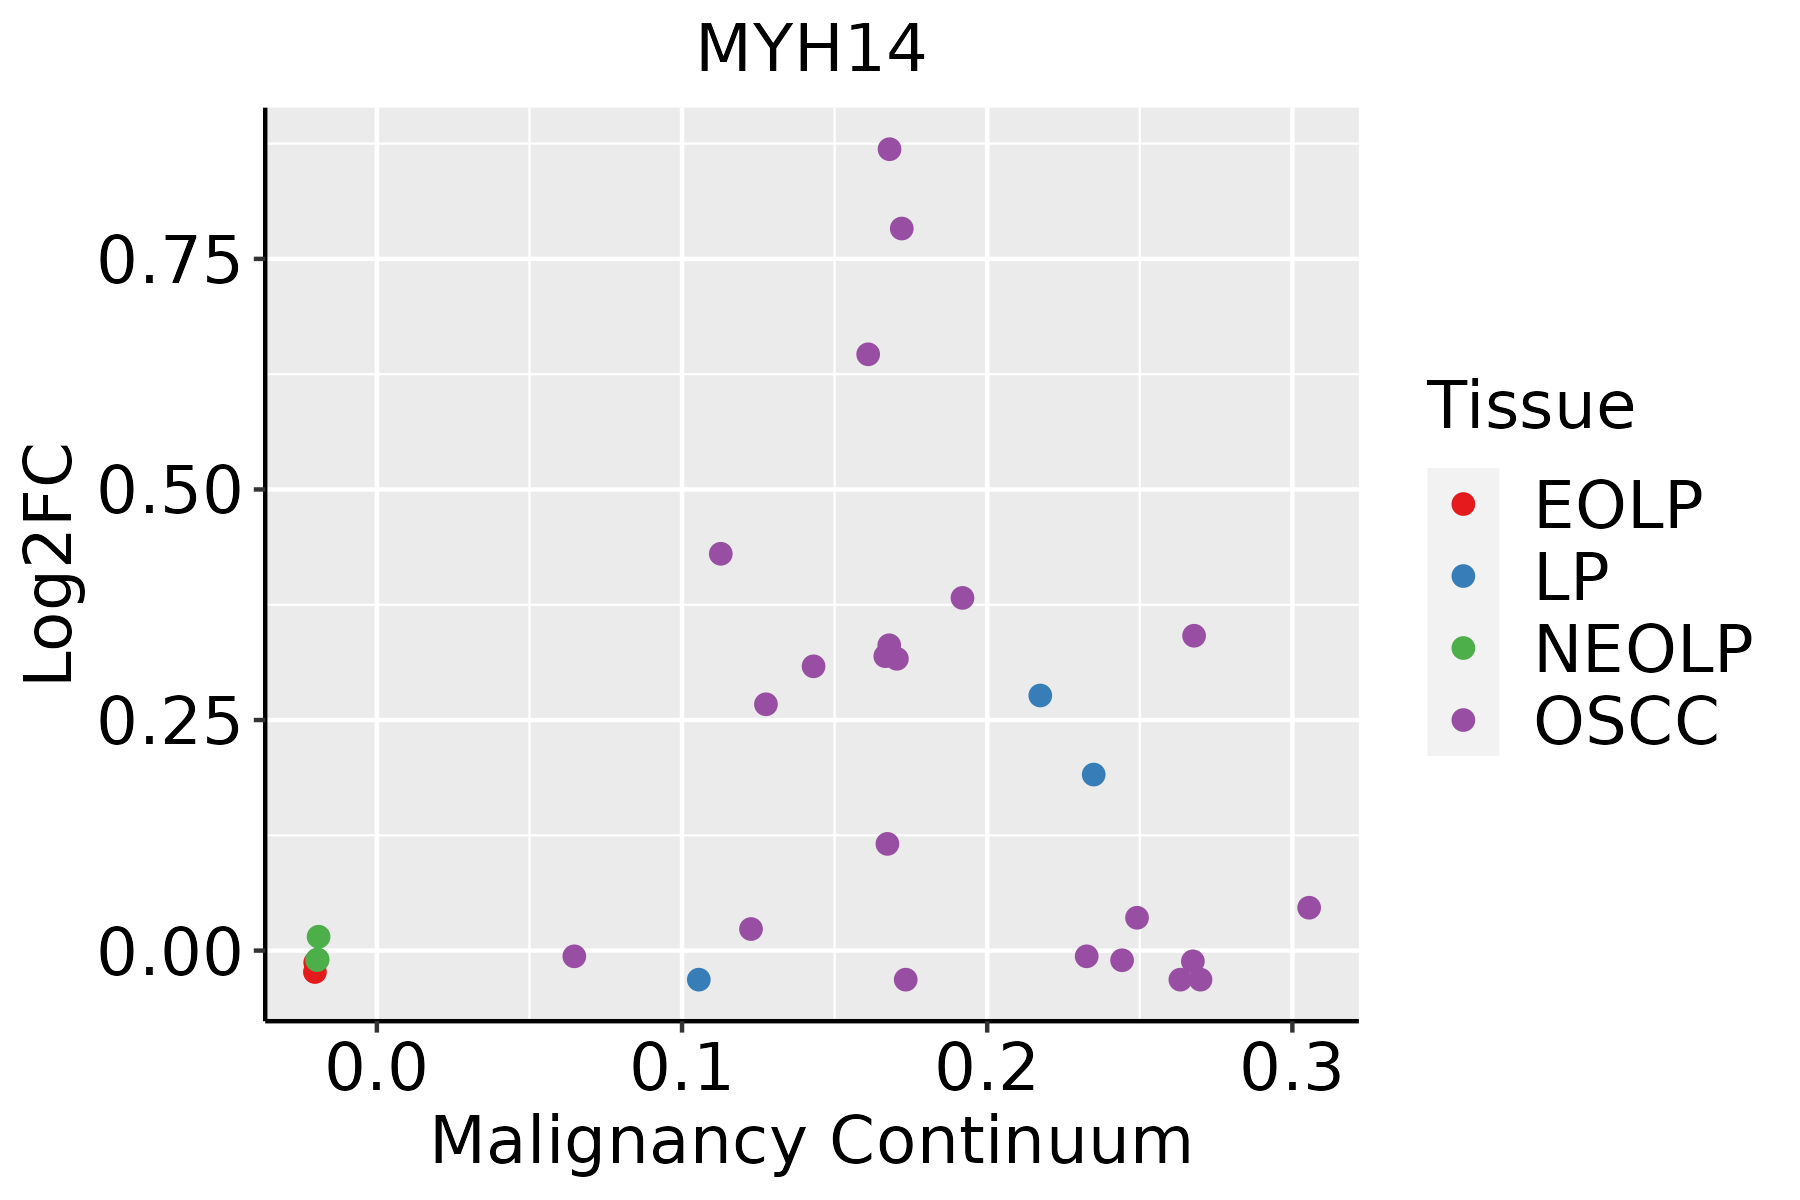 | EOLP: Erosive Oral lichen planus |
| LP: leukoplakia |
| NEOLP: Non-erosive oral lichen planus |
| OSCC: Oral squamous cell carcinoma |
| Thyroid |  | ATC: Anaplastic thyroid cancer |
| HT: Hashimoto's thyroiditis |
| PTC: Papillary thyroid cancer |
| GO ID | Tissue | Disease Stage | Description | Gene Ratio | Bg Ratio | pvalue | p.adjust | Count |
| GO:00226045 | Colorectum | CRC | regulation of cell morphogenesis | 74/2078 | 309/18723 | 9.25e-11 | 5.04e-08 | 74 |
| GO:00310324 | Colorectum | CRC | actomyosin structure organization | 45/2078 | 196/18723 | 1.49e-06 | 8.14e-05 | 45 |
| GO:00083604 | Colorectum | CRC | regulation of cell shape | 38/2078 | 154/18723 | 1.51e-06 | 8.15e-05 | 38 |
| GO:00015081 | Colorectum | CRC | action potential | 32/2078 | 134/18723 | 2.02e-05 | 5.90e-04 | 32 |
| GO:00030123 | Colorectum | CRC | muscle system process | 74/2078 | 452/18723 | 3.92e-04 | 5.80e-03 | 74 |
| GO:00705844 | Colorectum | CRC | mitochondrion morphogenesis | 8/2078 | 21/18723 | 1.22e-03 | 1.38e-02 | 8 |
| GO:0035637 | Colorectum | CRC | multicellular organismal signaling | 31/2078 | 160/18723 | 1.39e-03 | 1.52e-02 | 31 |
| GO:0060537 | Colorectum | CRC | muscle tissue development | 63/2078 | 403/18723 | 3.17e-03 | 2.78e-02 | 63 |
| GO:0042391 | Colorectum | CRC | regulation of membrane potential | 67/2078 | 434/18723 | 3.27e-03 | 2.81e-02 | 67 |
| GO:0014706 | Colorectum | CRC | striated muscle tissue development | 59/2078 | 384/18723 | 6.11e-03 | 4.47e-02 | 59 |
| GO:002260415 | Endometrium | AEH | regulation of cell morphogenesis | 79/2100 | 309/18723 | 1.04e-12 | 2.24e-10 | 79 |
| GO:00605376 | Endometrium | AEH | muscle tissue development | 83/2100 | 403/18723 | 2.57e-08 | 1.50e-06 | 83 |
| GO:003103210 | Endometrium | AEH | actomyosin structure organization | 46/2100 | 196/18723 | 8.00e-07 | 2.91e-05 | 46 |
| GO:00147065 | Endometrium | AEH | striated muscle tissue development | 75/2100 | 384/18723 | 1.06e-06 | 3.62e-05 | 75 |
| GO:00300488 | Endometrium | AEH | actin filament-based movement | 31/2100 | 127/18723 | 2.10e-05 | 4.14e-04 | 31 |
| GO:00030126 | Endometrium | AEH | muscle system process | 78/2100 | 452/18723 | 6.89e-05 | 1.06e-03 | 78 |
| GO:00083609 | Endometrium | AEH | regulation of cell shape | 34/2100 | 154/18723 | 7.85e-05 | 1.18e-03 | 34 |
| GO:00075174 | Endometrium | AEH | muscle organ development | 60/2100 | 327/18723 | 8.19e-05 | 1.22e-03 | 60 |
| GO:0006936 | Endometrium | AEH | muscle contraction | 59/2100 | 347/18723 | 7.32e-04 | 6.99e-03 | 59 |
| GO:00015083 | Endometrium | AEH | action potential | 26/2100 | 134/18723 | 3.66e-03 | 2.50e-02 | 26 |
| Pathway ID | Tissue | Disease Stage | Description | Gene Ratio | Bg Ratio | pvalue | p.adjust | qvalue | Count |
| hsa0513020 | Cervix | CC | Pathogenic Escherichia coli infection | 63/1267 | 197/8465 | 9.28e-10 | 2.00e-08 | 1.19e-08 | 63 |
| hsa0481016 | Cervix | CC | Regulation of actin cytoskeleton | 64/1267 | 229/8465 | 2.24e-07 | 2.59e-06 | 1.53e-06 | 64 |
| hsa0453020 | Cervix | CC | Tight junction | 49/1267 | 169/8465 | 1.87e-06 | 1.78e-05 | 1.05e-05 | 49 |
| hsa05130110 | Cervix | CC | Pathogenic Escherichia coli infection | 63/1267 | 197/8465 | 9.28e-10 | 2.00e-08 | 1.19e-08 | 63 |
| hsa0481017 | Cervix | CC | Regulation of actin cytoskeleton | 64/1267 | 229/8465 | 2.24e-07 | 2.59e-06 | 1.53e-06 | 64 |
| hsa04530110 | Cervix | CC | Tight junction | 49/1267 | 169/8465 | 1.87e-06 | 1.78e-05 | 1.05e-05 | 49 |
| hsa0513025 | Cervix | HSIL_HPV | Pathogenic Escherichia coli infection | 28/459 | 197/8465 | 2.36e-06 | 4.61e-05 | 3.73e-05 | 28 |
| hsa0513035 | Cervix | HSIL_HPV | Pathogenic Escherichia coli infection | 28/459 | 197/8465 | 2.36e-06 | 4.61e-05 | 3.73e-05 | 28 |
| hsa04530 | Colorectum | AD | Tight junction | 76/2092 | 169/8465 | 5.49e-09 | 9.69e-08 | 6.18e-08 | 76 |
| hsa05130 | Colorectum | AD | Pathogenic Escherichia coli infection | 79/2092 | 197/8465 | 1.05e-06 | 1.36e-05 | 8.65e-06 | 79 |
| hsa04810 | Colorectum | AD | Regulation of actin cytoskeleton | 75/2092 | 229/8465 | 3.36e-03 | 1.76e-02 | 1.12e-02 | 75 |
| hsa045301 | Colorectum | AD | Tight junction | 76/2092 | 169/8465 | 5.49e-09 | 9.69e-08 | 6.18e-08 | 76 |
| hsa051301 | Colorectum | AD | Pathogenic Escherichia coli infection | 79/2092 | 197/8465 | 1.05e-06 | 1.36e-05 | 8.65e-06 | 79 |
| hsa048101 | Colorectum | AD | Regulation of actin cytoskeleton | 75/2092 | 229/8465 | 3.36e-03 | 1.76e-02 | 1.12e-02 | 75 |
| hsa045302 | Colorectum | SER | Tight junction | 59/1580 | 169/8465 | 3.24e-07 | 5.98e-06 | 4.34e-06 | 59 |
| hsa051302 | Colorectum | SER | Pathogenic Escherichia coli infection | 60/1580 | 197/8465 | 3.63e-05 | 4.31e-04 | 3.13e-04 | 60 |
| hsa048102 | Colorectum | SER | Regulation of actin cytoskeleton | 60/1580 | 229/8465 | 2.74e-03 | 2.02e-02 | 1.47e-02 | 60 |
| hsa045303 | Colorectum | SER | Tight junction | 59/1580 | 169/8465 | 3.24e-07 | 5.98e-06 | 4.34e-06 | 59 |
| hsa051303 | Colorectum | SER | Pathogenic Escherichia coli infection | 60/1580 | 197/8465 | 3.63e-05 | 4.31e-04 | 3.13e-04 | 60 |
| hsa048103 | Colorectum | SER | Regulation of actin cytoskeleton | 60/1580 | 229/8465 | 2.74e-03 | 2.02e-02 | 1.47e-02 | 60 |
| Hugo Symbol | Variant Class | Variant Classification | dbSNP RS | HGVSc | HGVSp | HGVSp Short | SWISSPROT | BIOTYPE | SIFT | PolyPhen | Tumor Sample Barcode | Tissue | Histology | Sex | Age | Stage | Therapy Types | Drugs | Outcome |
| MYH14 | SNV | Missense_Mutation | | c.5722N>T | p.Arg1908Trp | p.R1908W | Q7Z406 | protein_coding | deleterious(0) | probably_damaging(0.978) | TCGA-A2-A0D3-01 | Breast | breast invasive carcinoma | Female | <65 | I/II | Chemotherapy | carboplatin | SD |
| MYH14 | SNV | Missense_Mutation | | c.4036N>A | p.Glu1346Lys | p.E1346K | Q7Z406 | protein_coding | deleterious(0) | probably_damaging(0.992) | TCGA-AC-A23H-01 | Breast | breast invasive carcinoma | Female | >=65 | I/II | Unknown | Unknown | PD |
| MYH14 | SNV | Missense_Mutation | | c.1067C>G | p.Thr356Arg | p.T356R | Q7Z406 | protein_coding | deleterious(0) | probably_damaging(0.998) | TCGA-AN-A0FJ-01 | Breast | breast invasive carcinoma | Female | <65 | III/IV | Unknown | Unknown | SD |
| MYH14 | SNV | Missense_Mutation | | c.2846N>T | p.Arg949Leu | p.R949L | Q7Z406 | protein_coding | tolerated(0.32) | benign(0.02) | TCGA-AN-A0FL-01 | Breast | breast invasive carcinoma | Female | <65 | I/II | Unknown | Unknown | SD |
| MYH14 | SNV | Missense_Mutation | novel | c.3631N>A | p.Gly1211Ser | p.G1211S | Q7Z406 | protein_coding | tolerated(0.35) | benign(0.003) | TCGA-AO-A03O-01 | Breast | breast invasive carcinoma | Female | >=65 | I/II | Chemotherapy | doxorubicin | SD |
| MYH14 | SNV | Missense_Mutation | | c.5599C>A | p.Arg1867Ser | p.R1867S | Q7Z406 | protein_coding | deleterious(0.01) | possibly_damaging(0.807) | TCGA-AO-A124-01 | Breast | breast invasive carcinoma | Female | <65 | I/II | Chemotherapy | doxorubicin | SD |
| MYH14 | SNV | Missense_Mutation | rs765142655 | c.1463C>T | p.Ala488Val | p.A488V | Q7Z406 | protein_coding | deleterious(0) | probably_damaging(0.998) | TCGA-AO-A128-01 | Breast | breast invasive carcinoma | Female | <65 | I/II | Chemotherapy | doxorubicin | SD |
| MYH14 | SNV | Missense_Mutation | | c.2443N>T | p.Asp815Tyr | p.D815Y | Q7Z406 | protein_coding | deleterious(0) | probably_damaging(0.994) | TCGA-AR-A254-01 | Breast | breast invasive carcinoma | Female | <65 | III/IV | Chemotherapy | paclitaxel | SD |
| MYH14 | SNV | Missense_Mutation | rs751422907 | c.5503N>T | p.Arg1835Cys | p.R1835C | Q7Z406 | protein_coding | deleterious(0) | probably_damaging(1) | TCGA-B6-A0X5-01 | Breast | breast invasive carcinoma | Female | <65 | I/II | Unknown | Unknown | PD |
| MYH14 | SNV | Missense_Mutation | | c.1811N>C | p.Val604Ala | p.V604A | Q7Z406 | protein_coding | deleterious(0) | possibly_damaging(0.675) | TCGA-BH-A0DS-01 | Breast | breast invasive carcinoma | Female | >=65 | III/IV | Chemotherapy | cyclophosphamide | SD |


