
|
|||||
|
 | |
| |
| |
| |
| |
| |
|
Gene: MRPL1 |
Gene summary for MRPL1 |
| Gene information | Species | Human | Gene symbol | MRPL1 | Gene ID | 65008 |
| Gene name | mitochondrial ribosomal protein L1 | |
| Gene Alias | BM022 | |
| Cytomap | 4q21.1 | |
| Gene Type | protein-coding | GO ID | GO:0000470 | UniProtAcc | Q9BYD6 |
Top |
Malignant transformation analysis |
| Identification of the aberrant gene expression in precancerous and cancerous lesions by comparing the gene expression of stem-like cells in diseased tissues with normal stem cells |
| Entrez ID | Symbol | Replicates | Species | Organ | Tissue | Adj P-value | Log2FC | Malignancy |
| 65008 | MRPL1 | LZE4T | Human | Esophagus | ESCC | 9.20e-08 | 8.06e-02 | 0.0811 |
| 65008 | MRPL1 | LZE5T | Human | Esophagus | ESCC | 1.92e-04 | 2.87e-01 | 0.0514 |
| 65008 | MRPL1 | LZE7T | Human | Esophagus | ESCC | 3.22e-04 | 2.65e-01 | 0.0667 |
| 65008 | MRPL1 | LZE20T | Human | Esophagus | ESCC | 4.10e-06 | 9.53e-02 | 0.0662 |
| 65008 | MRPL1 | LZE24T | Human | Esophagus | ESCC | 1.81e-07 | 1.64e-01 | 0.0596 |
| 65008 | MRPL1 | LZE6T | Human | Esophagus | ESCC | 8.36e-08 | 1.79e-01 | 0.0845 |
| 65008 | MRPL1 | P2T-E | Human | Esophagus | ESCC | 1.67e-16 | 2.86e-01 | 0.1177 |
| 65008 | MRPL1 | P4T-E | Human | Esophagus | ESCC | 8.48e-25 | 5.66e-01 | 0.1323 |
| 65008 | MRPL1 | P5T-E | Human | Esophagus | ESCC | 2.47e-13 | 2.49e-01 | 0.1327 |
| 65008 | MRPL1 | P8T-E | Human | Esophagus | ESCC | 3.32e-13 | 1.45e-01 | 0.0889 |
| 65008 | MRPL1 | P9T-E | Human | Esophagus | ESCC | 1.78e-09 | 6.71e-02 | 0.1131 |
| 65008 | MRPL1 | P10T-E | Human | Esophagus | ESCC | 2.97e-11 | 1.08e-01 | 0.116 |
| 65008 | MRPL1 | P11T-E | Human | Esophagus | ESCC | 8.29e-13 | 4.13e-01 | 0.1426 |
| 65008 | MRPL1 | P12T-E | Human | Esophagus | ESCC | 4.67e-23 | 3.00e-01 | 0.1122 |
| 65008 | MRPL1 | P15T-E | Human | Esophagus | ESCC | 8.75e-19 | 2.34e-01 | 0.1149 |
| 65008 | MRPL1 | P16T-E | Human | Esophagus | ESCC | 7.78e-25 | 3.49e-01 | 0.1153 |
| 65008 | MRPL1 | P17T-E | Human | Esophagus | ESCC | 2.40e-03 | 3.13e-01 | 0.1278 |
| 65008 | MRPL1 | P20T-E | Human | Esophagus | ESCC | 1.30e-09 | 1.24e-01 | 0.1124 |
| 65008 | MRPL1 | P21T-E | Human | Esophagus | ESCC | 1.36e-27 | 5.76e-01 | 0.1617 |
| 65008 | MRPL1 | P22T-E | Human | Esophagus | ESCC | 7.81e-17 | 1.85e-01 | 0.1236 |
| Page: 1 2 3 4 5 6 |
| Tissue | Expression Dynamics | Abbreviation |
| Esophagus |  | ESCC: Esophageal squamous cell carcinoma |
| HGIN: High-grade intraepithelial neoplasias | ||
| LGIN: Low-grade intraepithelial neoplasias | ||
| Liver |  | HCC: Hepatocellular carcinoma |
| NAFLD: Non-alcoholic fatty liver disease | ||
| Oral Cavity | 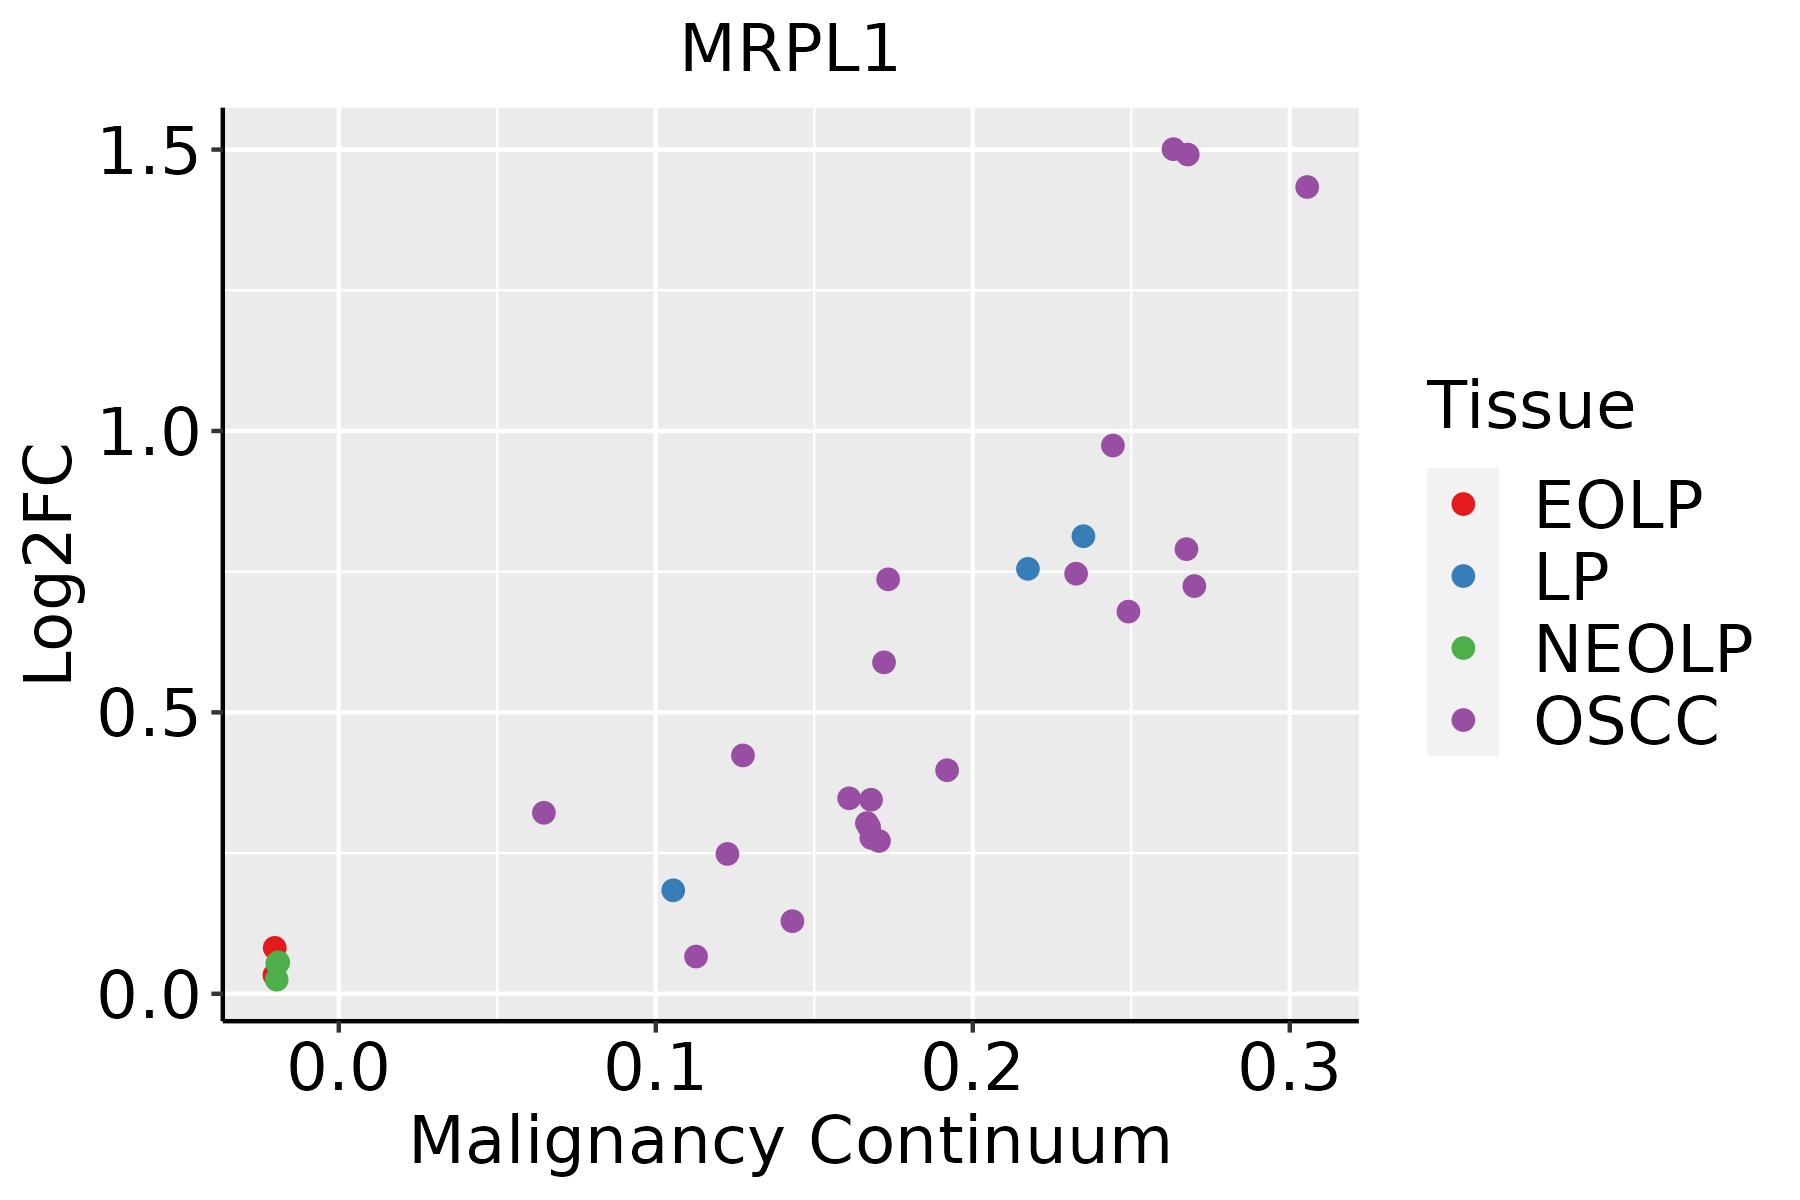 | EOLP: Erosive Oral lichen planus |
| LP: leukoplakia | ||
| NEOLP: Non-erosive oral lichen planus | ||
| OSCC: Oral squamous cell carcinoma | ||
| Skin | 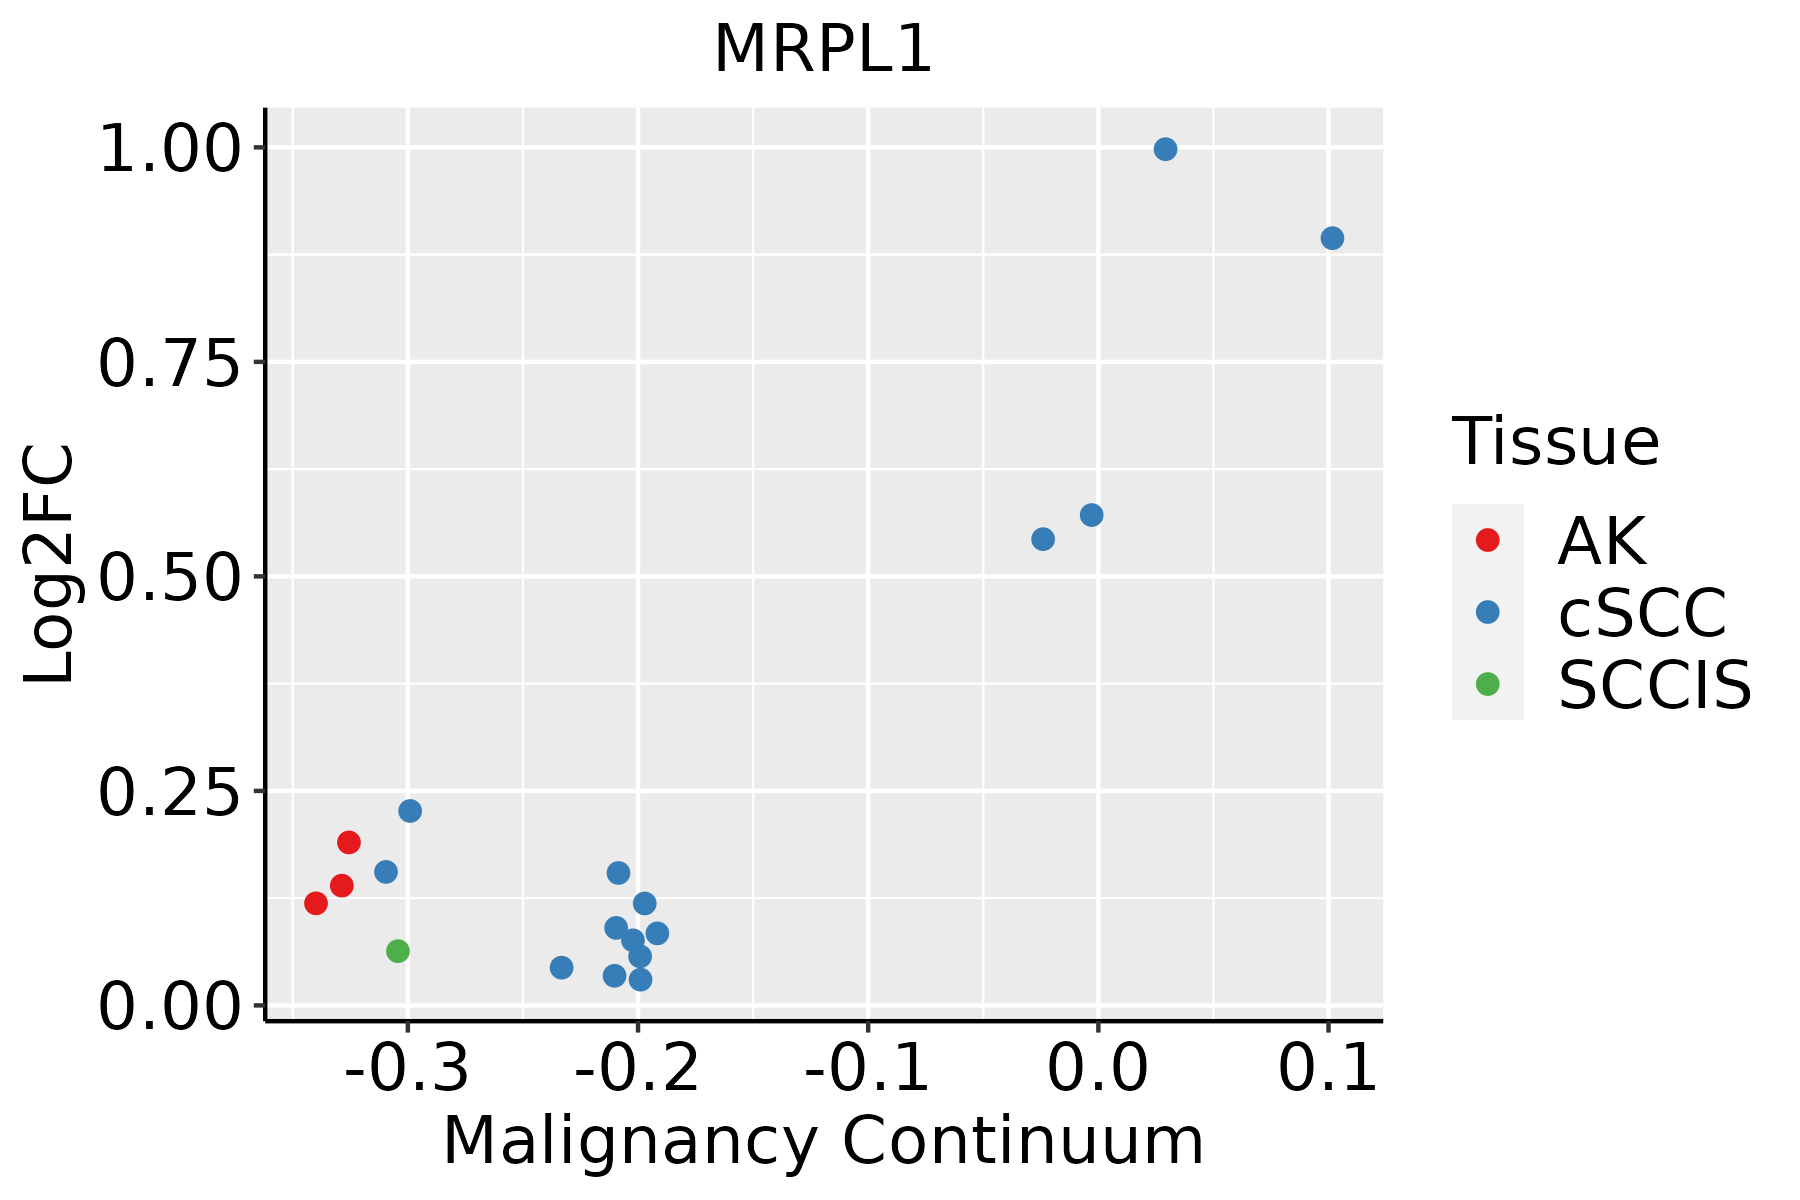 | AK: Actinic keratosis |
| cSCC: Cutaneous squamous cell carcinoma | ||
| SCCIS:squamous cell carcinoma in situ | ||
| Thyroid |  | ATC: Anaplastic thyroid cancer |
| HT: Hashimoto's thyroiditis | ||
| PTC: Papillary thyroid cancer |
| ∗log2FC in expression of this searched gene in stem-like cells from each diseased tissue sample relative to stem-like cells in normal samples in each tissue plotted against the malignancy continuum. Samples are colored based on if they are from different disease stage. |
Top |
Malignant transformation related pathway analysis |
| Find out the enriched GO biological processes and KEGG pathways involved in transition from healthy to precancer to cancer |
| Tissue | Disease Stage | Enriched GO biological Processes |
| Colorectum | AD |  |
| Colorectum | SER |  |
| Colorectum | MSS |  |
| Colorectum | MSI-H |  |
| Colorectum | FAP |  |
| ∗Top 15 enriched GO BP terms are showed in the bar plot of each disease state in each tissue. Each row represents a significant GO biological process which is colored according to the -log10(p.adjust). |
| Page: 1 2 3 4 5 6 7 8 9 |
| GO ID | Tissue | Disease Stage | Description | Gene Ratio | Bg Ratio | pvalue | p.adjust | Count |
| GO:199054216 | Endometrium | EEC | mitochondrial transmembrane transport | 31/2168 | 102/18723 | 2.65e-07 | 1.11e-05 | 31 |
| GO:005065712 | Endometrium | EEC | nucleic acid transport | 39/2168 | 163/18723 | 7.00e-06 | 1.63e-04 | 39 |
| GO:005065812 | Endometrium | EEC | RNA transport | 39/2168 | 163/18723 | 7.00e-06 | 1.63e-04 | 39 |
| GO:005123612 | Endometrium | EEC | establishment of RNA localization | 39/2168 | 166/18723 | 1.11e-05 | 2.33e-04 | 39 |
| GO:001593112 | Endometrium | EEC | nucleobase-containing compound transport | 46/2168 | 222/18723 | 5.91e-05 | 9.13e-04 | 46 |
| GO:000641727 | Esophagus | HGIN | regulation of translation | 139/2587 | 468/18723 | 1.46e-19 | 7.98e-17 | 139 |
| GO:00342496 | Esophagus | HGIN | negative regulation of cellular amide metabolic process | 66/2587 | 273/18723 | 2.74e-06 | 9.60e-05 | 66 |
| GO:00171486 | Esophagus | HGIN | negative regulation of translation | 59/2587 | 245/18723 | 1.03e-05 | 2.96e-04 | 59 |
| GO:01400534 | Esophagus | HGIN | mitochondrial gene expression | 27/2587 | 108/18723 | 1.34e-03 | 1.57e-02 | 27 |
| GO:0022613111 | Esophagus | ESCC | ribonucleoprotein complex biogenesis | 365/8552 | 463/18723 | 1.74e-49 | 1.11e-45 | 365 |
| GO:0042254111 | Esophagus | ESCC | ribosome biogenesis | 252/8552 | 299/18723 | 3.27e-44 | 1.04e-40 | 252 |
| GO:003447015 | Esophagus | ESCC | ncRNA processing | 300/8552 | 395/18723 | 3.09e-35 | 3.26e-32 | 300 |
| GO:0016072110 | Esophagus | ESCC | rRNA metabolic process | 197/8552 | 236/18723 | 1.31e-33 | 1.18e-30 | 197 |
| GO:0006364110 | Esophagus | ESCC | rRNA processing | 189/8552 | 225/18723 | 4.88e-33 | 3.87e-30 | 189 |
| GO:003466012 | Esophagus | ESCC | ncRNA metabolic process | 346/8552 | 485/18723 | 4.35e-31 | 2.51e-28 | 346 |
| GO:0006403110 | Esophagus | ESCC | RNA localization | 166/8552 | 201/18723 | 1.95e-27 | 6.18e-25 | 166 |
| GO:005123617 | Esophagus | ESCC | establishment of RNA localization | 134/8552 | 166/18723 | 1.23e-20 | 1.81e-18 | 134 |
| GO:005065717 | Esophagus | ESCC | nucleic acid transport | 131/8552 | 163/18723 | 6.94e-20 | 8.46e-18 | 131 |
| GO:005065817 | Esophagus | ESCC | RNA transport | 131/8552 | 163/18723 | 6.94e-20 | 8.46e-18 | 131 |
| GO:0006839110 | Esophagus | ESCC | mitochondrial transport | 187/8552 | 254/18723 | 8.35e-20 | 9.81e-18 | 187 |
| Page: 1 2 3 4 5 6 7 8 9 10 11 12 13 |
| Pathway ID | Tissue | Disease Stage | Description | Gene Ratio | Bg Ratio | pvalue | p.adjust | qvalue | Count |
| hsa03010211 | Esophagus | ESCC | Ribosome | 129/4205 | 167/8465 | 1.43e-13 | 3.43e-12 | 1.75e-12 | 129 |
| hsa03010310 | Esophagus | ESCC | Ribosome | 129/4205 | 167/8465 | 1.43e-13 | 3.43e-12 | 1.75e-12 | 129 |
| hsa0301022 | Liver | Cirrhotic | Ribosome | 127/2530 | 167/8465 | 2.12e-35 | 7.06e-33 | 4.35e-33 | 127 |
| hsa0301032 | Liver | Cirrhotic | Ribosome | 127/2530 | 167/8465 | 2.12e-35 | 7.06e-33 | 4.35e-33 | 127 |
| hsa0301042 | Liver | HCC | Ribosome | 128/4020 | 167/8465 | 7.32e-15 | 2.23e-13 | 1.24e-13 | 128 |
| hsa0301052 | Liver | HCC | Ribosome | 128/4020 | 167/8465 | 7.32e-15 | 2.23e-13 | 1.24e-13 | 128 |
| hsa0301030 | Oral cavity | OSCC | Ribosome | 128/3704 | 167/8465 | 2.42e-18 | 1.62e-16 | 8.25e-17 | 128 |
| hsa03010114 | Oral cavity | OSCC | Ribosome | 128/3704 | 167/8465 | 2.42e-18 | 1.62e-16 | 8.25e-17 | 128 |
| Page: 1 |
Top |
Cell-cell communication analysis |
| Identification of potential cell-cell interactions between two cell types and their ligand-receptor pairs for different disease states |
| Ligand | Receptor | LRpair | Pathway | Tissue | Disease Stage |
| Page: 1 |
Top |
Single-cell gene regulatory network inference analysis |
| Find out the significant the regulons (TFs) and the target genes of each regulon across cell types for different disease states |
| TF | Cell Type | Tissue | Disease Stage | Target Gene | RSS | Regulon Activity |
| MRPL1 | CD8TEREX | Lung | ADJ | CNOT6L,ZCWPW2,SESN3, etc. | 1.46e-02 |  |
| MRPL1 | CD8TEFF | Lung | ADJ | CNOT6L,ZCWPW2,SESN3, etc. | 1.80e-01 | |
| MRPL1 | MAIT | Lung | ADJ | CNOT6L,ZCWPW2,SESN3, etc. | 1.97e-02 | |
| ∗The dot plots of a searched regulon are shown for all cell subpopulations in each disease state of each tissue based on the regulon specific score inferred using pySCENIC and by calculating the average expression. |
| Page: 1 |
Top |
Somatic mutation of malignant transformation related genes |
| Annotation of somatic variants for genes involved in malignant transformation |
| Hugo Symbol | Variant Class | Variant Classification | dbSNP RS | HGVSc | HGVSp | HGVSp Short | SWISSPROT | BIOTYPE | SIFT | PolyPhen | Tumor Sample Barcode | Tissue | Histology | Sex | Age | Stage | Therapy Types | Drugs | Outcome |
| MRPL1 | SNV | Missense_Mutation | rs778950727 | c.925N>T | p.Pro309Ser | p.P309S | Q9BYD6 | protein_coding | tolerated(0.63) | benign(0.003) | TCGA-A8-A094-01 | Breast | breast invasive carcinoma | Female | >=65 | I/II | Unknown | Unknown | SD |
| MRPL1 | SNV | Missense_Mutation | c.532N>A | p.Ala178Thr | p.A178T | Q9BYD6 | protein_coding | tolerated(0.08) | benign(0.209) | TCGA-A6-2686-01 | Colorectum | colon adenocarcinoma | Female | >=65 | I/II | Unknown | Unknown | SD | |
| MRPL1 | SNV | Missense_Mutation | c.752A>G | p.Asn251Ser | p.N251S | Q9BYD6 | protein_coding | tolerated(0.29) | benign(0.063) | TCGA-AA-3811-01 | Colorectum | colon adenocarcinoma | Female | >=65 | III/IV | Unknown | Unknown | PD | |
| MRPL1 | SNV | Missense_Mutation | c.173N>C | p.Lys58Thr | p.K58T | Q9BYD6 | protein_coding | tolerated(0.05) | probably_damaging(0.918) | TCGA-AA-A00N-01 | Colorectum | colon adenocarcinoma | Male | >=65 | I/II | Unknown | Unknown | PD | |
| MRPL1 | SNV | Missense_Mutation | c.265A>C | p.Lys89Gln | p.K89Q | Q9BYD6 | protein_coding | tolerated(0.09) | benign(0.328) | TCGA-AD-6889-01 | Colorectum | colon adenocarcinoma | Male | >=65 | I/II | Chemotherapy | xeloda | PD | |
| MRPL1 | SNV | Missense_Mutation | rs149018720 | c.875N>A | p.Arg292His | p.R292H | Q9BYD6 | protein_coding | deleterious(0.02) | benign(0.287) | TCGA-AG-3902-01 | Colorectum | rectum adenocarcinoma | Male | <65 | I/II | Unknown | Unknown | SD |
| MRPL1 | SNV | Missense_Mutation | novel | c.323N>C | p.Lys108Thr | p.K108T | Q9BYD6 | protein_coding | tolerated(0.07) | possibly_damaging(0.46) | TCGA-AG-A002-01 | Colorectum | rectum adenocarcinoma | Male | <65 | I/II | Unknown | Unknown | SD |
| MRPL1 | SNV | Missense_Mutation | novel | c.195A>C | p.Lys65Asn | p.K65N | Q9BYD6 | protein_coding | deleterious(0.02) | benign(0.116) | TCGA-F5-6814-01 | Colorectum | rectum adenocarcinoma | Male | <65 | I/II | Unknown | Unknown | SD |
| MRPL1 | SNV | Missense_Mutation | novel | c.874C>T | p.Arg292Cys | p.R292C | Q9BYD6 | protein_coding | deleterious(0) | probably_damaging(0.987) | TCGA-A5-A0G1-01 | Endometrium | uterine corpus endometrioid carcinoma | Female | >=65 | I/II | Unknown | Unknown | SD |
| MRPL1 | SNV | Missense_Mutation | novel | c.482C>T | p.Thr161Ile | p.T161I | Q9BYD6 | protein_coding | deleterious(0) | probably_damaging(0.953) | TCGA-A5-A0G2-01 | Endometrium | uterine corpus endometrioid carcinoma | Female | <65 | III/IV | Unknown | Unknown | SD |
| Page: 1 2 3 |
Top |
Related drugs of malignant transformation related genes |
| Identification of chemicals and drugs interact with genes involved in malignant transfromation |
| (DGIdb 4.0) |
| Entrez ID | Symbol | Category | Interaction Types | Drug Claim Name | Drug Name | PMIDs |
| Page: 1 |

Copyright 2023-Present -The University of Texas Health Science Center at Houston |