
|
|||||
|
 | |
| |
| |
| |
| |
| |
|
Gene: MLXIPL |
Gene summary for MLXIPL |
| Gene information | Species | Human | Gene symbol | MLXIPL | Gene ID | 51085 |
| Gene name | MLX interacting protein like | |
| Gene Alias | CHREBP | |
| Cytomap | 7q11.23 | |
| Gene Type | protein-coding | GO ID | GO:0000122 | UniProtAcc | Q9NP71 |
Top |
Malignant transformation analysis |
| Identification of the aberrant gene expression in precancerous and cancerous lesions by comparing the gene expression of stem-like cells in diseased tissues with normal stem cells |
| Entrez ID | Symbol | Replicates | Species | Organ | Tissue | Adj P-value | Log2FC | Malignancy |
| 51085 | MLXIPL | HTA11_866_3004761011 | Human | Colorectum | AD | 1.49e-02 | 2.06e-01 | 0.096 |
| 51085 | MLXIPL | HTA11_99999970781_79442 | Human | Colorectum | MSS | 3.57e-16 | 6.90e-01 | 0.294 |
| 51085 | MLXIPL | HTA11_99999965104_69814 | Human | Colorectum | MSS | 2.66e-33 | 1.58e+00 | 0.281 |
| 51085 | MLXIPL | HTA11_99999971662_82457 | Human | Colorectum | MSS | 4.58e-42 | 1.32e+00 | 0.3859 |
| 51085 | MLXIPL | HTA11_99999974143_84620 | Human | Colorectum | MSS | 1.01e-38 | 9.69e-01 | 0.3005 |
| 51085 | MLXIPL | A015-C-203 | Human | Colorectum | FAP | 3.44e-04 | 2.95e-01 | -0.1294 |
| 51085 | MLXIPL | A002-C-021 | Human | Colorectum | FAP | 5.71e-04 | 3.56e-01 | 0.1171 |
| 51085 | MLXIPL | A015-C-104 | Human | Colorectum | FAP | 4.86e-05 | 2.30e-01 | -0.1899 |
| 51085 | MLXIPL | A001-C-007 | Human | Colorectum | CRC | 2.85e-08 | 8.17e-01 | 0.1899 |
| 51085 | MLXIPL | F072B | Human | Colorectum | FAP | 1.38e-03 | 4.63e-01 | 0.257 |
| 51085 | MLXIPL | CRC-1-8810 | Human | Colorectum | CRC | 1.92e-07 | 5.34e-01 | 0.6257 |
| 51085 | MLXIPL | NAFLD1 | Human | Liver | NAFLD | 1.46e-10 | 1.16e+00 | -0.04 |
| 51085 | MLXIPL | S43 | Human | Liver | Cirrhotic | 2.17e-11 | -3.33e-01 | -0.0187 |
| 51085 | MLXIPL | HCC1_Meng | Human | Liver | HCC | 9.32e-68 | -3.44e-02 | 0.0246 |
| 51085 | MLXIPL | HCC2_Meng | Human | Liver | HCC | 5.36e-17 | -3.62e-01 | 0.0107 |
| 51085 | MLXIPL | cirrhotic1 | Human | Liver | Cirrhotic | 1.02e-10 | -3.50e-02 | 0.0202 |
| 51085 | MLXIPL | cirrhotic2 | Human | Liver | Cirrhotic | 4.18e-09 | -9.91e-02 | 0.0201 |
| 51085 | MLXIPL | cirrhotic3 | Human | Liver | Cirrhotic | 2.49e-03 | -2.47e-01 | 0.0215 |
| 51085 | MLXIPL | HCC1 | Human | Liver | HCC | 2.13e-24 | 4.76e+00 | 0.5336 |
| 51085 | MLXIPL | HCC2 | Human | Liver | HCC | 3.30e-40 | 5.43e+00 | 0.5341 |
| Page: 1 2 |
| Tissue | Expression Dynamics | Abbreviation |
| Colorectum (GSE201348) |  | FAP: Familial adenomatous polyposis |
| CRC: Colorectal cancer | ||
| Colorectum (HTA11) | 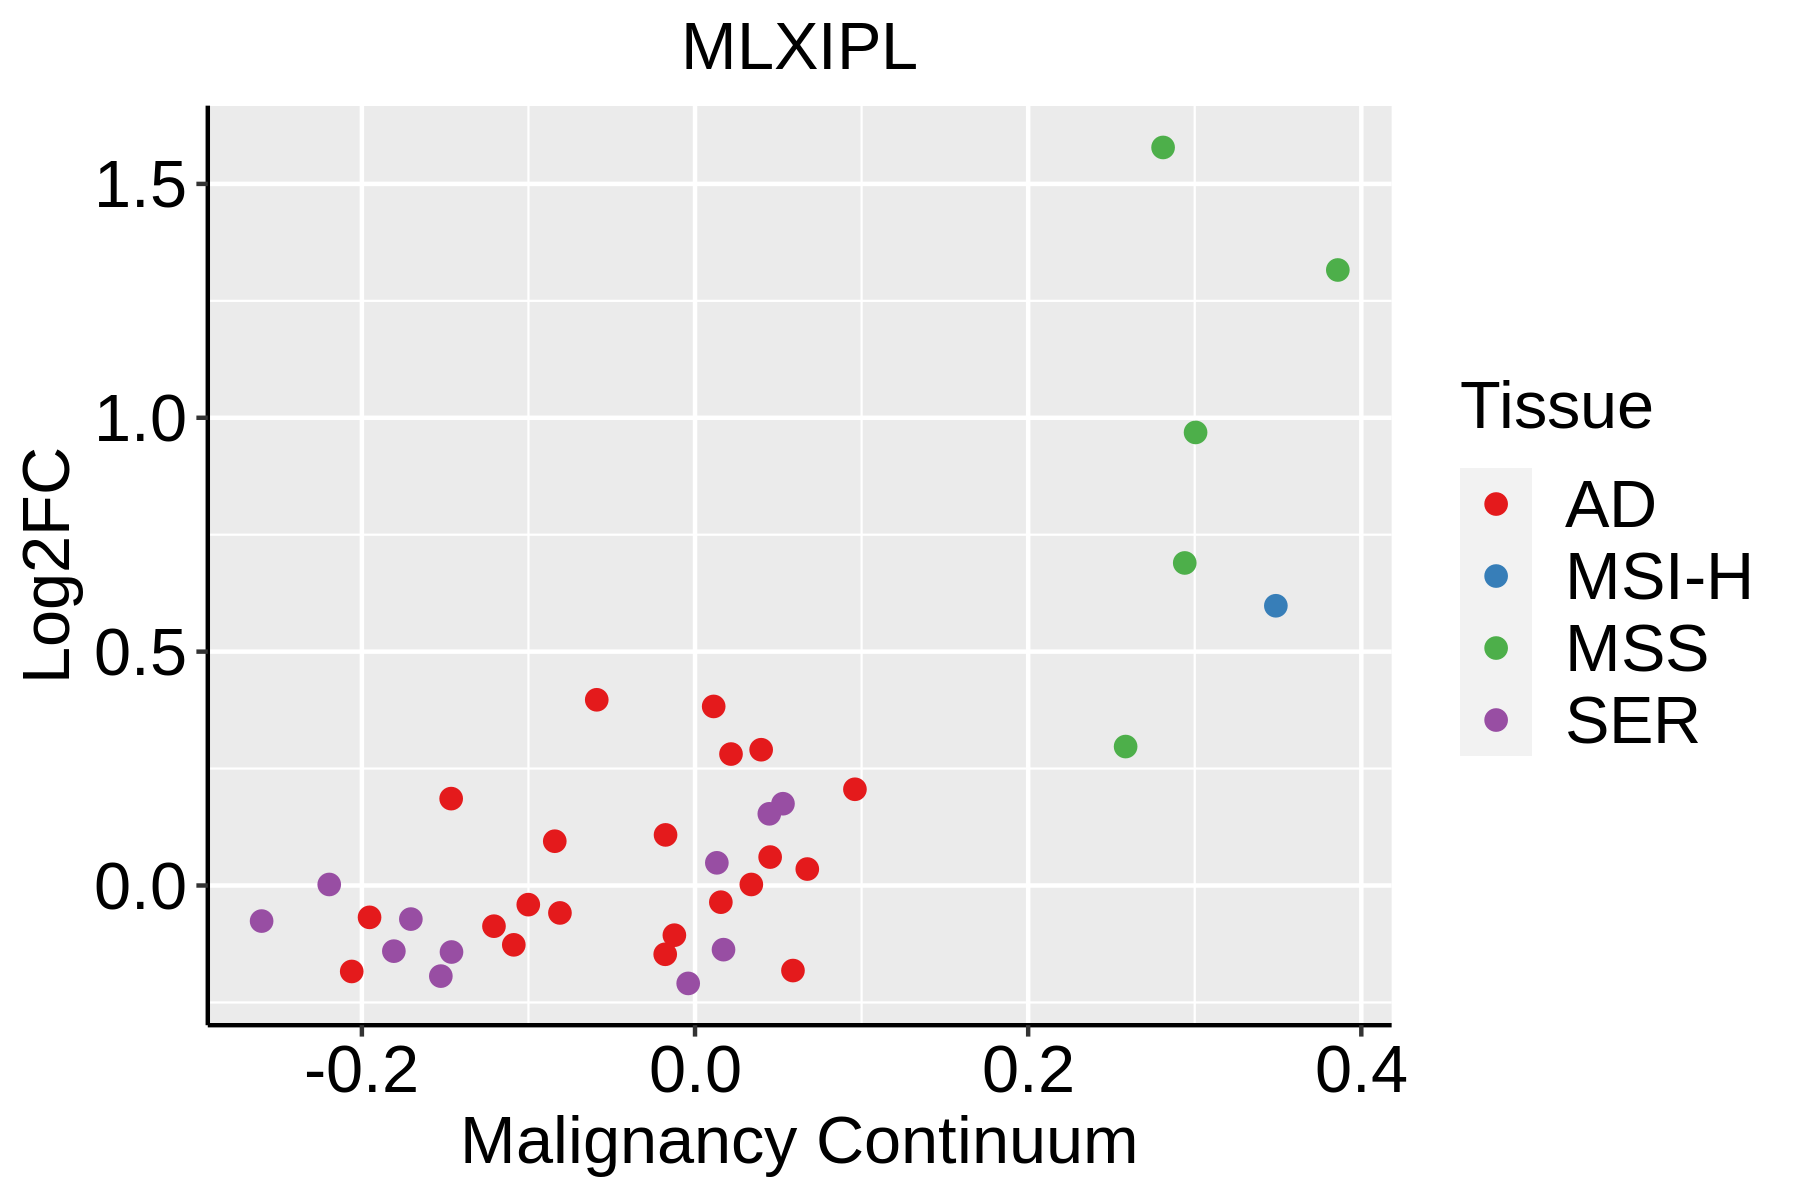 | AD: Adenomas |
| SER: Sessile serrated lesions | ||
| MSI-H: Microsatellite-high colorectal cancer | ||
| MSS: Microsatellite stable colorectal cancer | ||
| Liver | 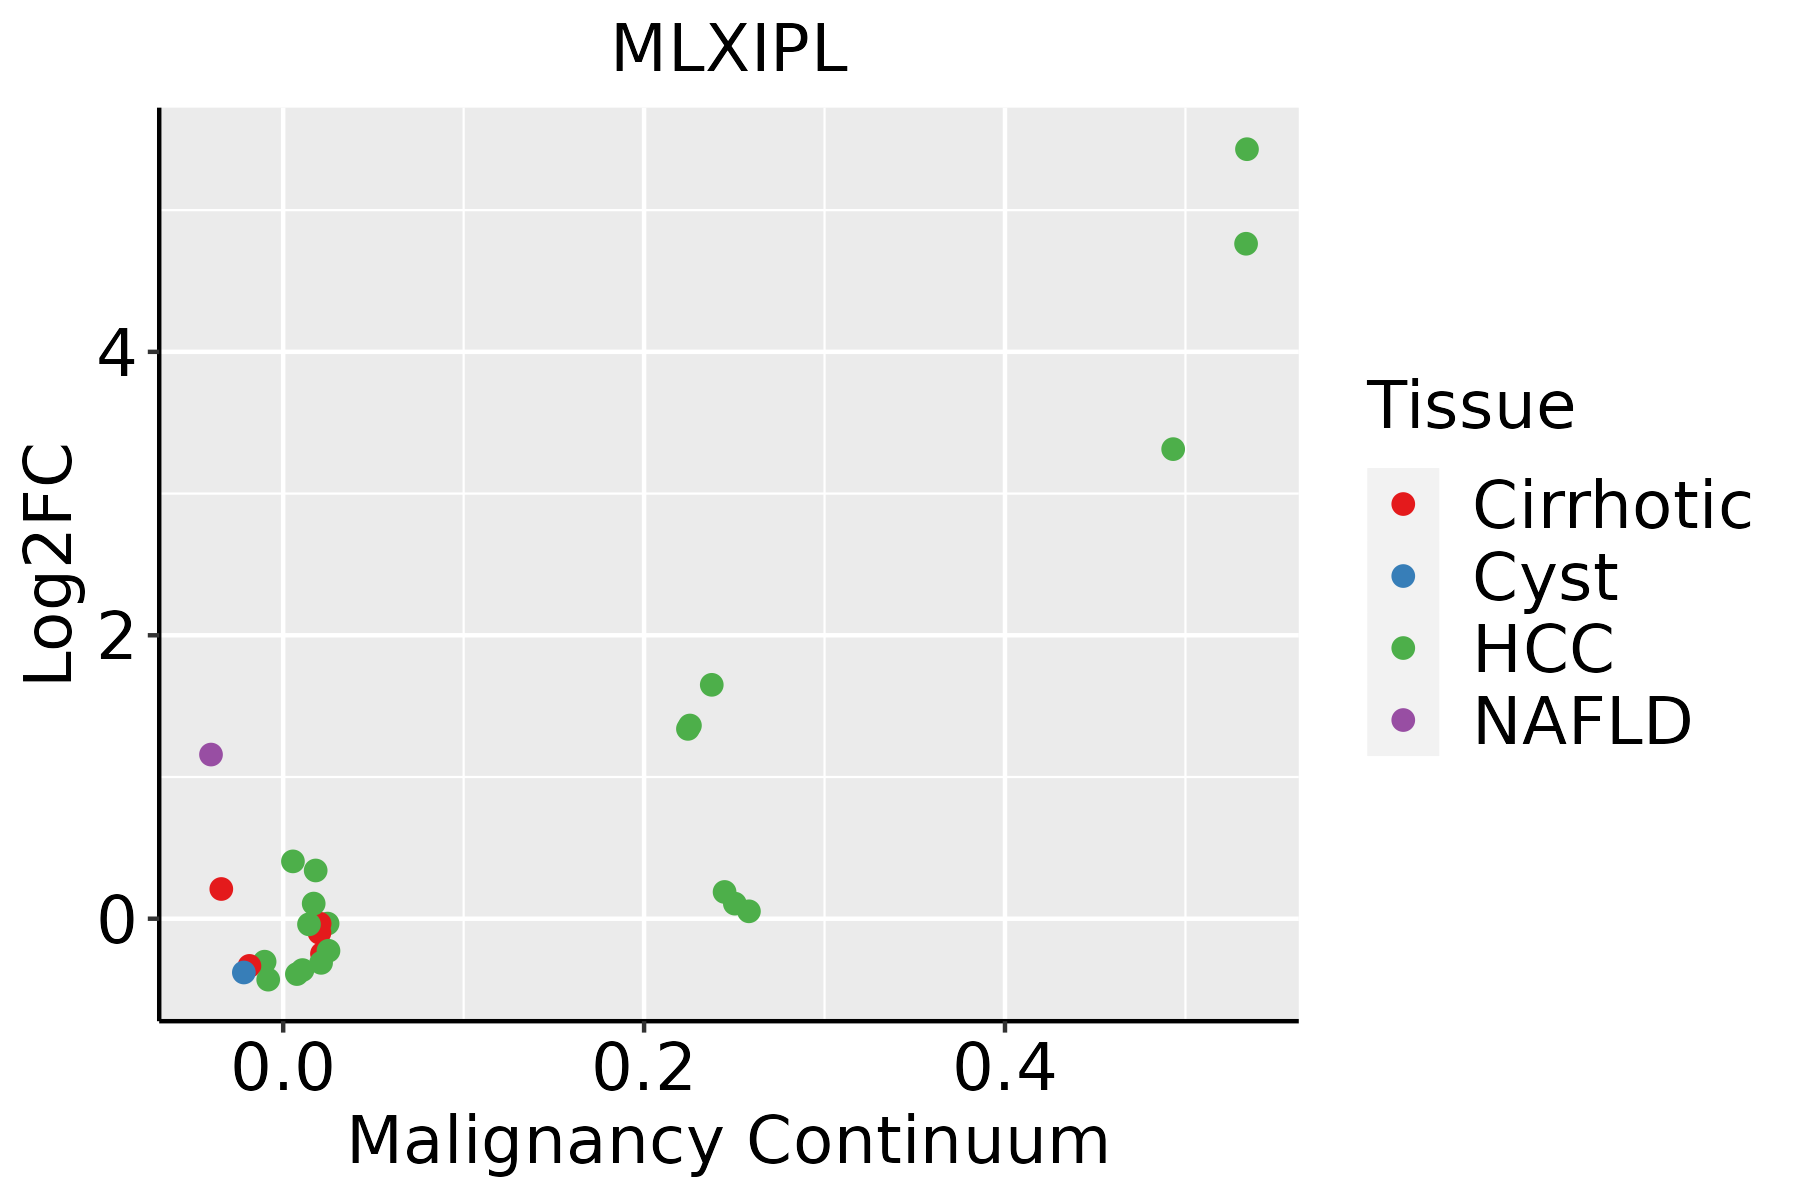 | HCC: Hepatocellular carcinoma |
| NAFLD: Non-alcoholic fatty liver disease |
| ∗log2FC in expression of this searched gene in stem-like cells from each diseased tissue sample relative to stem-like cells in normal samples in each tissue plotted against the malignancy continuum. Samples are colored based on if they are from different disease stage. |
Top |
Malignant transformation related pathway analysis |
| Find out the enriched GO biological processes and KEGG pathways involved in transition from healthy to precancer to cancer |
| Tissue | Disease Stage | Enriched GO biological Processes |
| Colorectum | AD |  |
| Colorectum | SER |  |
| Colorectum | MSS |  |
| Colorectum | MSI-H |  |
| Colorectum | FAP |  |
| ∗Top 15 enriched GO BP terms are showed in the bar plot of each disease state in each tissue. Each row represents a significant GO biological process which is colored according to the -log10(p.adjust). |
| Page: 1 2 3 4 5 6 7 8 9 |
| GO ID | Tissue | Disease Stage | Description | Gene Ratio | Bg Ratio | pvalue | p.adjust | Count |
| GO:1903578 | Colorectum | AD | regulation of ATP metabolic process | 34/3918 | 87/18723 | 8.30e-05 | 1.30e-03 | 34 |
| GO:0001933 | Colorectum | AD | negative regulation of protein phosphorylation | 101/3918 | 342/18723 | 9.39e-05 | 1.42e-03 | 101 |
| GO:0071331 | Colorectum | AD | cellular response to hexose stimulus | 52/3918 | 153/18723 | 1.16e-04 | 1.71e-03 | 52 |
| GO:0071326 | Colorectum | AD | cellular response to monosaccharide stimulus | 52/3918 | 154/18723 | 1.40e-04 | 1.98e-03 | 52 |
| GO:0043470 | Colorectum | AD | regulation of carbohydrate catabolic process | 23/3918 | 56/18723 | 4.91e-04 | 5.32e-03 | 23 |
| GO:0006110 | Colorectum | AD | regulation of glycolytic process | 19/3918 | 45/18723 | 9.94e-04 | 9.28e-03 | 19 |
| GO:0006109 | Colorectum | AD | regulation of carbohydrate metabolic process | 55/3918 | 178/18723 | 1.10e-03 | 1.01e-02 | 55 |
| GO:0043457 | Colorectum | AD | regulation of cellular respiration | 20/3918 | 49/18723 | 1.23e-03 | 1.09e-02 | 20 |
| GO:1903715 | Colorectum | AD | regulation of aerobic respiration | 15/3918 | 33/18723 | 1.36e-03 | 1.18e-02 | 15 |
| GO:1903579 | Colorectum | AD | negative regulation of ATP metabolic process | 14/3918 | 30/18723 | 1.43e-03 | 1.22e-02 | 14 |
| GO:0062012 | Colorectum | AD | regulation of small molecule metabolic process | 93/3918 | 334/18723 | 1.46e-03 | 1.24e-02 | 93 |
| GO:0018105 | Colorectum | AD | peptidyl-serine phosphorylation | 88/3918 | 315/18723 | 1.73e-03 | 1.43e-02 | 88 |
| GO:1903580 | Colorectum | AD | positive regulation of ATP metabolic process | 16/3918 | 38/18723 | 2.53e-03 | 1.93e-02 | 16 |
| GO:0018209 | Colorectum | AD | peptidyl-serine modification | 92/3918 | 338/18723 | 3.19e-03 | 2.36e-02 | 92 |
| GO:0045981 | Colorectum | AD | positive regulation of nucleotide metabolic process | 17/3918 | 43/18723 | 4.15e-03 | 2.87e-02 | 17 |
| GO:1900544 | Colorectum | AD | positive regulation of purine nucleotide metabolic process | 17/3918 | 43/18723 | 4.15e-03 | 2.87e-02 | 17 |
| GO:00090602 | Colorectum | MSS | aerobic respiration | 98/3467 | 189/18723 | 3.35e-25 | 1.05e-21 | 98 |
| GO:00060912 | Colorectum | MSS | generation of precursor metabolites and energy | 186/3467 | 490/18723 | 1.14e-24 | 2.15e-21 | 186 |
| GO:00460342 | Colorectum | MSS | ATP metabolic process | 125/3467 | 277/18723 | 1.38e-24 | 2.15e-21 | 125 |
| GO:00453332 | Colorectum | MSS | cellular respiration | 107/3467 | 230/18723 | 1.64e-22 | 2.05e-19 | 107 |
| Page: 1 2 3 4 5 6 7 8 9 10 11 12 13 14 15 16 17 18 19 20 21 |
| Pathway ID | Tissue | Disease Stage | Description | Gene Ratio | Bg Ratio | pvalue | p.adjust | qvalue | Count |
| hsa049324 | Colorectum | MSS | Non-alcoholic fatty liver disease | 85/1875 | 155/8465 | 4.19e-19 | 1.17e-17 | 7.17e-18 | 85 |
| hsa04931 | Colorectum | MSS | Insulin resistance | 36/1875 | 108/8465 | 4.74e-03 | 2.01e-02 | 1.23e-02 | 36 |
| hsa049325 | Colorectum | MSS | Non-alcoholic fatty liver disease | 85/1875 | 155/8465 | 4.19e-19 | 1.17e-17 | 7.17e-18 | 85 |
| hsa049311 | Colorectum | MSS | Insulin resistance | 36/1875 | 108/8465 | 4.74e-03 | 2.01e-02 | 1.23e-02 | 36 |
| hsa049328 | Colorectum | FAP | Non-alcoholic fatty liver disease | 54/1404 | 155/8465 | 1.98e-08 | 6.20e-07 | 3.77e-07 | 54 |
| hsa049312 | Colorectum | FAP | Insulin resistance | 32/1404 | 108/8465 | 4.90e-04 | 3.56e-03 | 2.16e-03 | 32 |
| hsa049329 | Colorectum | FAP | Non-alcoholic fatty liver disease | 54/1404 | 155/8465 | 1.98e-08 | 6.20e-07 | 3.77e-07 | 54 |
| hsa049313 | Colorectum | FAP | Insulin resistance | 32/1404 | 108/8465 | 4.90e-04 | 3.56e-03 | 2.16e-03 | 32 |
| hsa049314 | Colorectum | CRC | Insulin resistance | 28/1091 | 108/8465 | 1.78e-04 | 2.37e-03 | 1.61e-03 | 28 |
| hsa049315 | Colorectum | CRC | Insulin resistance | 28/1091 | 108/8465 | 1.78e-04 | 2.37e-03 | 1.61e-03 | 28 |
| hsa049316 | Liver | NAFLD | Insulin resistance | 29/1043 | 108/8465 | 3.01e-05 | 7.59e-04 | 6.11e-04 | 29 |
| hsa0493214 | Liver | NAFLD | Non-alcoholic fatty liver disease | 33/1043 | 155/8465 | 1.04e-03 | 1.42e-02 | 1.14e-02 | 33 |
| hsa0493111 | Liver | NAFLD | Insulin resistance | 29/1043 | 108/8465 | 3.01e-05 | 7.59e-04 | 6.11e-04 | 29 |
| hsa0493215 | Liver | NAFLD | Non-alcoholic fatty liver disease | 33/1043 | 155/8465 | 1.04e-03 | 1.42e-02 | 1.14e-02 | 33 |
| hsa0493222 | Liver | Cirrhotic | Non-alcoholic fatty liver disease | 106/2530 | 155/8465 | 2.16e-23 | 2.40e-21 | 1.48e-21 | 106 |
| hsa0493232 | Liver | Cirrhotic | Non-alcoholic fatty liver disease | 106/2530 | 155/8465 | 2.16e-23 | 2.40e-21 | 1.48e-21 | 106 |
| hsa0493242 | Liver | HCC | Non-alcoholic fatty liver disease | 124/4020 | 155/8465 | 4.54e-17 | 2.54e-15 | 1.41e-15 | 124 |
| hsa0493121 | Liver | HCC | Insulin resistance | 77/4020 | 108/8465 | 3.89e-07 | 4.46e-06 | 2.48e-06 | 77 |
| hsa0493252 | Liver | HCC | Non-alcoholic fatty liver disease | 124/4020 | 155/8465 | 4.54e-17 | 2.54e-15 | 1.41e-15 | 124 |
| hsa0493131 | Liver | HCC | Insulin resistance | 77/4020 | 108/8465 | 3.89e-07 | 4.46e-06 | 2.48e-06 | 77 |
| Page: 1 |
Top |
Cell-cell communication analysis |
| Identification of potential cell-cell interactions between two cell types and their ligand-receptor pairs for different disease states |
| Ligand | Receptor | LRpair | Pathway | Tissue | Disease Stage |
| Page: 1 |
Top |
Single-cell gene regulatory network inference analysis |
| Find out the significant the regulons (TFs) and the target genes of each regulon across cell types for different disease states |
| TF | Cell Type | Tissue | Disease Stage | Target Gene | RSS | Regulon Activity |
| MLXIPL | GOB | Esophagus | ESCC | SLC29A4,NBEA,ERO1B, etc. | 4.27e-03 |  |
| MLXIPL | DIFF | Esophagus | HGIN | SLC29A4,NBEA,ERO1B, etc. | 0.00e+00 |  |
| MLXIPL | GOB | Esophagus | HGIN | SLC29A4,NBEA,ERO1B, etc. | 0.00e+00 | |
| MLXIPL | ECM | Esophagus | ADJ | CFD,GPX3,GALNT15, etc. | 7.63e-01 |  |
| MLXIPL | PLA | Liver | HCC | SNORA76,SELO,MT-ND2, etc. | 2.06e-01 |  |
| MLXIPL | PLA | Liver | NAFLD | SNORA76,SELO,MT-ND2, etc. | 3.31e-01 |  |
| MLXIPL | MEGA | Liver | Cirrhotic | ITIH3,CES1,ITIH1, etc. | 2.16e-01 |  |
| MLXIPL | END | Liver | Cirrhotic | ITIH3,CES1,ITIH1, etc. | 0.00e+00 | |
| MLXIPL | HSC | Liver | HCC | ITIH3,CES1,ITIH1, etc. | 1.56e-01 | |
| MLXIPL | LYMEND | Liver | HCC | ITIH3,CES1,ITIH1, etc. | 8.30e-03 | |
| ∗The dot plots of a searched regulon are shown for all cell subpopulations in each disease state of each tissue based on the regulon specific score inferred using pySCENIC and by calculating the average expression. |
| Page: 1 2 |
Top |
Somatic mutation of malignant transformation related genes |
| Annotation of somatic variants for genes involved in malignant transformation |
| Hugo Symbol | Variant Class | Variant Classification | dbSNP RS | HGVSc | HGVSp | HGVSp Short | SWISSPROT | BIOTYPE | SIFT | PolyPhen | Tumor Sample Barcode | Tissue | Histology | Sex | Age | Stage | Therapy Types | Drugs | Outcome |
| MLXIPL | SNV | Missense_Mutation | c.2422N>G | p.Leu808Val | p.L808V | Q9NP71 | protein_coding | deleterious(0) | probably_damaging(0.991) | TCGA-AC-A5XS-01 | Breast | breast invasive carcinoma | Female | >=65 | I/II | Hormone Therapy | femara | SD | |
| MLXIPL | SNV | Missense_Mutation | novel | c.2437N>T | p.Pro813Ser | p.P813S | Q9NP71 | protein_coding | deleterious(0) | probably_damaging(0.996) | TCGA-BH-A0EA-01 | Breast | breast invasive carcinoma | Female | >=65 | I/II | Chemotherapy | taxotere | CR |
| MLXIPL | SNV | Missense_Mutation | novel | c.2033N>A | p.Thr678Lys | p.T678K | Q9NP71 | protein_coding | deleterious(0) | probably_damaging(0.966) | TCGA-UL-AAZ6-01 | Breast | breast invasive carcinoma | Female | >=65 | I/II | Chemotherapy | herceptin | SD |
| MLXIPL | SNV | Missense_Mutation | novel | c.962C>T | p.Pro321Leu | p.P321L | Q9NP71 | protein_coding | deleterious(0.02) | benign(0) | TCGA-2W-A8YY-01 | Cervix | cervical & endocervical cancer | Female | <65 | I/II | Chemotherapy | cisplatin | CR |
| MLXIPL | SNV | Missense_Mutation | rs551026243 | c.1034N>T | p.Ser345Leu | p.S345L | Q9NP71 | protein_coding | tolerated(0.51) | benign(0) | TCGA-C5-A1BQ-01 | Cervix | cervical & endocervical cancer | Female | >=65 | III/IV | Chemotherapy | cisplatin | CR |
| MLXIPL | SNV | Missense_Mutation | c.838G>C | p.Asp280His | p.D280H | Q9NP71 | protein_coding | deleterious(0) | probably_damaging(0.993) | TCGA-DR-A0ZM-01 | Cervix | cervical & endocervical cancer | Female | <65 | III/IV | Unspecific | Cisplatin | SD | |
| MLXIPL | SNV | Missense_Mutation | rs551026243 | c.1034C>T | p.Ser345Leu | p.S345L | Q9NP71 | protein_coding | tolerated(0.51) | benign(0) | TCGA-AA-3492-01 | Colorectum | colon adenocarcinoma | Female | >=65 | I/II | Unknown | Unknown | SD |
| MLXIPL | SNV | Missense_Mutation | c.199N>C | p.Asp67His | p.D67H | Q9NP71 | protein_coding | tolerated(0.45) | possibly_damaging(0.511) | TCGA-AA-3510-01 | Colorectum | colon adenocarcinoma | Male | >=65 | I/II | Unknown | Unknown | SD | |
| MLXIPL | SNV | Missense_Mutation | rs781908299 | c.1916N>A | p.Arg639Gln | p.R639Q | Q9NP71 | protein_coding | tolerated(0.21) | probably_damaging(0.921) | TCGA-AM-5821-01 | Colorectum | colon adenocarcinoma | Female | >=65 | I/II | Unknown | Unknown | SD |
| MLXIPL | SNV | Missense_Mutation | c.1315N>G | p.Thr439Ala | p.T439A | Q9NP71 | protein_coding | tolerated(0.6) | benign(0) | TCGA-AY-6197-01 | Colorectum | colon adenocarcinoma | Male | <65 | I/II | Unknown | Unknown | SD |
| Page: 1 2 3 4 5 6 7 8 |
Top |
Related drugs of malignant transformation related genes |
| Identification of chemicals and drugs interact with genes involved in malignant transfromation |
| (DGIdb 4.0) |
| Entrez ID | Symbol | Category | Interaction Types | Drug Claim Name | Drug Name | PMIDs |
| Page: 1 |

Copyright 2023-Present -The University of Texas Health Science Center at Houston |