
|
|||||
|
 | |
| |
| |
| |
| |
| |
|
Gene: MKNK2 |
Gene summary for MKNK2 |
| Gene information | Species | Human | Gene symbol | MKNK2 | Gene ID | 2872 |
| Gene name | MAPK interacting serine/threonine kinase 2 | |
| Gene Alias | GPRK7 | |
| Cytomap | 19p13.3 | |
| Gene Type | protein-coding | GO ID | GO:0002376 | UniProtAcc | Q9HBH9 |
Top |
Malignant transformation analysis |
| Identification of the aberrant gene expression in precancerous and cancerous lesions by comparing the gene expression of stem-like cells in diseased tissues with normal stem cells |
| Entrez ID | Symbol | Replicates | Species | Organ | Tissue | Adj P-value | Log2FC | Malignancy |
| 2872 | MKNK2 | HTA11_2487_2000001011 | Human | Colorectum | SER | 3.09e-27 | 9.66e-01 | -0.1808 |
| 2872 | MKNK2 | HTA11_1938_2000001011 | Human | Colorectum | AD | 3.82e-21 | 8.15e-01 | -0.0811 |
| 2872 | MKNK2 | HTA11_78_2000001011 | Human | Colorectum | AD | 8.82e-10 | 5.54e-01 | -0.1088 |
| 2872 | MKNK2 | HTA11_347_2000001011 | Human | Colorectum | AD | 5.49e-31 | 8.62e-01 | -0.1954 |
| 2872 | MKNK2 | HTA11_411_2000001011 | Human | Colorectum | SER | 4.81e-11 | 1.38e+00 | -0.2602 |
| 2872 | MKNK2 | HTA11_2112_2000001011 | Human | Colorectum | SER | 3.09e-13 | 1.13e+00 | -0.2196 |
| 2872 | MKNK2 | HTA11_3361_2000001011 | Human | Colorectum | AD | 3.46e-12 | 7.28e-01 | -0.1207 |
| 2872 | MKNK2 | HTA11_83_2000001011 | Human | Colorectum | SER | 1.14e-09 | 6.44e-01 | -0.1526 |
| 2872 | MKNK2 | HTA11_696_2000001011 | Human | Colorectum | AD | 4.33e-22 | 6.51e-01 | -0.1464 |
| 2872 | MKNK2 | HTA11_866_2000001011 | Human | Colorectum | AD | 3.80e-21 | 5.92e-01 | -0.1001 |
| 2872 | MKNK2 | HTA11_1391_2000001011 | Human | Colorectum | AD | 1.31e-19 | 9.08e-01 | -0.059 |
| 2872 | MKNK2 | HTA11_2992_2000001011 | Human | Colorectum | SER | 1.18e-05 | 7.81e-01 | -0.1706 |
| 2872 | MKNK2 | HTA11_5212_2000001011 | Human | Colorectum | AD | 7.12e-10 | 9.42e-01 | -0.2061 |
| 2872 | MKNK2 | HTA11_5216_2000001011 | Human | Colorectum | SER | 1.72e-02 | 6.12e-01 | -0.1462 |
| 2872 | MKNK2 | HTA11_546_2000001011 | Human | Colorectum | AD | 1.23e-10 | 6.95e-01 | -0.0842 |
| 2872 | MKNK2 | HTA11_866_3004761011 | Human | Colorectum | AD | 1.61e-12 | 5.76e-01 | 0.096 |
| 2872 | MKNK2 | HTA11_4255_2000001011 | Human | Colorectum | SER | 1.80e-02 | 6.12e-01 | 0.0446 |
| 2872 | MKNK2 | HTA11_7663_2000001011 | Human | Colorectum | SER | 1.89e-03 | 4.81e-01 | 0.0131 |
| 2872 | MKNK2 | HTA11_10623_2000001011 | Human | Colorectum | AD | 4.37e-05 | 5.74e-01 | -0.0177 |
| 2872 | MKNK2 | HTA11_10711_2000001011 | Human | Colorectum | AD | 6.90e-05 | 3.39e-01 | 0.0338 |
| Page: 1 2 3 4 5 6 7 8 9 |
| Tissue | Expression Dynamics | Abbreviation |
| Colorectum (GSE201348) | 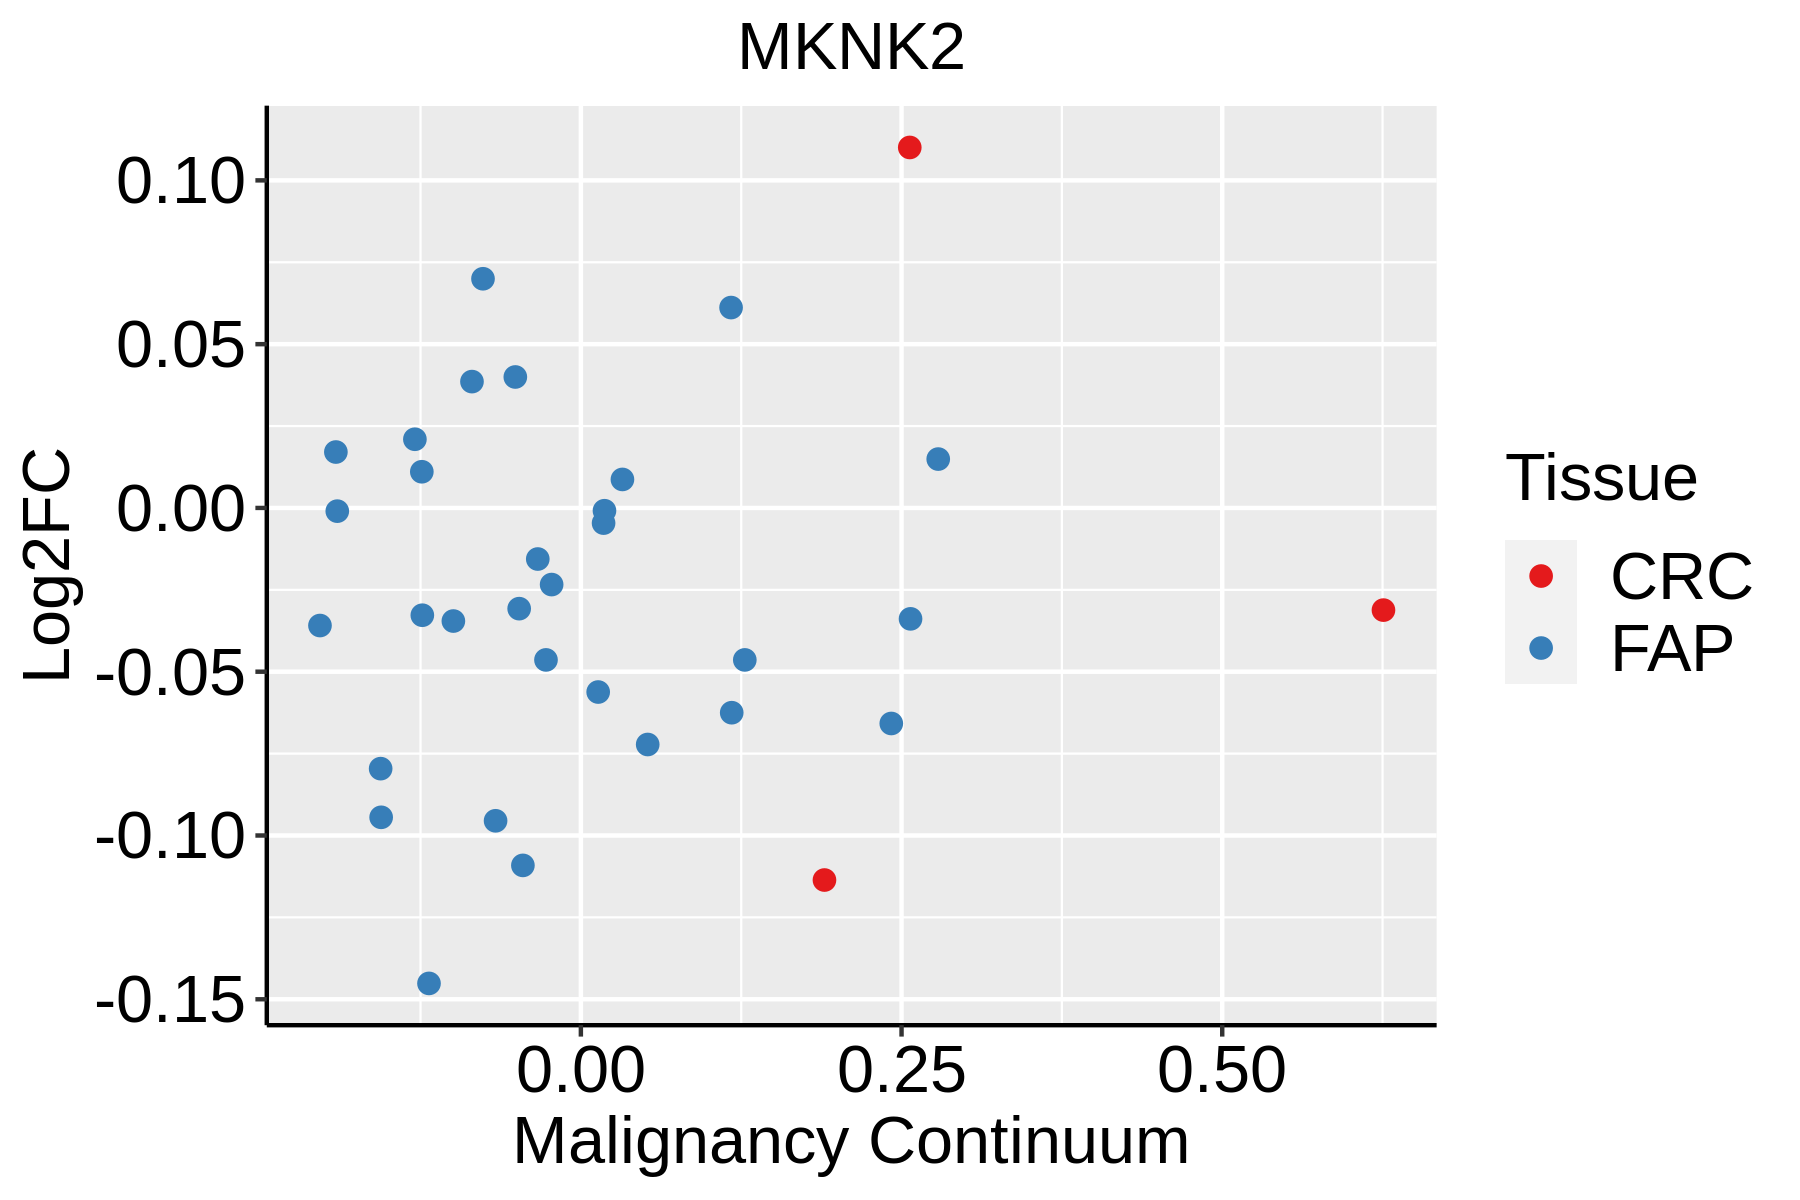 | FAP: Familial adenomatous polyposis |
| CRC: Colorectal cancer | ||
| Colorectum (HTA11) | 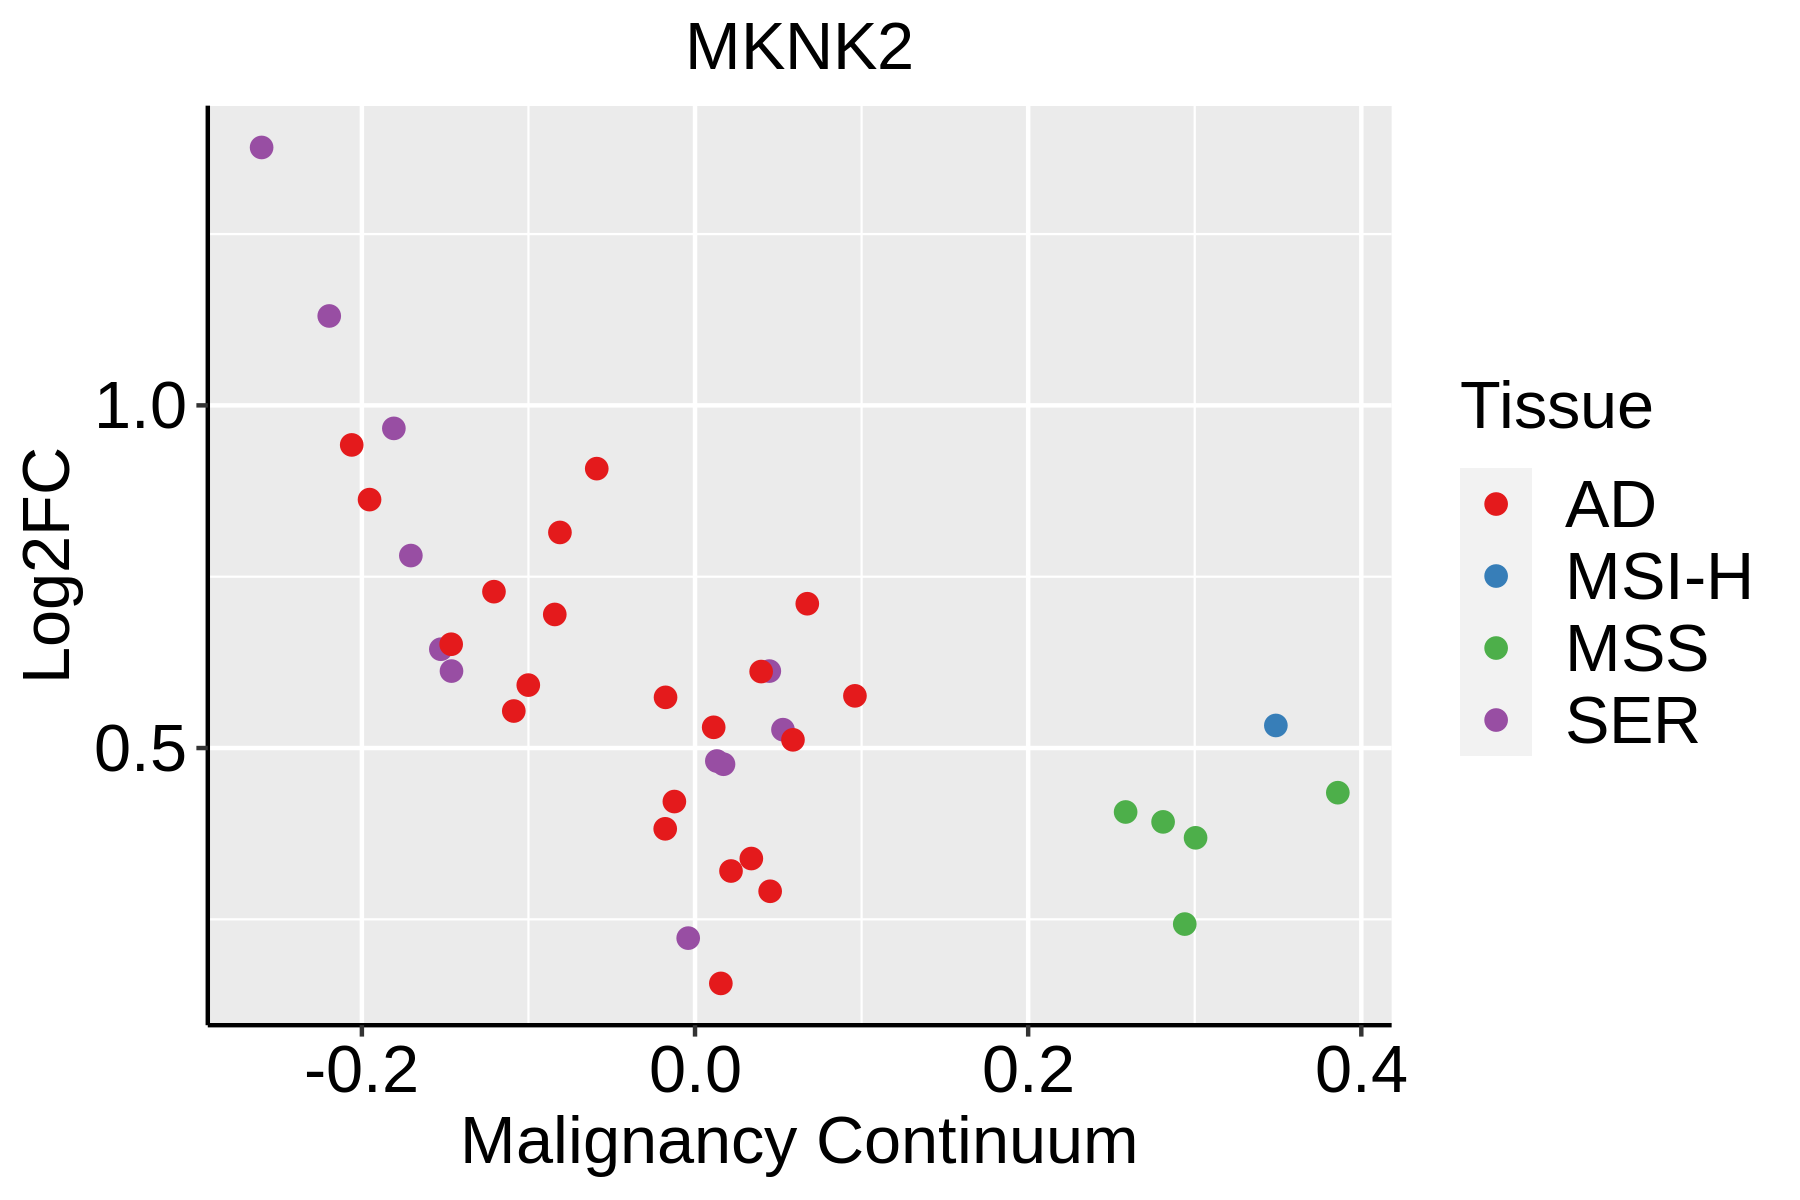 | AD: Adenomas |
| SER: Sessile serrated lesions | ||
| MSI-H: Microsatellite-high colorectal cancer | ||
| MSS: Microsatellite stable colorectal cancer | ||
| Esophagus |  | ESCC: Esophageal squamous cell carcinoma |
| HGIN: High-grade intraepithelial neoplasias | ||
| LGIN: Low-grade intraepithelial neoplasias | ||
| Liver | 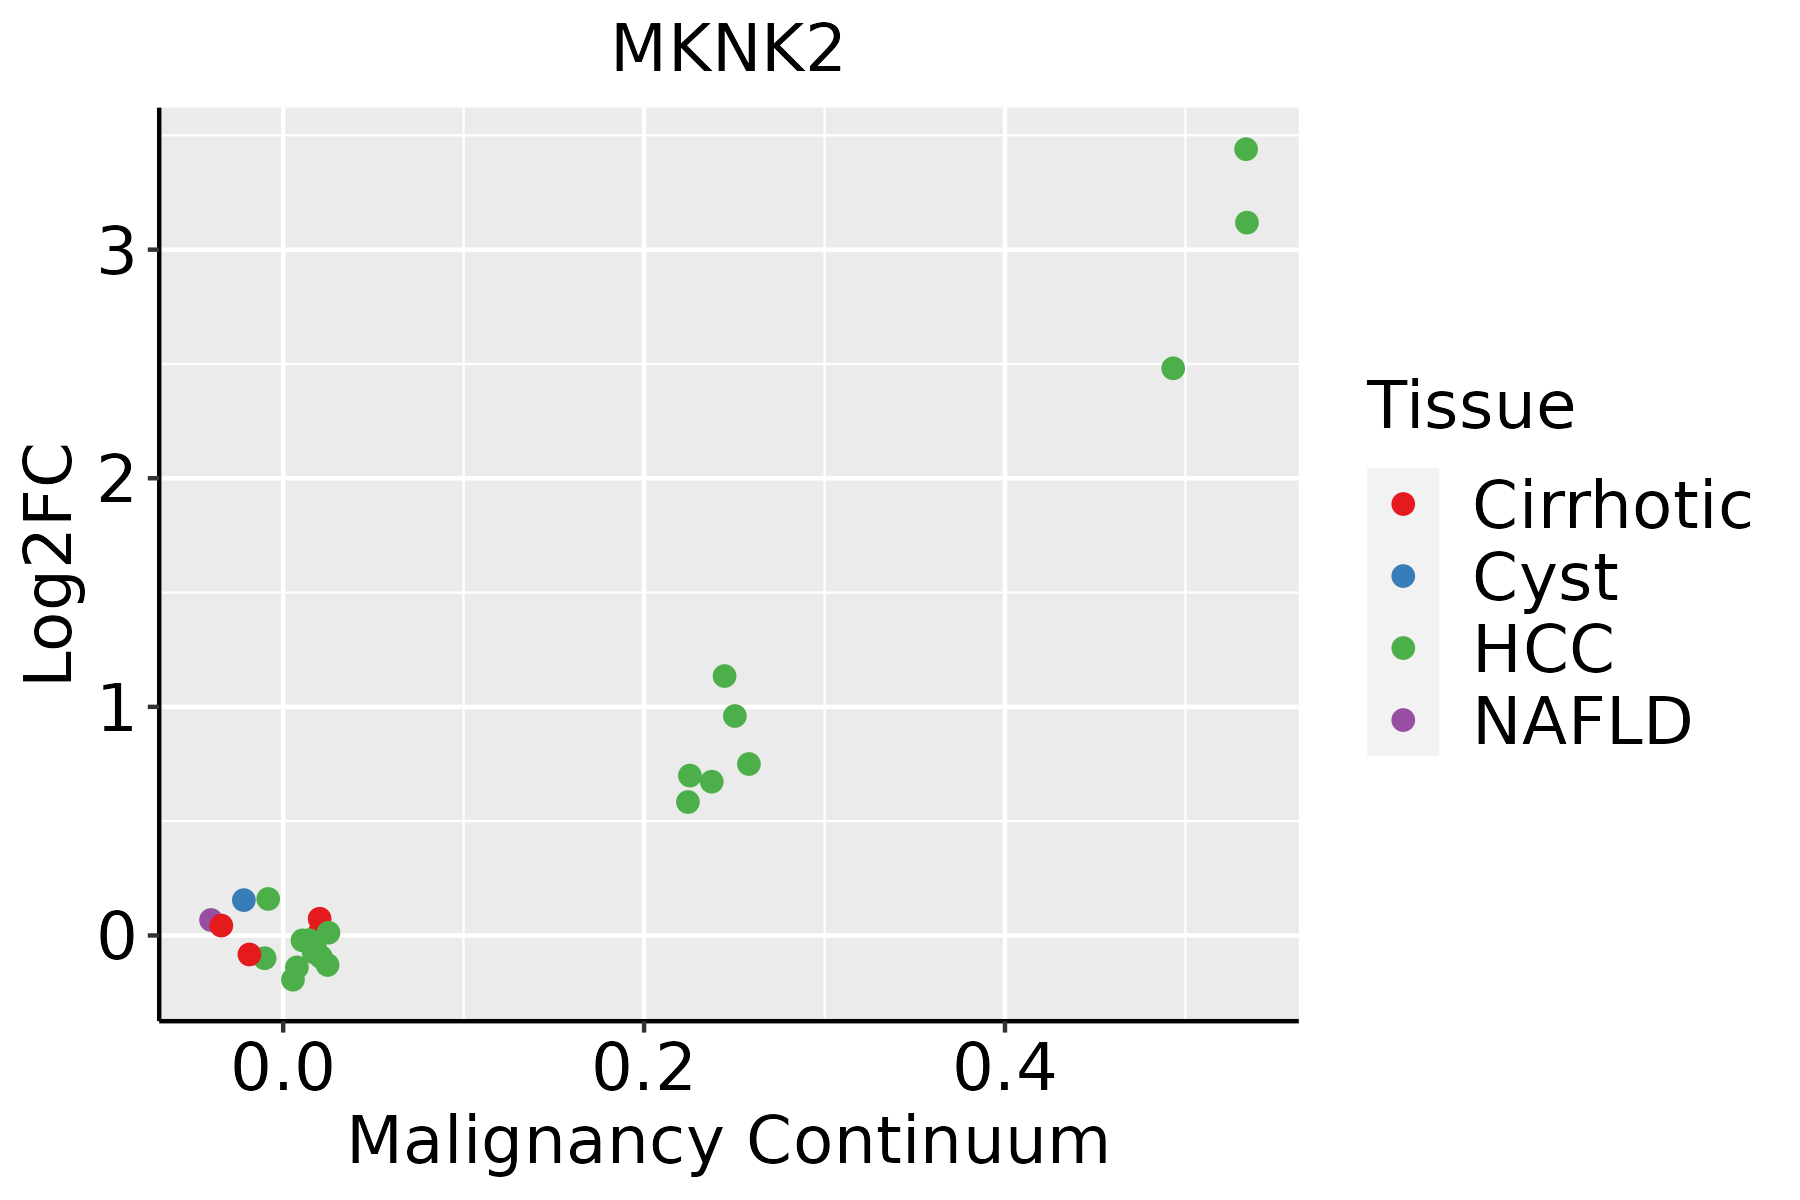 | HCC: Hepatocellular carcinoma |
| NAFLD: Non-alcoholic fatty liver disease | ||
| Oral Cavity | 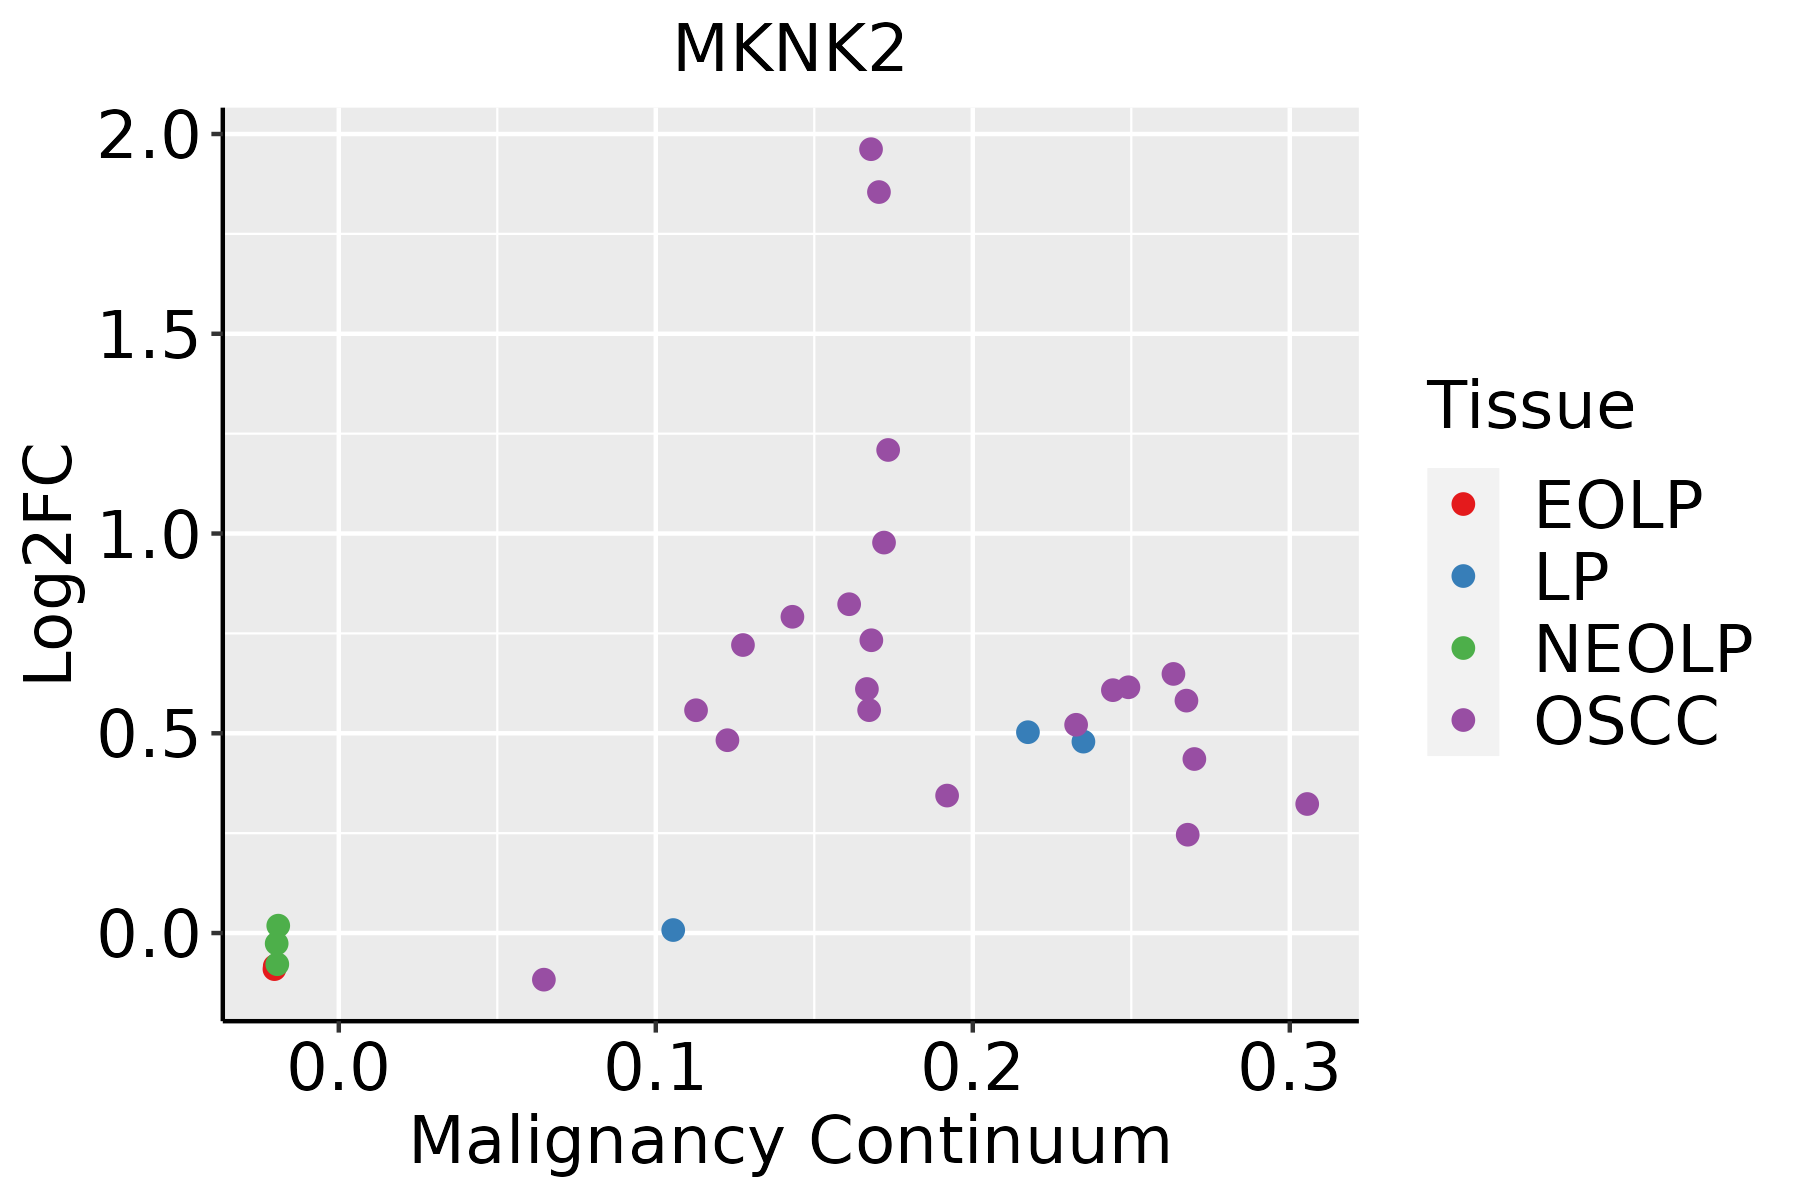 | EOLP: Erosive Oral lichen planus |
| LP: leukoplakia | ||
| NEOLP: Non-erosive oral lichen planus | ||
| OSCC: Oral squamous cell carcinoma | ||
| Prostate |  | BPH: Benign Prostatic Hyperplasia |
| Skin | 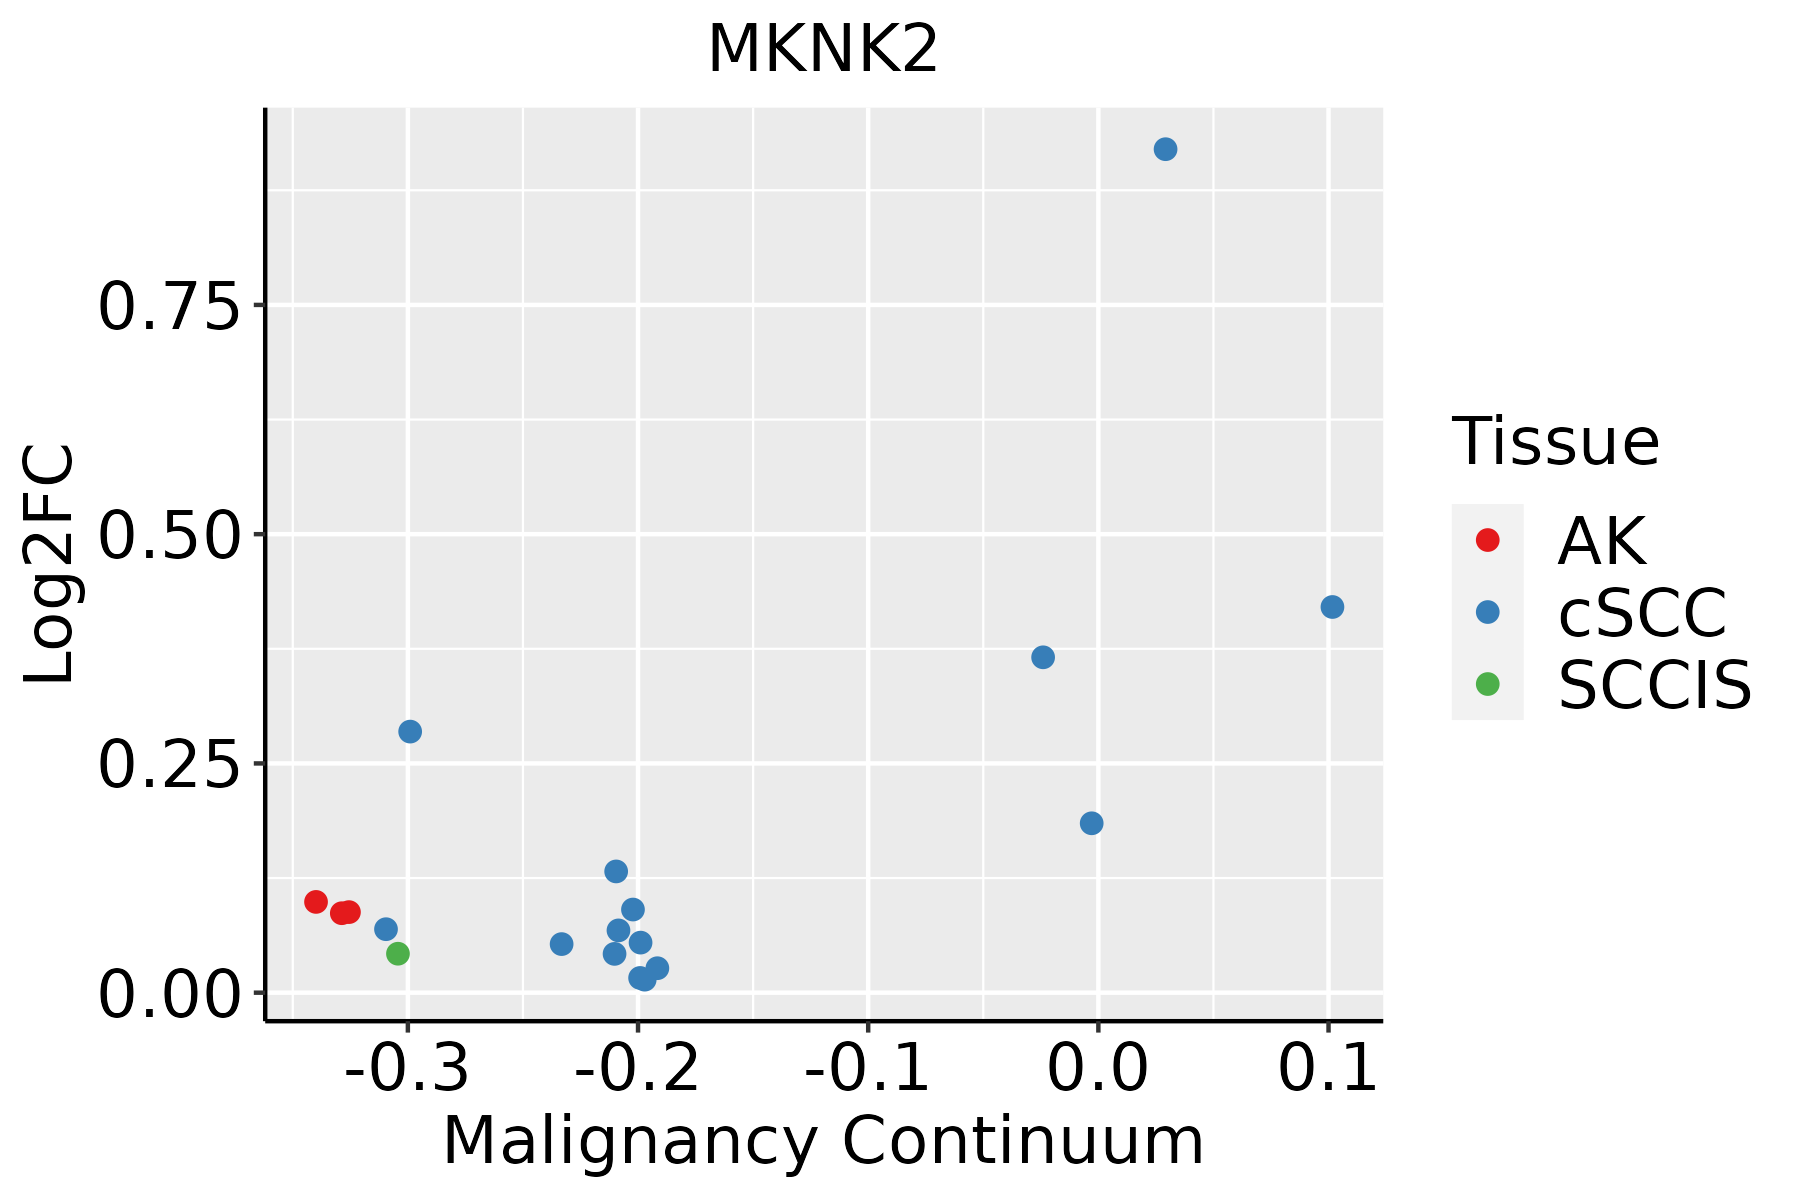 | AK: Actinic keratosis |
| cSCC: Cutaneous squamous cell carcinoma | ||
| SCCIS:squamous cell carcinoma in situ | ||
| Thyroid | 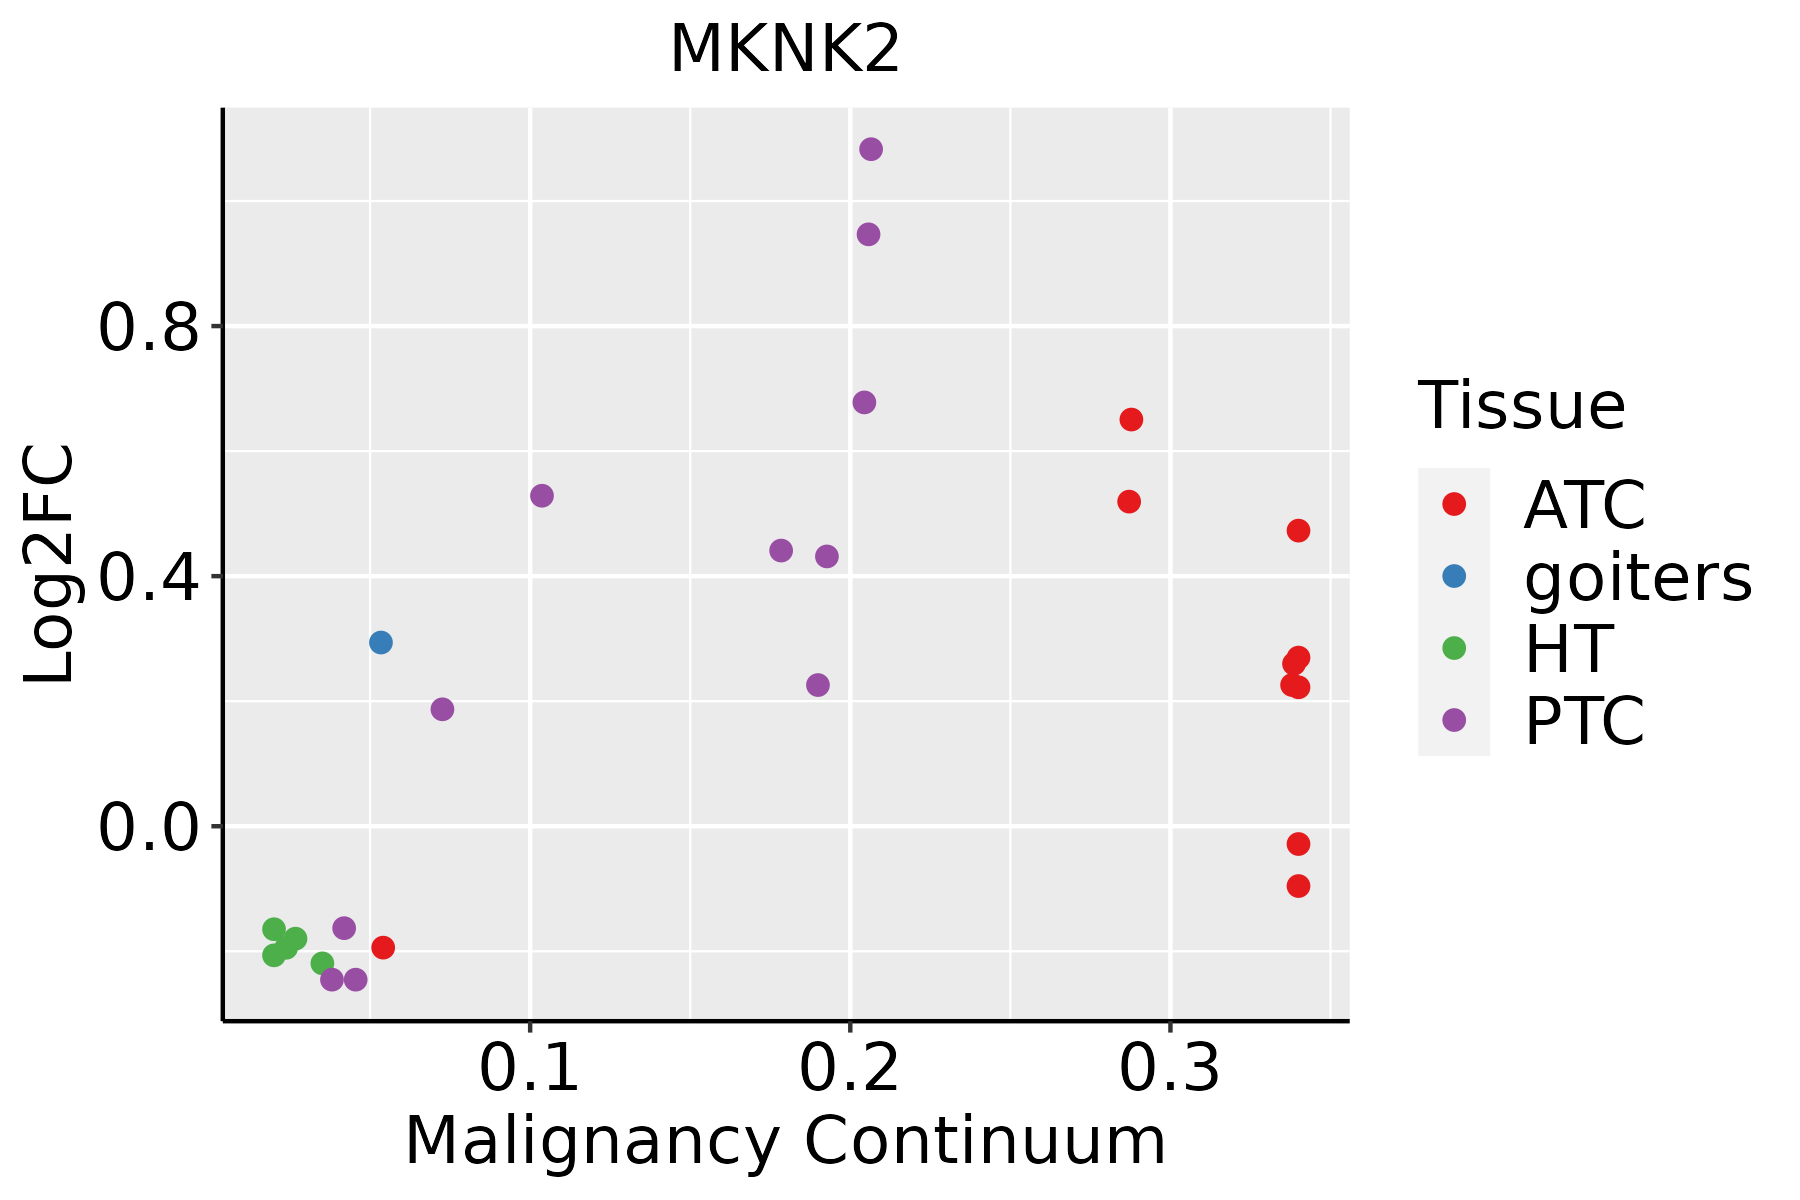 | ATC: Anaplastic thyroid cancer |
| HT: Hashimoto's thyroiditis | ||
| PTC: Papillary thyroid cancer |
| ∗log2FC in expression of this searched gene in stem-like cells from each diseased tissue sample relative to stem-like cells in normal samples in each tissue plotted against the malignancy continuum. Samples are colored based on if they are from different disease stage. |
Top |
Malignant transformation related pathway analysis |
| Find out the enriched GO biological processes and KEGG pathways involved in transition from healthy to precancer to cancer |
| Tissue | Disease Stage | Enriched GO biological Processes |
| Colorectum | AD |  |
| Colorectum | SER |  |
| Colorectum | MSS |  |
| Colorectum | MSI-H |  |
| Colorectum | FAP |  |
| ∗Top 15 enriched GO BP terms are showed in the bar plot of each disease state in each tissue. Each row represents a significant GO biological process which is colored according to the -log10(p.adjust). |
| Page: 1 2 3 4 5 6 7 8 9 |
| GO ID | Tissue | Disease Stage | Description | Gene Ratio | Bg Ratio | pvalue | p.adjust | Count |
| GO:001820911 | Liver | HCC | peptidyl-serine modification | 177/7958 | 338/18723 | 1.45e-04 | 1.17e-03 | 177 |
| GO:00467775 | Liver | HCC | protein autophosphorylation | 123/7958 | 227/18723 | 2.40e-04 | 1.80e-03 | 123 |
| GO:000641720 | Oral cavity | OSCC | regulation of translation | 274/7305 | 468/18723 | 4.39e-18 | 4.63e-16 | 274 |
| GO:009719120 | Oral cavity | OSCC | extrinsic apoptotic signaling pathway | 142/7305 | 219/18723 | 7.34e-15 | 4.55e-13 | 142 |
| GO:00466858 | Oral cavity | OSCC | response to arsenic-containing substance | 27/7305 | 33/18723 | 5.91e-07 | 8.51e-06 | 27 |
| GO:00182098 | Oral cavity | OSCC | peptidyl-serine modification | 175/7305 | 338/18723 | 1.09e-06 | 1.46e-05 | 175 |
| GO:001810510 | Oral cavity | OSCC | peptidyl-serine phosphorylation | 164/7305 | 315/18723 | 1.51e-06 | 1.99e-05 | 164 |
| GO:00467779 | Oral cavity | OSCC | protein autophosphorylation | 123/7305 | 227/18723 | 2.31e-06 | 2.93e-05 | 123 |
| GO:00380346 | Oral cavity | OSCC | signal transduction in absence of ligand | 44/7305 | 65/18723 | 2.63e-06 | 3.26e-05 | 44 |
| GO:00971926 | Oral cavity | OSCC | extrinsic apoptotic signaling pathway in absence of ligand | 44/7305 | 65/18723 | 2.63e-06 | 3.26e-05 | 44 |
| GO:00712438 | Oral cavity | OSCC | cellular response to arsenic-containing substance | 18/7305 | 20/18723 | 3.28e-06 | 3.92e-05 | 18 |
| GO:0006417110 | Oral cavity | LP | regulation of translation | 175/4623 | 468/18723 | 4.49e-10 | 2.22e-08 | 175 |
| GO:007124315 | Oral cavity | LP | cellular response to arsenic-containing substance | 18/4623 | 20/18723 | 1.27e-09 | 5.84e-08 | 18 |
| GO:0097191110 | Oral cavity | LP | extrinsic apoptotic signaling pathway | 91/4623 | 219/18723 | 2.69e-08 | 9.80e-07 | 91 |
| GO:004668513 | Oral cavity | LP | response to arsenic-containing substance | 22/4623 | 33/18723 | 4.25e-07 | 1.21e-05 | 22 |
| GO:000641718 | Prostate | BPH | regulation of translation | 157/3107 | 468/18723 | 9.09e-20 | 5.63e-17 | 157 |
| GO:009719118 | Prostate | BPH | extrinsic apoptotic signaling pathway | 77/3107 | 219/18723 | 1.67e-11 | 1.19e-09 | 77 |
| GO:00466857 | Prostate | BPH | response to arsenic-containing substance | 17/3107 | 33/18723 | 4.14e-06 | 6.25e-05 | 17 |
| GO:00712437 | Prostate | BPH | cellular response to arsenic-containing substance | 12/3107 | 20/18723 | 1.44e-05 | 1.87e-04 | 12 |
| GO:00181059 | Prostate | BPH | peptidyl-serine phosphorylation | 79/3107 | 315/18723 | 7.09e-05 | 6.96e-04 | 79 |
| Page: 1 2 3 4 5 |
| Pathway ID | Tissue | Disease Stage | Description | Gene Ratio | Bg Ratio | pvalue | p.adjust | qvalue | Count |
| hsa04066 | Colorectum | AD | HIF-1 signaling pathway | 48/2092 | 109/8465 | 7.25e-06 | 7.84e-05 | 5.00e-05 | 48 |
| hsa040661 | Colorectum | AD | HIF-1 signaling pathway | 48/2092 | 109/8465 | 7.25e-06 | 7.84e-05 | 5.00e-05 | 48 |
| hsa040662 | Colorectum | SER | HIF-1 signaling pathway | 36/1580 | 109/8465 | 2.27e-04 | 2.15e-03 | 1.56e-03 | 36 |
| hsa040663 | Colorectum | SER | HIF-1 signaling pathway | 36/1580 | 109/8465 | 2.27e-04 | 2.15e-03 | 1.56e-03 | 36 |
| hsa040664 | Colorectum | MSS | HIF-1 signaling pathway | 39/1875 | 109/8465 | 7.61e-04 | 5.00e-03 | 3.06e-03 | 39 |
| hsa04910 | Colorectum | MSS | Insulin signaling pathway | 43/1875 | 137/8465 | 7.37e-03 | 2.84e-02 | 1.74e-02 | 43 |
| hsa040665 | Colorectum | MSS | HIF-1 signaling pathway | 39/1875 | 109/8465 | 7.61e-04 | 5.00e-03 | 3.06e-03 | 39 |
| hsa049101 | Colorectum | MSS | Insulin signaling pathway | 43/1875 | 137/8465 | 7.37e-03 | 2.84e-02 | 1.74e-02 | 43 |
| hsa040666 | Colorectum | FAP | HIF-1 signaling pathway | 38/1404 | 109/8465 | 2.43e-06 | 4.28e-05 | 2.60e-05 | 38 |
| hsa04010 | Colorectum | FAP | MAPK signaling pathway | 68/1404 | 302/8465 | 4.00e-03 | 1.67e-02 | 1.02e-02 | 68 |
| hsa040667 | Colorectum | FAP | HIF-1 signaling pathway | 38/1404 | 109/8465 | 2.43e-06 | 4.28e-05 | 2.60e-05 | 38 |
| hsa040101 | Colorectum | FAP | MAPK signaling pathway | 68/1404 | 302/8465 | 4.00e-03 | 1.67e-02 | 1.02e-02 | 68 |
| hsa0406629 | Esophagus | ESCC | HIF-1 signaling pathway | 75/4205 | 109/8465 | 3.66e-05 | 1.68e-04 | 8.60e-05 | 75 |
| hsa049109 | Esophagus | ESCC | Insulin signaling pathway | 89/4205 | 137/8465 | 1.97e-04 | 7.32e-04 | 3.75e-04 | 89 |
| hsa04066113 | Esophagus | ESCC | HIF-1 signaling pathway | 75/4205 | 109/8465 | 3.66e-05 | 1.68e-04 | 8.60e-05 | 75 |
| hsa0491014 | Esophagus | ESCC | Insulin signaling pathway | 89/4205 | 137/8465 | 1.97e-04 | 7.32e-04 | 3.75e-04 | 89 |
| hsa0491021 | Liver | Cirrhotic | Insulin signaling pathway | 56/2530 | 137/8465 | 3.74e-03 | 1.50e-02 | 9.26e-03 | 56 |
| hsa0406612 | Liver | Cirrhotic | HIF-1 signaling pathway | 46/2530 | 109/8465 | 4.00e-03 | 1.59e-02 | 9.78e-03 | 46 |
| hsa0491031 | Liver | Cirrhotic | Insulin signaling pathway | 56/2530 | 137/8465 | 3.74e-03 | 1.50e-02 | 9.26e-03 | 56 |
| hsa0406613 | Liver | Cirrhotic | HIF-1 signaling pathway | 46/2530 | 109/8465 | 4.00e-03 | 1.59e-02 | 9.78e-03 | 46 |
| Page: 1 2 3 |
Top |
Cell-cell communication analysis |
| Identification of potential cell-cell interactions between two cell types and their ligand-receptor pairs for different disease states |
| Ligand | Receptor | LRpair | Pathway | Tissue | Disease Stage |
| Page: 1 |
Top |
Single-cell gene regulatory network inference analysis |
| Find out the significant the regulons (TFs) and the target genes of each regulon across cell types for different disease states |
| TF | Cell Type | Tissue | Disease Stage | Target Gene | RSS | Regulon Activity |
| ∗The dot plots of a searched regulon are shown for all cell subpopulations in each disease state of each tissue based on the regulon specific score inferred using pySCENIC and by calculating the average expression. |
| Page: 1 |
Top |
Somatic mutation of malignant transformation related genes |
| Annotation of somatic variants for genes involved in malignant transformation |
| Hugo Symbol | Variant Class | Variant Classification | dbSNP RS | HGVSc | HGVSp | HGVSp Short | SWISSPROT | BIOTYPE | SIFT | PolyPhen | Tumor Sample Barcode | Tissue | Histology | Sex | Age | Stage | Therapy Types | Drugs | Outcome |
| MKNK2 | SNV | Missense_Mutation | c.319N>T | p.Ser107Cys | p.S107C | Q9HBH9 | protein_coding | deleterious(0.02) | benign(0.003) | TCGA-A8-A09Z-01 | Breast | breast invasive carcinoma | Female | >=65 | I/II | Unknown | Unknown | SD | |
| MKNK2 | SNV | Missense_Mutation | c.67G>A | p.Glu23Lys | p.E23K | Q9HBH9 | protein_coding | deleterious_low_confidence(0.04) | benign(0.003) | TCGA-D8-A1Y1-01 | Breast | breast invasive carcinoma | Female | >=65 | III/IV | Hormone Therapy | tamoxiphen | PD | |
| MKNK2 | insertion | Frame_Shift_Ins | novel | c.586_587insCACAAGATACCACCCCATACCCACTAGGG | p.Leu196ProfsTer21 | p.L196Pfs*21 | Q9HBH9 | protein_coding | TCGA-A2-A0D1-01 | Breast | breast invasive carcinoma | Female | >=65 | I/II | Chemotherapy | taxotere | SD | ||
| MKNK2 | SNV | Missense_Mutation | novel | c.180N>C | p.Lys60Asn | p.K60N | Q9HBH9 | protein_coding | tolerated(0.06) | benign(0.006) | TCGA-DG-A2KM-01 | Cervix | cervical & endocervical cancer | Female | <65 | I/II | Chemotherapy | cisplatin | SD |
| MKNK2 | deletion | Frame_Shift_Del | novel | c.1293_1296delNNNN | p.Arg432AlafsTer51 | p.R432Afs*51 | Q9HBH9 | protein_coding | TCGA-FU-A3HZ-01 | Cervix | cervical & endocervical cancer | Female | <65 | I/II | Chemotherapy | cisplatin | CR | ||
| MKNK2 | SNV | Missense_Mutation | c.1143N>A | p.Met381Ile | p.M381I | Q9HBH9 | protein_coding | tolerated(0.22) | benign(0) | TCGA-A6-6138-01 | Colorectum | colon adenocarcinoma | Male | <65 | I/II | Unknown | Unknown | SD | |
| MKNK2 | SNV | Missense_Mutation | c.419N>T | p.Arg140Met | p.R140M | Q9HBH9 | protein_coding | deleterious(0.04) | probably_damaging(0.95) | TCGA-AA-A01R-01 | Colorectum | colon adenocarcinoma | Male | <65 | III/IV | Chemotherapy | 5-fluorouracil | PD | |
| MKNK2 | SNV | Missense_Mutation | novel | c.764N>G | p.Glu255Gly | p.E255G | Q9HBH9 | protein_coding | deleterious(0) | probably_damaging(0.999) | TCGA-WS-AB45-01 | Colorectum | colon adenocarcinoma | Female | <65 | I/II | Unknown | Unknown | SD |
| MKNK2 | SNV | Missense_Mutation | rs375811870 | c.175G>A | p.Ala59Thr | p.A59T | Q9HBH9 | protein_coding | tolerated(0.08) | benign(0.01) | TCGA-AJ-A3BH-01 | Endometrium | uterine corpus endometrioid carcinoma | Female | Unknown | I/II | Unknown | Unknown | SD |
| MKNK2 | SNV | Missense_Mutation | c.1052N>A | p.Arg351His | p.R351H | Q9HBH9 | protein_coding | deleterious(0) | probably_damaging(0.988) | TCGA-AP-A059-01 | Endometrium | uterine corpus endometrioid carcinoma | Female | >=65 | I/II | Unknown | Unknown | SD |
| Page: 1 2 3 4 |
Top |
Related drugs of malignant transformation related genes |
| Identification of chemicals and drugs interact with genes involved in malignant transfromation |
| (DGIdb 4.0) |
| Entrez ID | Symbol | Category | Interaction Types | Drug Claim Name | Drug Name | PMIDs |
| 2872 | MKNK2 | KINASE, DRUGGABLE GENOME, ENZYME, SERINE THREONINE KINASE | SORAFENIB | SORAFENIB | ||
| 2872 | MKNK2 | KINASE, DRUGGABLE GENOME, ENZYME, SERINE THREONINE KINASE | GEFITINIB | GEFITINIB | ||
| 2872 | MKNK2 | KINASE, DRUGGABLE GENOME, ENZYME, SERINE THREONINE KINASE | inhibitor | 328083468 | ||
| 2872 | MKNK2 | KINASE, DRUGGABLE GENOME, ENZYME, SERINE THREONINE KINASE | ERLOTINIB | ERLOTINIB | ||
| 2872 | MKNK2 | KINASE, DRUGGABLE GENOME, ENZYME, SERINE THREONINE KINASE | SNS-314 | SNS-314 | ||
| 2872 | MKNK2 | KINASE, DRUGGABLE GENOME, ENZYME, SERINE THREONINE KINASE | LINIFANIB | LINIFANIB | ||
| 2872 | MKNK2 | KINASE, DRUGGABLE GENOME, ENZYME, SERINE THREONINE KINASE | TAMATINIB | R-406 | ||
| 2872 | MKNK2 | KINASE, DRUGGABLE GENOME, ENZYME, SERINE THREONINE KINASE | CENISERTIB | CENISERTIB | ||
| 2872 | MKNK2 | KINASE, DRUGGABLE GENOME, ENZYME, SERINE THREONINE KINASE | ILORASERTIB | ILORASERTIB | ||
| 2872 | MKNK2 | KINASE, DRUGGABLE GENOME, ENZYME, SERINE THREONINE KINASE | CYC-116 | CYC-116 |
| Page: 1 2 |

Copyright 2023-Present -The University of Texas Health Science Center at Houston |