
|
|||||
|
 | |
| |
| |
| |
| |
| |
|
Gene: MESP1 |
Gene summary for MESP1 |
| Gene information | Species | Human | Gene symbol | MESP1 | Gene ID | 55897 |
| Gene name | mesoderm posterior bHLH transcription factor 1 | |
| Gene Alias | bHLHc5 | |
| Cytomap | 15q26.1 | |
| Gene Type | protein-coding | GO ID | GO:0000578 | UniProtAcc | Q9BRJ9 |
Top |
Malignant transformation analysis |
| Identification of the aberrant gene expression in precancerous and cancerous lesions by comparing the gene expression of stem-like cells in diseased tissues with normal stem cells |
| Entrez ID | Symbol | Replicates | Species | Organ | Tissue | Adj P-value | Log2FC | Malignancy |
| 55897 | MESP1 | GSM4909294 | Human | Breast | IDC | 1.76e-04 | 3.66e-01 | 0.2022 |
| 55897 | MESP1 | GSM4909295 | Human | Breast | IDC | 9.10e-04 | 3.48e-01 | 0.0898 |
| 55897 | MESP1 | GSM4909301 | Human | Breast | IDC | 1.16e-14 | 6.02e-01 | 0.1577 |
| 55897 | MESP1 | GSM4909304 | Human | Breast | IDC | 1.16e-02 | -1.28e-01 | 0.1636 |
| 55897 | MESP1 | GSM4909305 | Human | Breast | IDC | 8.53e-03 | 2.56e-01 | 0.0436 |
| 55897 | MESP1 | GSM4909306 | Human | Breast | IDC | 5.94e-29 | 7.97e-01 | 0.1564 |
| 55897 | MESP1 | GSM4909308 | Human | Breast | IDC | 3.00e-04 | -1.71e-01 | 0.158 |
| 55897 | MESP1 | GSM4909309 | Human | Breast | IDC | 1.24e-02 | 2.39e-01 | 0.0483 |
| 55897 | MESP1 | GSM4909311 | Human | Breast | IDC | 1.78e-05 | -1.61e-01 | 0.1534 |
| 55897 | MESP1 | GSM4909312 | Human | Breast | IDC | 7.25e-03 | -1.38e-01 | 0.1552 |
| 55897 | MESP1 | GSM4909315 | Human | Breast | IDC | 6.28e-05 | -1.60e-01 | 0.21 |
| 55897 | MESP1 | GSM4909319 | Human | Breast | IDC | 6.53e-07 | -1.28e-01 | 0.1563 |
| 55897 | MESP1 | GSM4909320 | Human | Breast | IDC | 1.82e-03 | 1.60e-01 | 0.1575 |
| 55897 | MESP1 | GSM4909321 | Human | Breast | IDC | 1.61e-11 | 4.40e-01 | 0.1559 |
| 55897 | MESP1 | M2 | Human | Breast | IDC | 9.20e-03 | 2.69e-01 | 0.21 |
| 55897 | MESP1 | NCCBC14 | Human | Breast | DCIS | 3.33e-02 | -1.08e-01 | 0.2021 |
| 55897 | MESP1 | NCCBC6 | Human | Breast | DCIS | 1.42e-03 | 3.43e-01 | 0.2095 |
| 55897 | MESP1 | DCIS2 | Human | Breast | DCIS | 1.35e-35 | 2.17e-01 | 0.0085 |
| 55897 | MESP1 | LZE5T | Human | Esophagus | ESCC | 1.60e-07 | 7.54e-01 | 0.0514 |
| 55897 | MESP1 | P2T-E | Human | Esophagus | ESCC | 6.35e-16 | 2.56e-01 | 0.1177 |
| Page: 1 2 3 |
| Tissue | Expression Dynamics | Abbreviation |
| Breast | 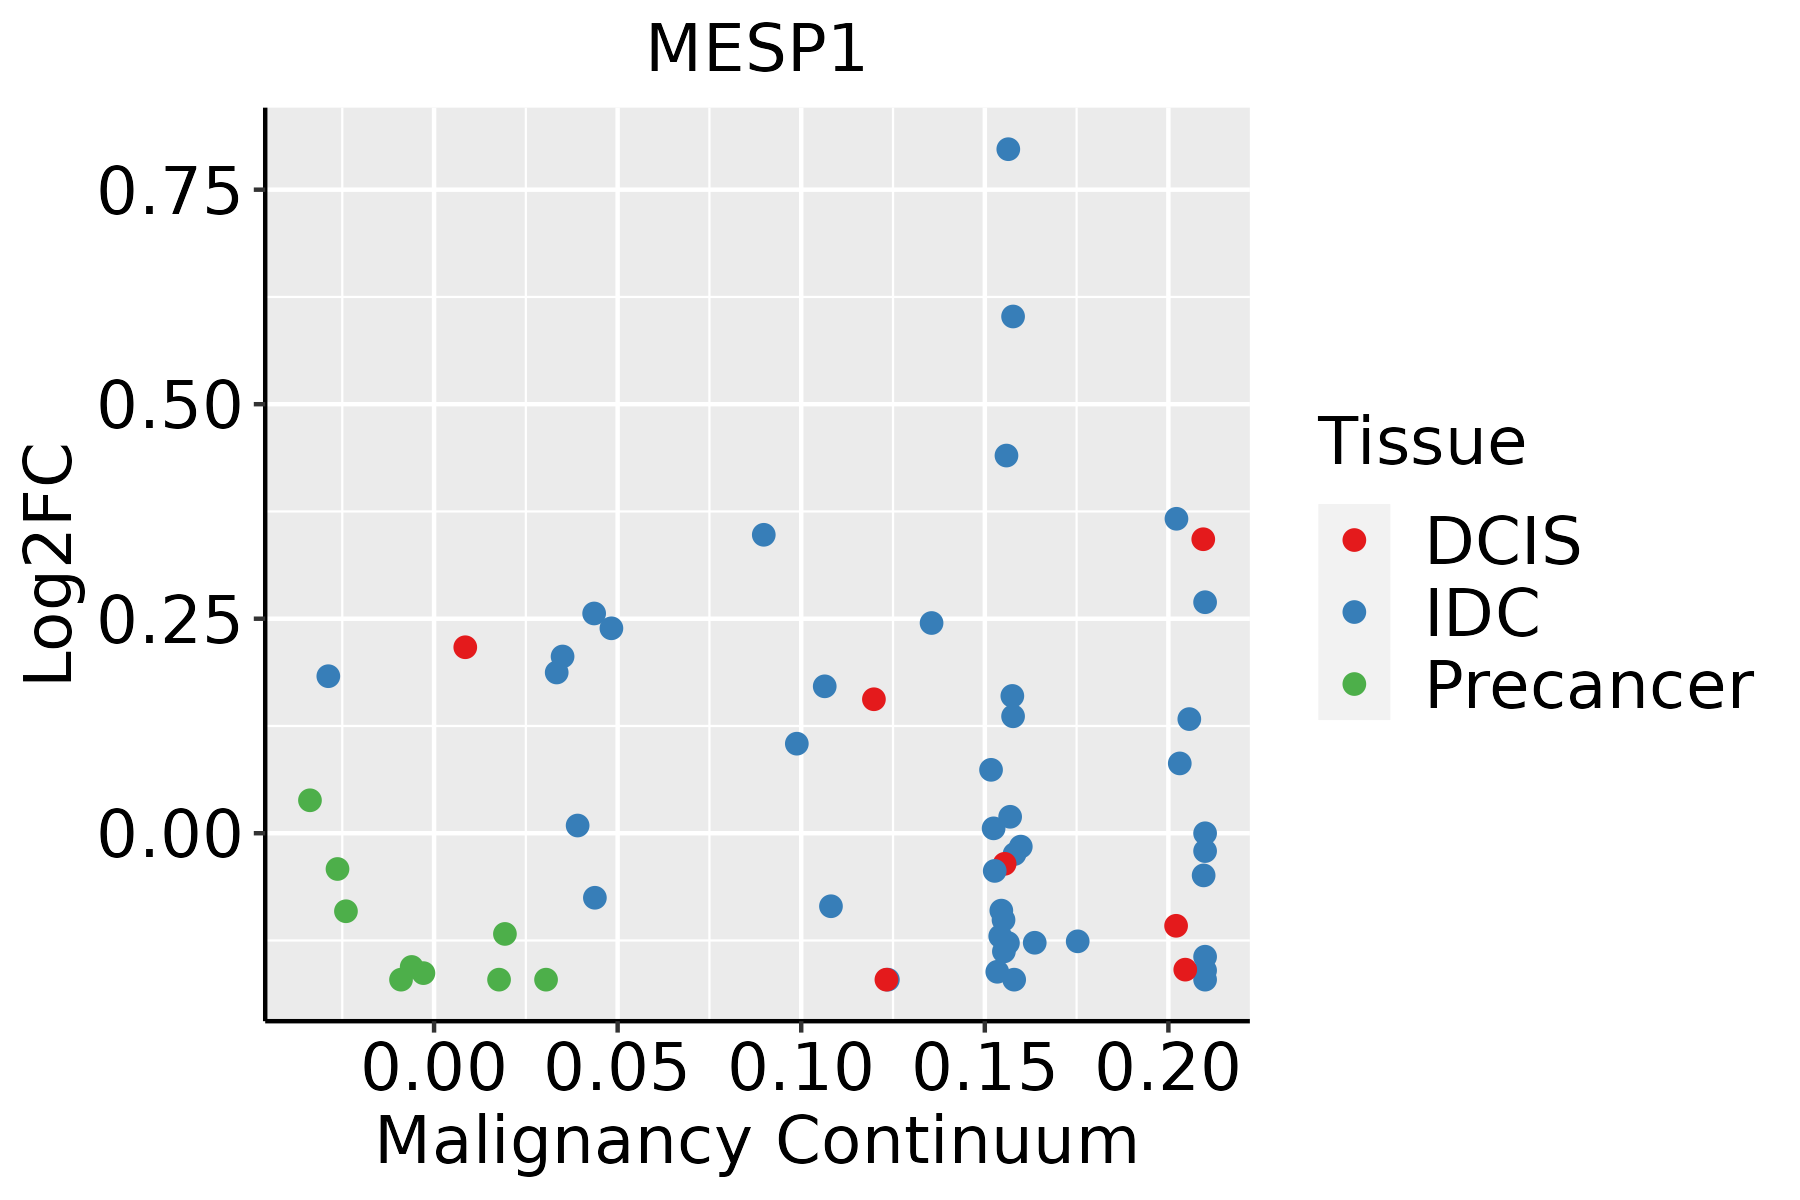 | IDC: Invasive ductal carcinoma |
| DCIS: Ductal carcinoma in situ | ||
| Precancer(BRCA1-mut): Precancerous lesion from BRCA1 mutation carriers | ||
| Esophagus |  | ESCC: Esophageal squamous cell carcinoma |
| HGIN: High-grade intraepithelial neoplasias | ||
| LGIN: Low-grade intraepithelial neoplasias | ||
| Liver | 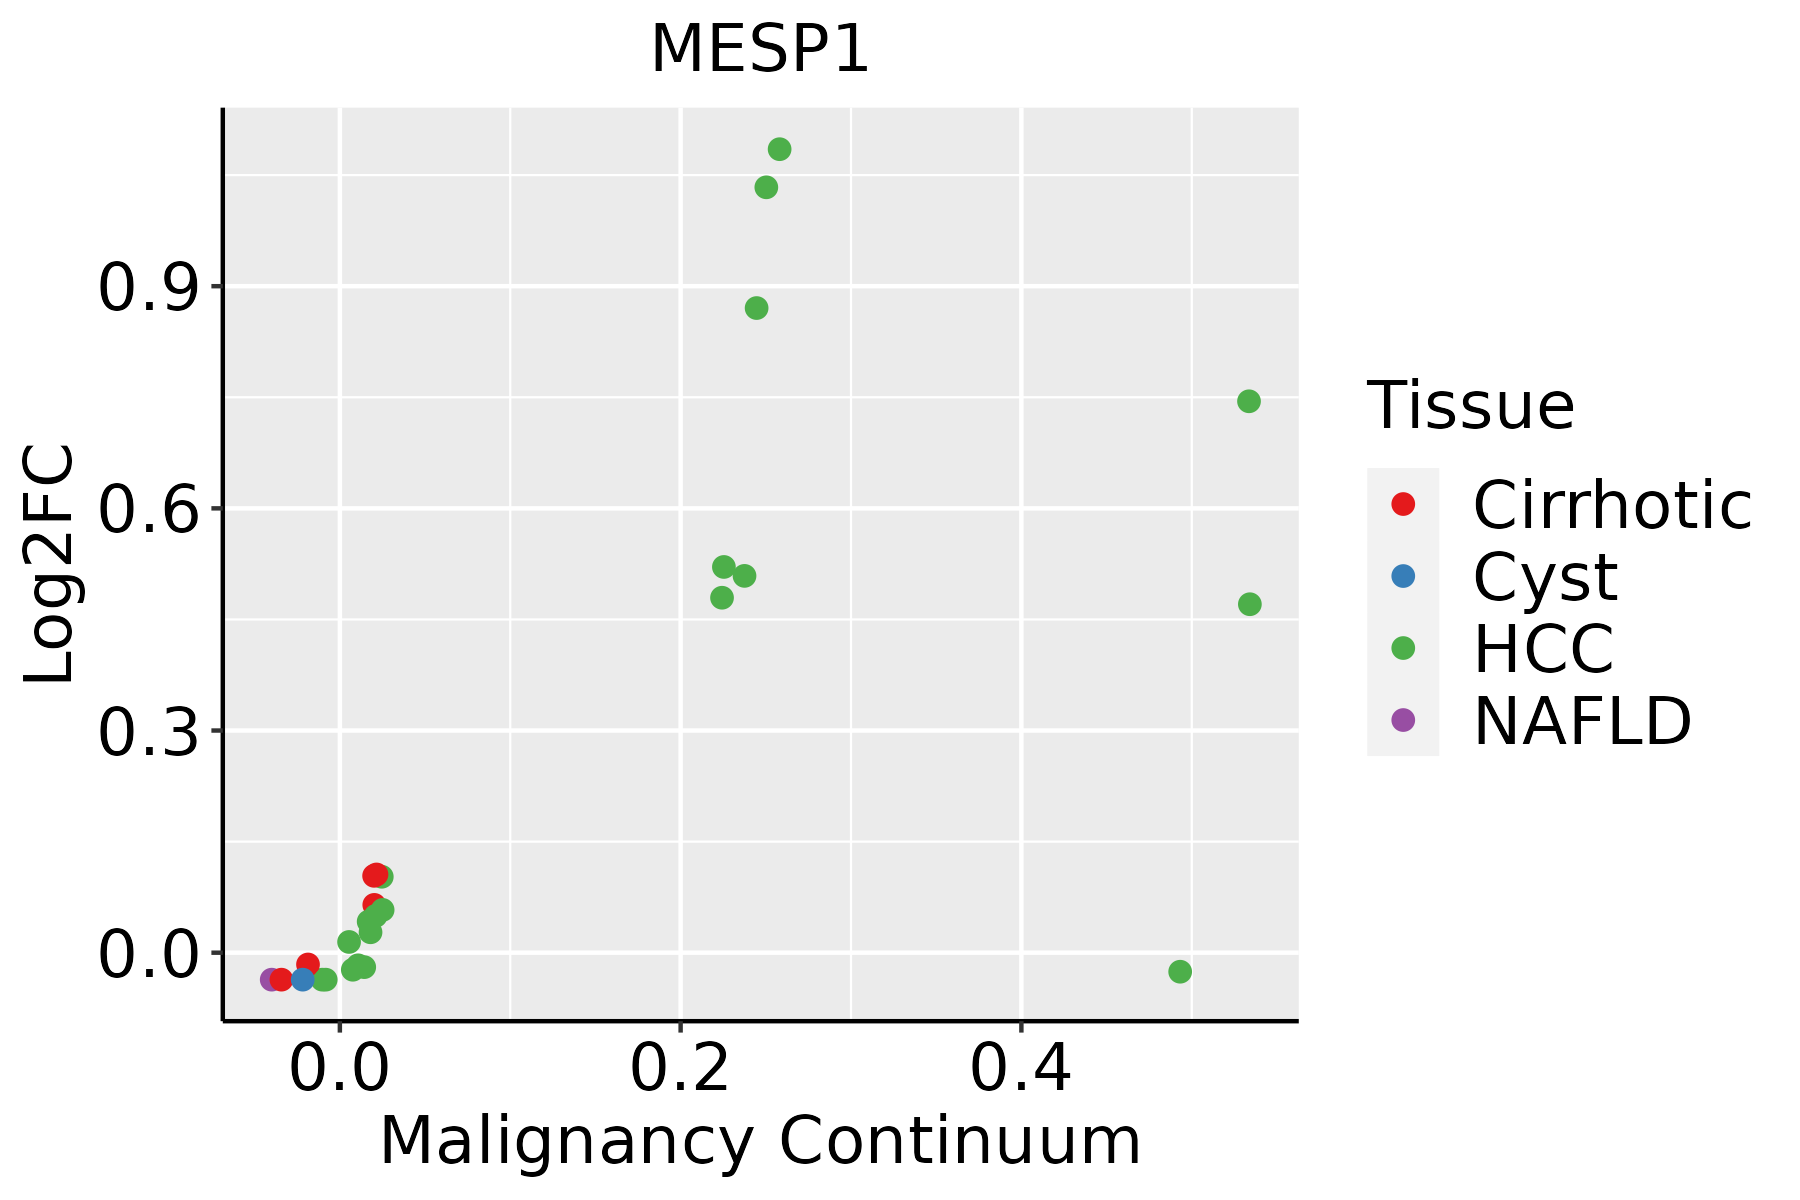 | HCC: Hepatocellular carcinoma |
| NAFLD: Non-alcoholic fatty liver disease | ||
| Prostate | 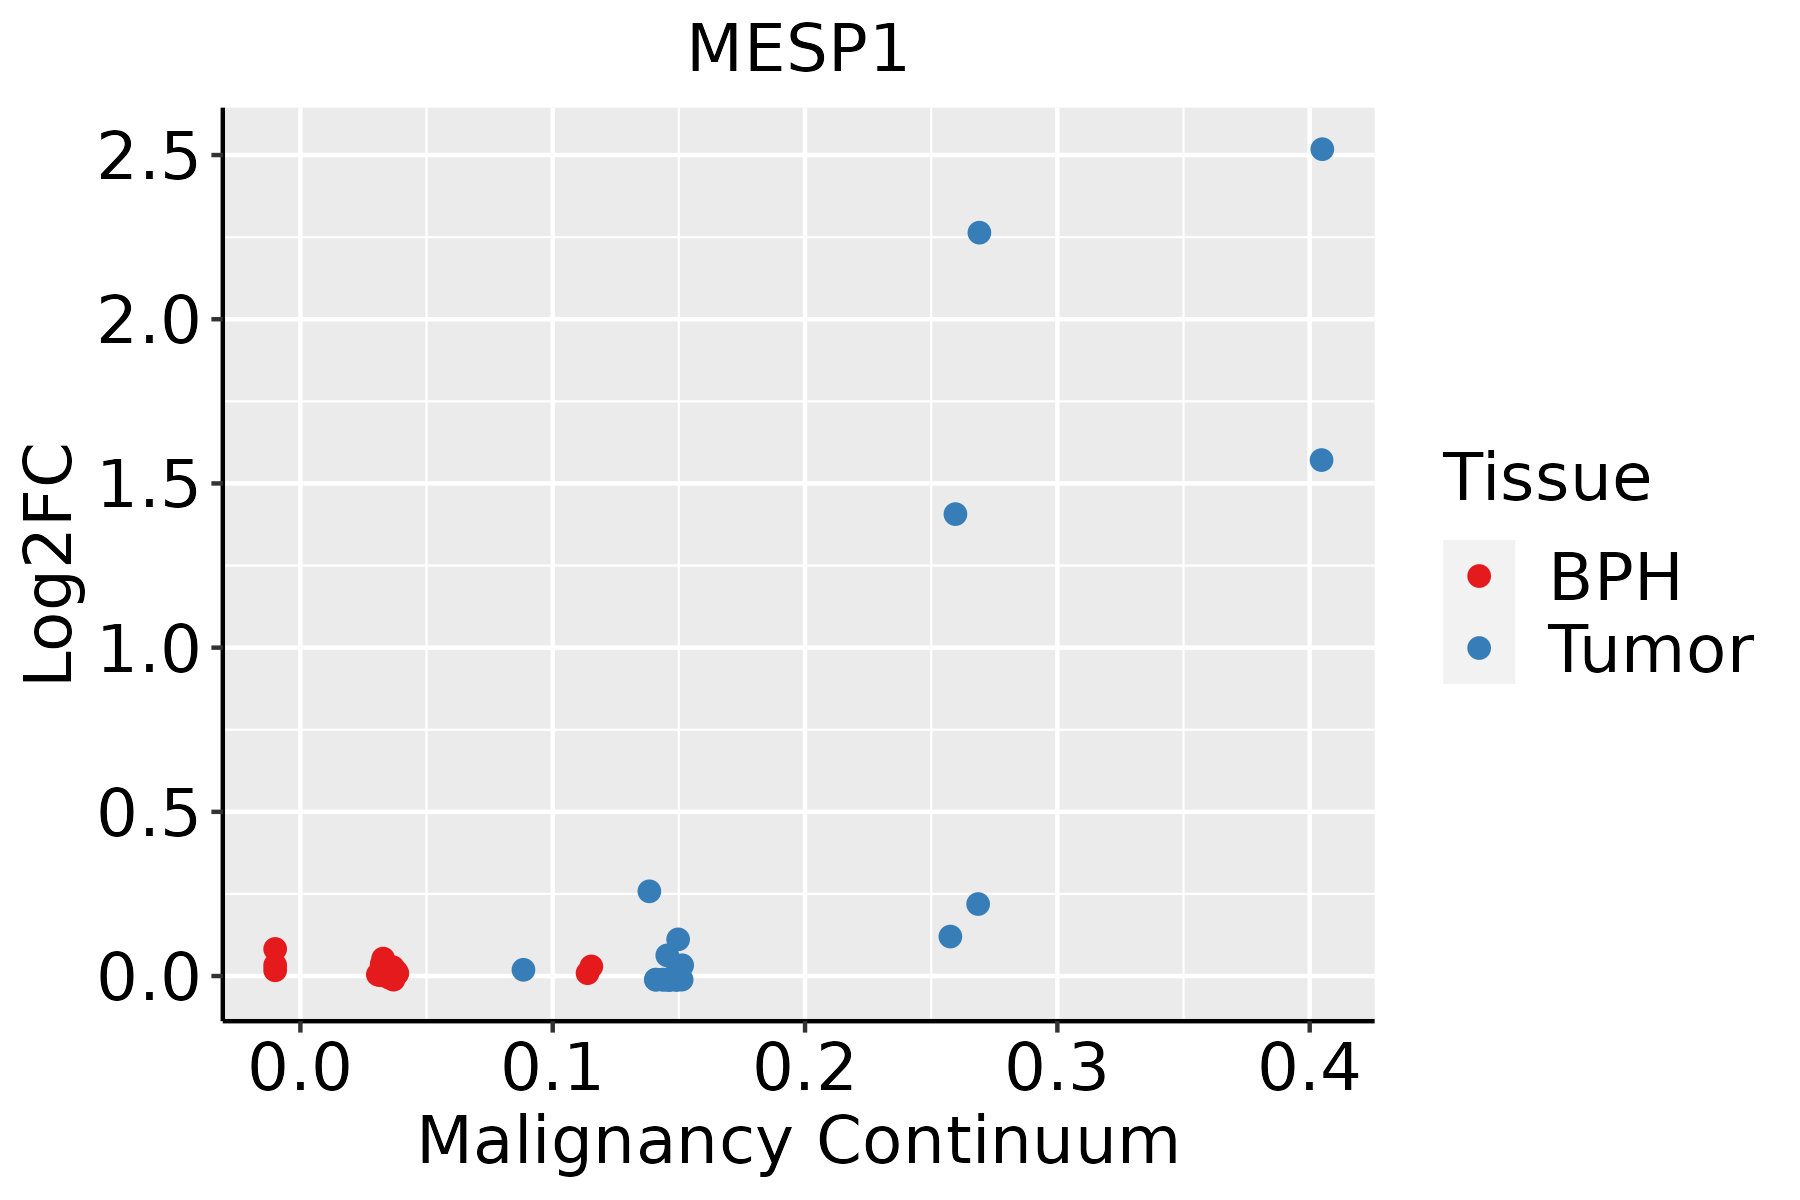 | BPH: Benign Prostatic Hyperplasia |
| ∗log2FC in expression of this searched gene in stem-like cells from each diseased tissue sample relative to stem-like cells in normal samples in each tissue plotted against the malignancy continuum. Samples are colored based on if they are from different disease stage. |
Top |
Malignant transformation related pathway analysis |
| Find out the enriched GO biological processes and KEGG pathways involved in transition from healthy to precancer to cancer |
| Tissue | Disease Stage | Enriched GO biological Processes |
| Colorectum | AD |  |
| Colorectum | SER |  |
| Colorectum | MSS |  |
| Colorectum | MSI-H |  |
| Colorectum | FAP |  |
| ∗Top 15 enriched GO BP terms are showed in the bar plot of each disease state in each tissue. Each row represents a significant GO biological process which is colored according to the -log10(p.adjust). |
| Page: 1 2 3 4 5 6 7 8 9 |
| GO ID | Tissue | Disease Stage | Description | Gene Ratio | Bg Ratio | pvalue | p.adjust | Count |
| GO:006053716 | Esophagus | ESCC | muscle tissue development | 211/8552 | 403/18723 | 3.84e-03 | 1.56e-02 | 211 |
| GO:00900905 | Esophagus | ESCC | negative regulation of canonical Wnt signaling pathway | 78/8552 | 137/18723 | 5.17e-03 | 1.95e-02 | 78 |
| GO:20000274 | Esophagus | ESCC | regulation of animal organ morphogenesis | 71/8552 | 125/18723 | 7.97e-03 | 2.84e-02 | 71 |
| GO:004544610 | Esophagus | ESCC | endothelial cell differentiation | 67/8552 | 118/18723 | 9.86e-03 | 3.40e-02 | 67 |
| GO:000315818 | Esophagus | ESCC | endothelium development | 76/8552 | 136/18723 | 1.05e-02 | 3.59e-02 | 76 |
| GO:00350512 | Esophagus | ESCC | cardiocyte differentiation | 86/8552 | 156/18723 | 1.09e-02 | 3.68e-02 | 86 |
| GO:001470615 | Esophagus | ESCC | striated muscle tissue development | 197/8552 | 384/18723 | 1.46e-02 | 4.74e-02 | 197 |
| GO:000188912 | Liver | Cirrhotic | liver development | 81/4634 | 147/18723 | 2.99e-15 | 3.35e-13 | 81 |
| GO:006100812 | Liver | Cirrhotic | hepaticobiliary system development | 82/4634 | 150/18723 | 3.72e-15 | 4.09e-13 | 82 |
| GO:004873212 | Liver | Cirrhotic | gland development | 154/4634 | 436/18723 | 4.03e-07 | 9.42e-06 | 154 |
| GO:001605511 | Liver | Cirrhotic | Wnt signaling pathway | 150/4634 | 444/18723 | 9.75e-06 | 1.42e-04 | 150 |
| GO:019873811 | Liver | Cirrhotic | cell-cell signaling by wnt | 150/4634 | 446/18723 | 1.28e-05 | 1.80e-04 | 150 |
| GO:003011111 | Liver | Cirrhotic | regulation of Wnt signaling pathway | 112/4634 | 328/18723 | 7.57e-05 | 8.40e-04 | 112 |
| GO:006082811 | Liver | Cirrhotic | regulation of canonical Wnt signaling pathway | 86/4634 | 253/18723 | 5.70e-04 | 4.46e-03 | 86 |
| GO:00031586 | Liver | Cirrhotic | endothelium development | 49/4634 | 136/18723 | 2.14e-03 | 1.32e-02 | 49 |
| GO:000166712 | Liver | Cirrhotic | ameboidal-type cell migration | 145/4634 | 475/18723 | 2.23e-03 | 1.36e-02 | 145 |
| GO:006007011 | Liver | Cirrhotic | canonical Wnt signaling pathway | 97/4634 | 303/18723 | 2.42e-03 | 1.46e-02 | 97 |
| GO:00454465 | Liver | Cirrhotic | endothelial cell differentiation | 43/4634 | 118/18723 | 3.03e-03 | 1.72e-02 | 43 |
| GO:00703652 | Liver | Cirrhotic | hepatocyte differentiation | 9/4634 | 16/18723 | 6.94e-03 | 3.38e-02 | 9 |
| GO:0007492 | Liver | Cirrhotic | endoderm development | 29/4634 | 77/18723 | 8.02e-03 | 3.76e-02 | 29 |
| Page: 1 2 3 4 5 6 |
| Pathway ID | Tissue | Disease Stage | Description | Gene Ratio | Bg Ratio | pvalue | p.adjust | qvalue | Count |
| Page: 1 |
Top |
Cell-cell communication analysis |
| Identification of potential cell-cell interactions between two cell types and their ligand-receptor pairs for different disease states |
| Ligand | Receptor | LRpair | Pathway | Tissue | Disease Stage |
| Page: 1 |
Top |
Single-cell gene regulatory network inference analysis |
| Find out the significant the regulons (TFs) and the target genes of each regulon across cell types for different disease states |
| TF | Cell Type | Tissue | Disease Stage | Target Gene | RSS | Regulon Activity |
| MESP1 | NK | Breast | ADJ | GGCT,SVBP,RHOU, etc. | 4.43e-02 |  |
| MESP1 | NK | Breast | DCIS | GGCT,SVBP,RHOU, etc. | 1.21e-01 |  |
| MESP1 | PLA | Breast | DCIS | GGCT,SVBP,RHOU, etc. | 1.51e-01 | |
| MESP1 | BMEM | Breast | DCIS | GGCT,SVBP,RHOU, etc. | 1.29e-01 | |
| MESP1 | NK | Breast | Healthy | GGCT,SVBP,RHOU, etc. | 1.31e-01 |  |
| MESP1 | NK | Breast | IDC | GGCT,SVBP,RHOU, etc. | 1.04e-01 |  |
| MESP1 | BMEM | Breast | IDC | GGCT,SVBP,RHOU, etc. | 9.23e-02 | |
| MESP1 | COL | Cervix | Healthy | VSIG2,BPIFB1,HOXB2, etc. | 3.24e-01 |  |
| MESP1 | AT1 | Lung | IAC | GGTLC1,ANPEP,B3GNT7, etc. | 8.55e-02 |  |
| MESP1 | LUM | Prostate | Healthy | ZNF217,PART1,CPE, etc. | 2.84e-01 |  |
| ∗The dot plots of a searched regulon are shown for all cell subpopulations in each disease state of each tissue based on the regulon specific score inferred using pySCENIC and by calculating the average expression. |
| Page: 1 |
Top |
Somatic mutation of malignant transformation related genes |
| Annotation of somatic variants for genes involved in malignant transformation |
| Hugo Symbol | Variant Class | Variant Classification | dbSNP RS | HGVSc | HGVSp | HGVSp Short | SWISSPROT | BIOTYPE | SIFT | PolyPhen | Tumor Sample Barcode | Tissue | Histology | Sex | Age | Stage | Therapy Types | Drugs | Outcome |
| MESP1 | insertion | Nonsense_Mutation | novel | c.727_728insATTATTGAGTATTTATTGT | p.Leu243HisfsTer3 | p.L243Hfs*3 | Q9BRJ9 | protein_coding | TCGA-BH-A0DP-01 | Breast | breast invasive carcinoma | Female | <65 | I/II | Hormone Therapy | arimidex | SD | ||
| MESP1 | SNV | Missense_Mutation | c.391C>T | p.Arg131Cys | p.R131C | Q9BRJ9 | protein_coding | deleterious(0) | probably_damaging(0.995) | TCGA-44-8117-01 | Lung | lung adenocarcinoma | Female | <65 | I/II | Chemotherapy | cisplatin | CR | |
| MESP1 | SNV | Missense_Mutation | novel | c.461N>T | p.Arg154Leu | p.R154L | Q9BRJ9 | protein_coding | tolerated(0.34) | benign(0) | TCGA-58-8391-01 | Lung | lung squamous cell carcinoma | Female | <65 | III/IV | Chemotherapy | carboplatin | PD |
| MESP1 | SNV | Missense_Mutation | novel | c.74N>T | p.Pro25Leu | p.P25L | Q9BRJ9 | protein_coding | tolerated_low_confidence(0.19) | benign(0.003) | TCGA-58-8391-01 | Lung | lung squamous cell carcinoma | Female | <65 | III/IV | Chemotherapy | carboplatin | PD |
| MESP1 | SNV | Missense_Mutation | novel | c.754N>A | p.Glu252Lys | p.E252K | Q9BRJ9 | protein_coding | deleterious_low_confidence(0) | possibly_damaging(0.826) | TCGA-ET-A25R-01 | Thyroid | thyroid carcinoma | Female | <65 | III/IV | Unknown | Unknown | SD |
| Page: 1 |
Top |
Related drugs of malignant transformation related genes |
| Identification of chemicals and drugs interact with genes involved in malignant transfromation |
| (DGIdb 4.0) |
| Entrez ID | Symbol | Category | Interaction Types | Drug Claim Name | Drug Name | PMIDs |
| Page: 1 |

Copyright 2023-Present -The University of Texas Health Science Center at Houston |