
|
|||||
|
 | |
| |
| |
| |
| |
| |
|
Gene: MCTP1 |
Gene summary for MCTP1 |
| Gene information | Species | Human | Gene symbol | MCTP1 | Gene ID | 79772 |
| Gene name | multiple C2 and transmembrane domain containing 1 | |
| Gene Alias | MCTP1 | |
| Cytomap | 5q15 | |
| Gene Type | protein-coding | GO ID | GO:0001505 | UniProtAcc | Q6DN14 |
Top |
Malignant transformation analysis |
| Identification of the aberrant gene expression in precancerous and cancerous lesions by comparing the gene expression of stem-like cells in diseased tissues with normal stem cells |
| Entrez ID | Symbol | Replicates | Species | Organ | Tissue | Adj P-value | Log2FC | Malignancy |
| 79772 | MCTP1 | HTA11_78_2000001011 | Human | Colorectum | AD | 2.13e-05 | 2.20e-01 | -0.1088 |
| 79772 | MCTP1 | HTA11_347_2000001011 | Human | Colorectum | AD | 1.59e-09 | 1.99e-01 | -0.1954 |
| 79772 | MCTP1 | HTA11_696_2000001011 | Human | Colorectum | AD | 1.26e-02 | 1.14e-01 | -0.1464 |
| 79772 | MCTP1 | HTA11_7663_2000001011 | Human | Colorectum | SER | 7.20e-30 | 4.01e+00 | 0.0131 |
| 79772 | MCTP1 | HTA11_6818_2000001011 | Human | Colorectum | AD | 1.22e-05 | 2.90e-01 | 0.0112 |
| 79772 | MCTP1 | HTA11_6818_2000001021 | Human | Colorectum | AD | 4.17e-05 | 2.17e-01 | 0.0588 |
| 79772 | MCTP1 | HTA11_99999970781_79442 | Human | Colorectum | MSS | 3.61e-11 | 3.91e-01 | 0.294 |
| 79772 | MCTP1 | CRC-1-8810 | Human | Colorectum | CRC | 1.92e-10 | 4.97e-01 | 0.6257 |
| 79772 | MCTP1 | LZE2T | Human | Esophagus | ESCC | 4.35e-02 | 3.44e-01 | 0.082 |
| 79772 | MCTP1 | LZE5T | Human | Esophagus | ESCC | 7.82e-04 | 2.62e-01 | 0.0514 |
| 79772 | MCTP1 | LZE8T | Human | Esophagus | ESCC | 3.86e-06 | 2.57e-01 | 0.067 |
| 79772 | MCTP1 | LZE6T | Human | Esophagus | ESCC | 6.85e-04 | 2.78e-01 | 0.0845 |
| 79772 | MCTP1 | P5T-E | Human | Esophagus | ESCC | 1.87e-05 | 2.00e-01 | 0.1327 |
| 79772 | MCTP1 | P8T-E | Human | Esophagus | ESCC | 6.24e-05 | 1.76e-01 | 0.0889 |
| 79772 | MCTP1 | P12T-E | Human | Esophagus | ESCC | 2.36e-02 | 1.44e-01 | 0.1122 |
| 79772 | MCTP1 | P15T-E | Human | Esophagus | ESCC | 2.53e-05 | 1.74e-01 | 0.1149 |
| 79772 | MCTP1 | P16T-E | Human | Esophagus | ESCC | 5.60e-03 | 9.80e-02 | 0.1153 |
| 79772 | MCTP1 | P20T-E | Human | Esophagus | ESCC | 4.20e-08 | 2.20e-01 | 0.1124 |
| 79772 | MCTP1 | P22T-E | Human | Esophagus | ESCC | 3.86e-11 | 2.84e-01 | 0.1236 |
| 79772 | MCTP1 | P31T-E | Human | Esophagus | ESCC | 5.16e-05 | 1.09e-01 | 0.1251 |
| Page: 1 2 3 4 |
| Tissue | Expression Dynamics | Abbreviation |
| Colorectum (GSE201348) |  | FAP: Familial adenomatous polyposis |
| CRC: Colorectal cancer | ||
| Colorectum (HTA11) |  | AD: Adenomas |
| SER: Sessile serrated lesions | ||
| MSI-H: Microsatellite-high colorectal cancer | ||
| MSS: Microsatellite stable colorectal cancer | ||
| Esophagus |  | ESCC: Esophageal squamous cell carcinoma |
| HGIN: High-grade intraepithelial neoplasias | ||
| LGIN: Low-grade intraepithelial neoplasias | ||
| Liver | 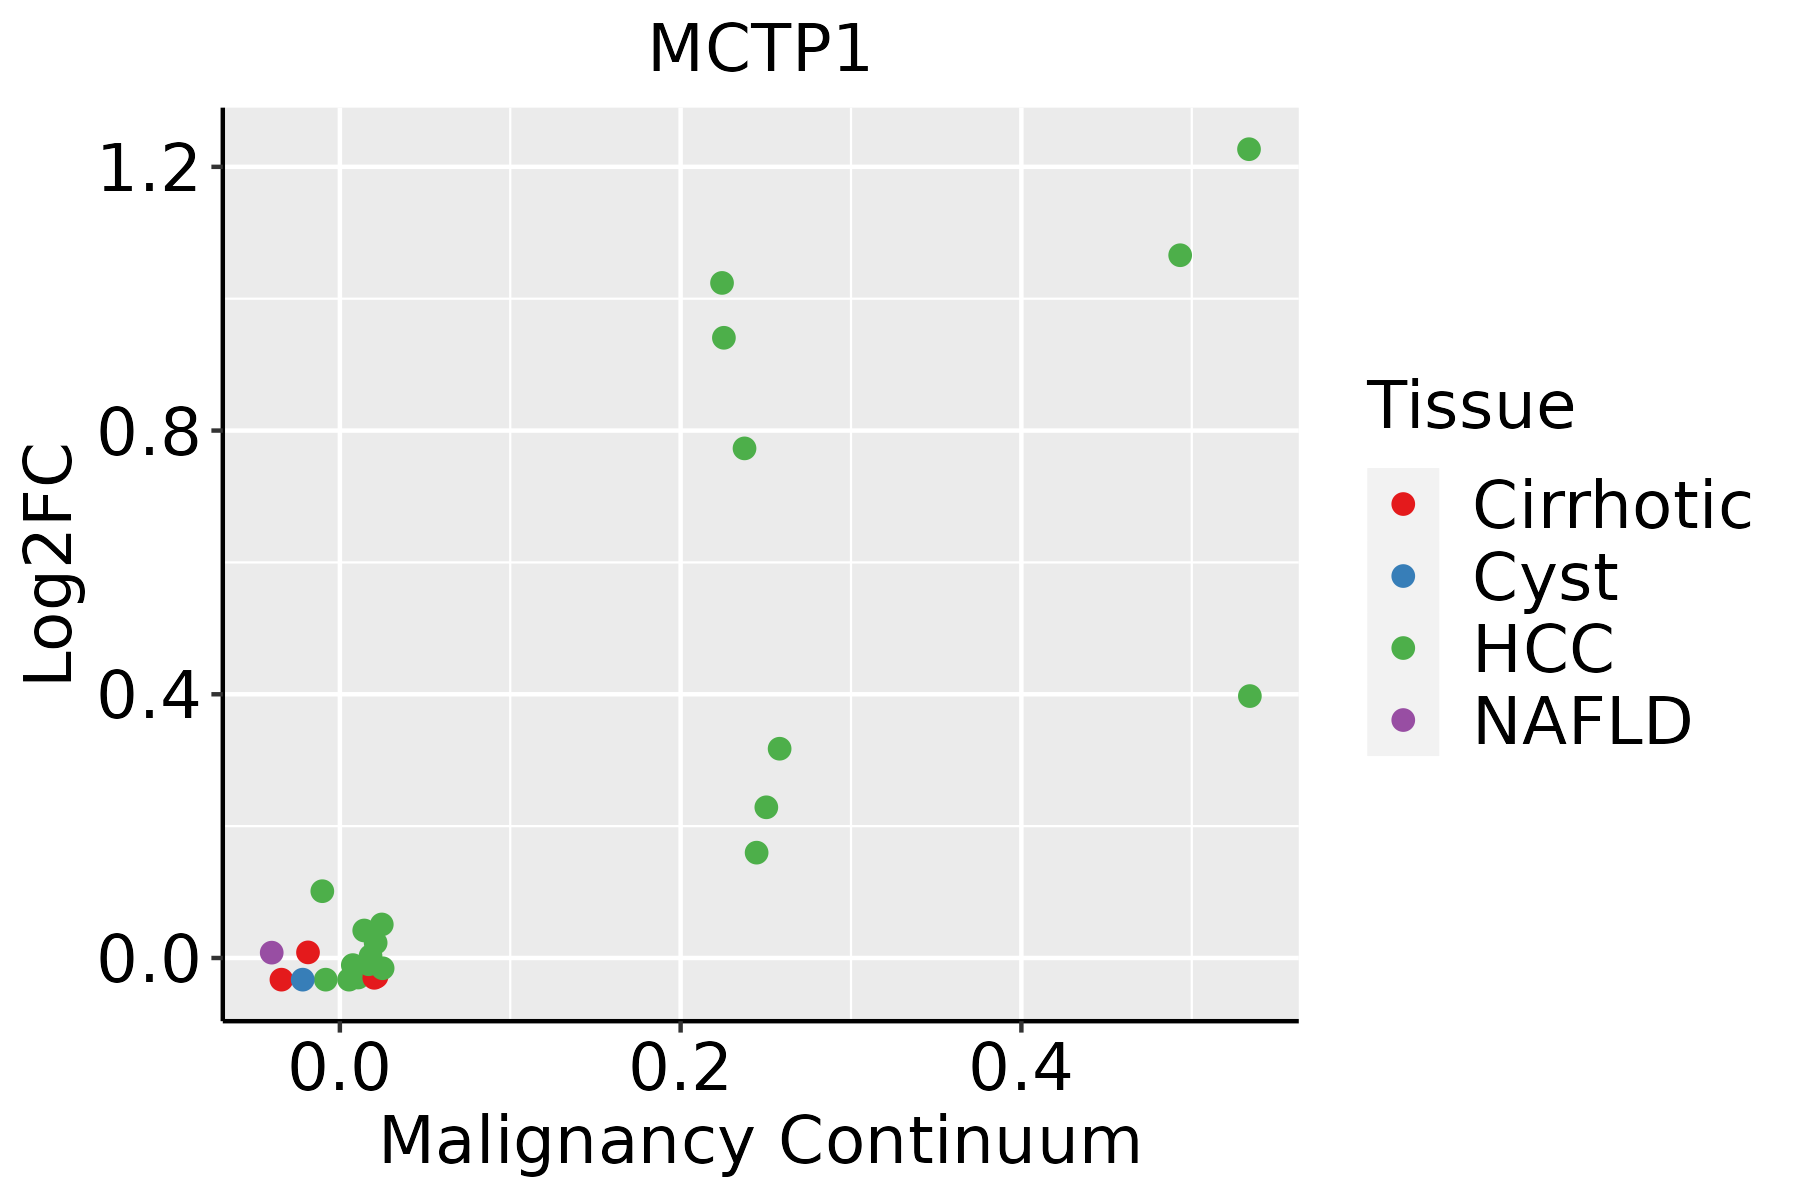 | HCC: Hepatocellular carcinoma |
| NAFLD: Non-alcoholic fatty liver disease | ||
| Lung |  | AAH: Atypical adenomatous hyperplasia |
| AIS: Adenocarcinoma in situ | ||
| IAC: Invasive lung adenocarcinoma | ||
| MIA: Minimally invasive adenocarcinoma | ||
| Oral Cavity | 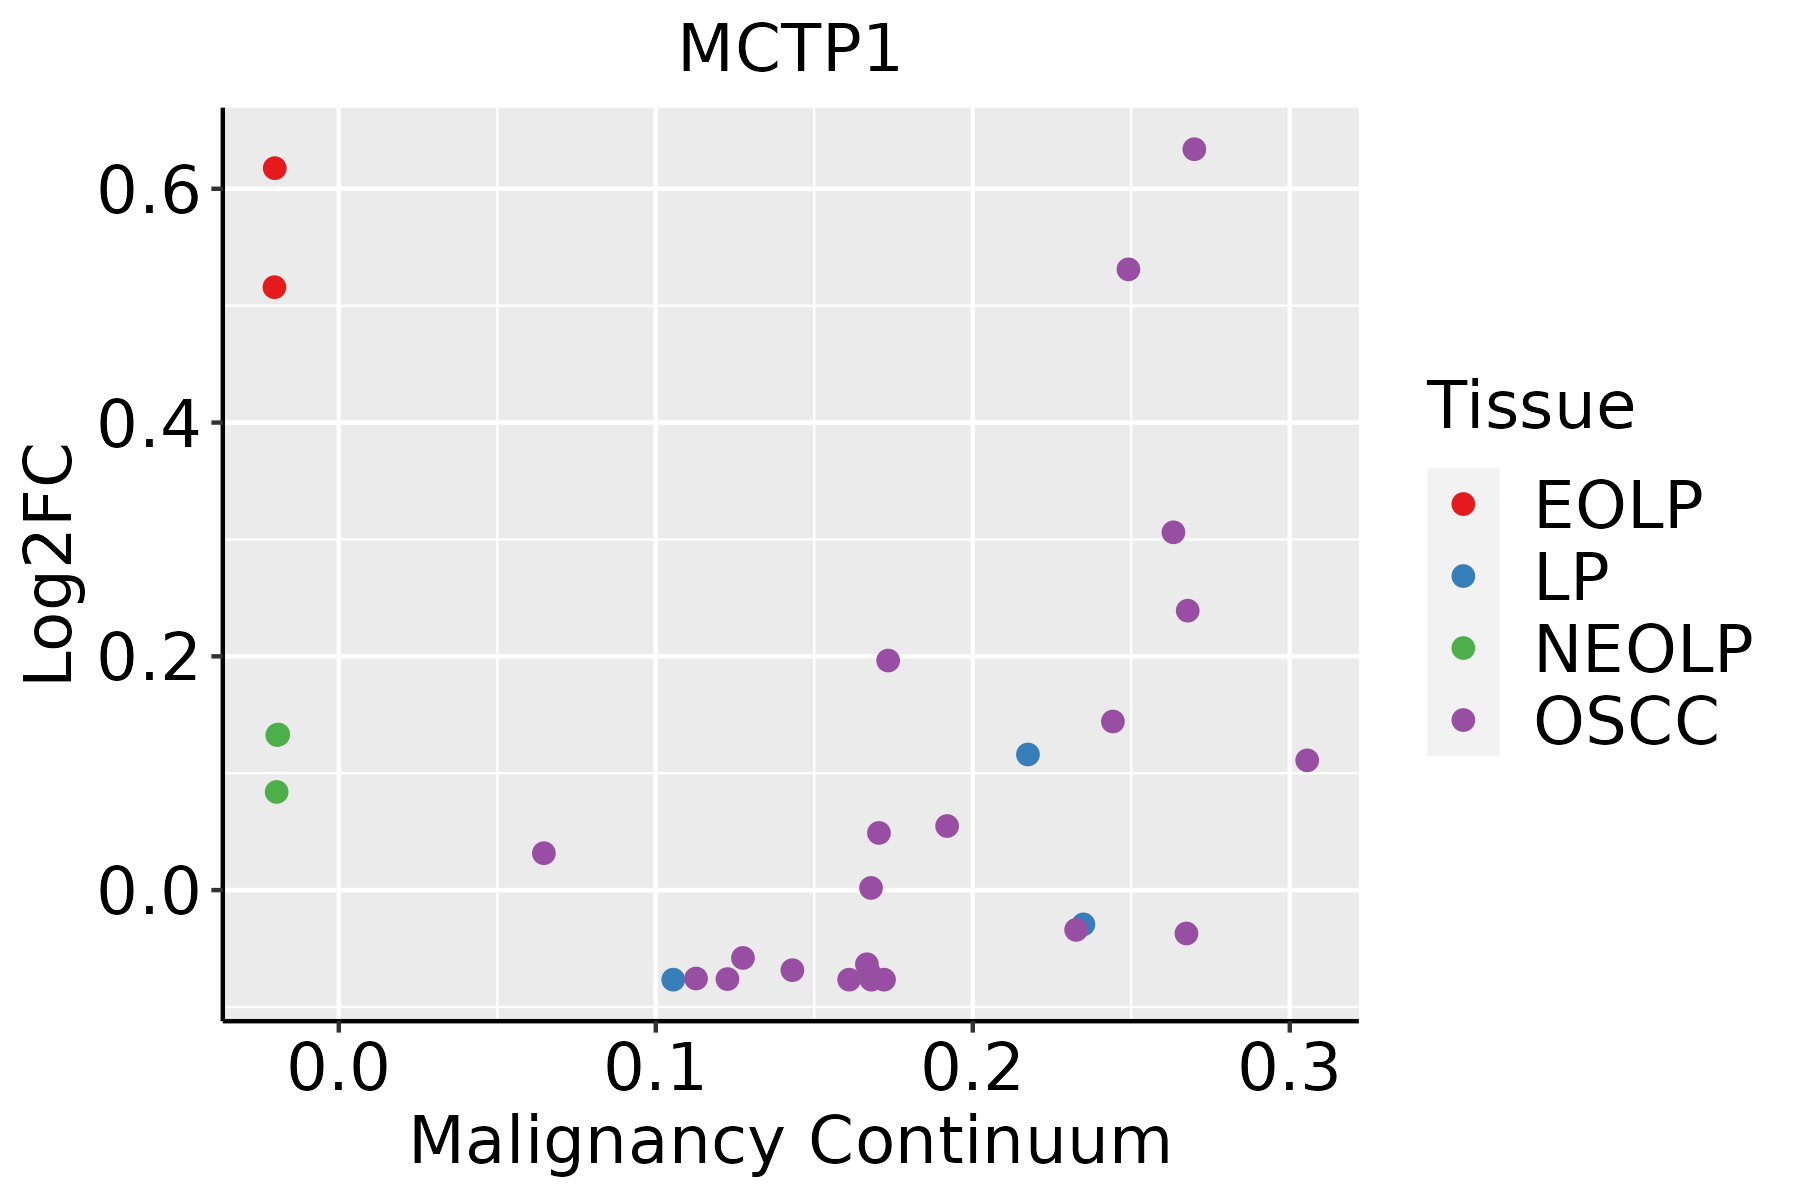 | EOLP: Erosive Oral lichen planus |
| LP: leukoplakia | ||
| NEOLP: Non-erosive oral lichen planus | ||
| OSCC: Oral squamous cell carcinoma |
| ∗log2FC in expression of this searched gene in stem-like cells from each diseased tissue sample relative to stem-like cells in normal samples in each tissue plotted against the malignancy continuum. Samples are colored based on if they are from different disease stage. |
Top |
Malignant transformation related pathway analysis |
| Find out the enriched GO biological processes and KEGG pathways involved in transition from healthy to precancer to cancer |
| Tissue | Disease Stage | Enriched GO biological Processes |
| Colorectum | AD |  |
| Colorectum | SER |  |
| Colorectum | MSS |  |
| Colorectum | MSI-H |  |
| Colorectum | FAP |  |
| ∗Top 15 enriched GO BP terms are showed in the bar plot of each disease state in each tissue. Each row represents a significant GO biological process which is colored according to the -log10(p.adjust). |
| Page: 1 2 3 4 5 6 7 8 9 |
| GO ID | Tissue | Disease Stage | Description | Gene Ratio | Bg Ratio | pvalue | p.adjust | Count |
| GO:0019932 | Lung | AIS | second-messenger-mediated signaling | 46/1849 | 312/18723 | 3.79e-03 | 3.52e-02 | 46 |
| GO:000697923 | Lung | MIAC | response to oxidative stress | 43/967 | 446/18723 | 6.39e-05 | 3.12e-03 | 43 |
| GO:00199321 | Lung | MIAC | second-messenger-mediated signaling | 30/967 | 312/18723 | 8.15e-04 | 1.80e-02 | 30 |
| GO:003010022 | Lung | MIAC | regulation of endocytosis | 22/967 | 211/18723 | 1.39e-03 | 2.51e-02 | 22 |
| GO:190288222 | Lung | MIAC | regulation of response to oxidative stress | 13/967 | 98/18723 | 1.57e-03 | 2.67e-02 | 13 |
| GO:0051588 | Lung | MIAC | regulation of neurotransmitter transport | 13/967 | 100/18723 | 1.89e-03 | 3.02e-02 | 13 |
| GO:19028832 | Lung | MIAC | negative regulation of response to oxidative stress | 6/967 | 27/18723 | 2.17e-03 | 3.35e-02 | 6 |
| GO:000697920 | Oral cavity | OSCC | response to oxidative stress | 273/7305 | 446/18723 | 8.35e-22 | 1.65e-19 | 273 |
| GO:003010016 | Oral cavity | OSCC | regulation of endocytosis | 121/7305 | 211/18723 | 4.74e-08 | 8.80e-07 | 121 |
| GO:190288218 | Oral cavity | OSCC | regulation of response to oxidative stress | 50/7305 | 98/18723 | 1.03e-02 | 3.53e-02 | 50 |
| GO:003010023 | Oral cavity | EOLP | regulation of endocytosis | 51/2218 | 211/18723 | 4.24e-07 | 1.19e-05 | 51 |
| GO:000697926 | Oral cavity | EOLP | response to oxidative stress | 87/2218 | 446/18723 | 1.62e-06 | 3.80e-05 | 87 |
| GO:00303366 | Oral cavity | EOLP | negative regulation of cell migration | 64/2218 | 344/18723 | 1.57e-04 | 1.67e-03 | 64 |
| GO:00512716 | Oral cavity | EOLP | negative regulation of cellular component movement | 67/2218 | 367/18723 | 1.97e-04 | 2.00e-03 | 67 |
| GO:20001466 | Oral cavity | EOLP | negative regulation of cell motility | 65/2218 | 359/18723 | 3.09e-04 | 2.89e-03 | 65 |
| GO:00510517 | Oral cavity | EOLP | negative regulation of transport | 80/2218 | 470/18723 | 5.11e-04 | 4.44e-03 | 80 |
| GO:00400136 | Oral cavity | EOLP | negative regulation of locomotion | 67/2218 | 391/18723 | 1.17e-03 | 8.47e-03 | 67 |
| Page: 1 2 3 |
| Pathway ID | Tissue | Disease Stage | Description | Gene Ratio | Bg Ratio | pvalue | p.adjust | qvalue | Count |
| Page: 1 |
Top |
Cell-cell communication analysis |
| Identification of potential cell-cell interactions between two cell types and their ligand-receptor pairs for different disease states |
| Ligand | Receptor | LRpair | Pathway | Tissue | Disease Stage |
| Page: 1 |
Top |
Single-cell gene regulatory network inference analysis |
| Find out the significant the regulons (TFs) and the target genes of each regulon across cell types for different disease states |
| TF | Cell Type | Tissue | Disease Stage | Target Gene | RSS | Regulon Activity |
| ∗The dot plots of a searched regulon are shown for all cell subpopulations in each disease state of each tissue based on the regulon specific score inferred using pySCENIC and by calculating the average expression. |
| Page: 1 |
Top |
Somatic mutation of malignant transformation related genes |
| Annotation of somatic variants for genes involved in malignant transformation |
| Hugo Symbol | Variant Class | Variant Classification | dbSNP RS | HGVSc | HGVSp | HGVSp Short | SWISSPROT | BIOTYPE | SIFT | PolyPhen | Tumor Sample Barcode | Tissue | Histology | Sex | Age | Stage | Therapy Types | Drugs | Outcome |
| MCTP1 | SNV | Missense_Mutation | rs772947808 | c.903N>G | p.Ile301Met | p.I301M | Q6DN14 | protein_coding | deleterious(0.02) | probably_damaging(0.978) | TCGA-A2-A25C-01 | Breast | breast invasive carcinoma | Female | <65 | I/II | Chemotherapy | taxotere | SD |
| MCTP1 | SNV | Missense_Mutation | novel | c.488N>T | p.Ser163Leu | p.S163L | Q6DN14 | protein_coding | tolerated(0.06) | benign(0) | TCGA-AC-A23H-01 | Breast | breast invasive carcinoma | Female | >=65 | I/II | Unknown | Unknown | PD |
| MCTP1 | SNV | Missense_Mutation | novel | c.1754N>A | p.Thr585Lys | p.T585K | Q6DN14 | protein_coding | deleterious(0.02) | probably_damaging(0.984) | TCGA-AC-A2QH-01 | Breast | breast invasive carcinoma | Female | <65 | I/II | Chemotherapy | cytoxan | CR |
| MCTP1 | SNV | Missense_Mutation | c.1185N>A | p.Met395Ile | p.M395I | Q6DN14 | protein_coding | tolerated(0.12) | benign(0.001) | TCGA-C8-A274-01 | Breast | breast invasive carcinoma | Female | <65 | I/II | Hormone Therapy | tamoxiphen | SD | |
| MCTP1 | SNV | Missense_Mutation | c.524N>T | p.Arg175Met | p.R175M | Q6DN14 | protein_coding | tolerated_low_confidence(0.19) | benign(0.436) | TCGA-D8-A1XG-01 | Breast | breast invasive carcinoma | Female | >=65 | III/IV | Unknown | Unknown | SD | |
| MCTP1 | SNV | Missense_Mutation | novel | c.2758G>A | p.Ala920Thr | p.A920T | Q6DN14 | protein_coding | deleterious(0.03) | probably_damaging(0.999) | TCGA-2W-A8YY-01 | Cervix | cervical & endocervical cancer | Female | <65 | I/II | Chemotherapy | cisplatin | CR |
| MCTP1 | SNV | Missense_Mutation | c.2707G>A | p.Glu903Lys | p.E903K | Q6DN14 | protein_coding | deleterious(0) | probably_damaging(0.996) | TCGA-2W-A8YY-01 | Cervix | cervical & endocervical cancer | Female | <65 | I/II | Chemotherapy | cisplatin | CR | |
| MCTP1 | SNV | Missense_Mutation | novel | c.1821G>T | p.Glu607Asp | p.E607D | Q6DN14 | protein_coding | tolerated(0.43) | benign(0.039) | TCGA-2W-A8YY-01 | Cervix | cervical & endocervical cancer | Female | <65 | I/II | Chemotherapy | cisplatin | CR |
| MCTP1 | SNV | Missense_Mutation | novel | c.1142N>G | p.Leu381Arg | p.L381R | Q6DN14 | protein_coding | deleterious(0) | probably_damaging(0.991) | TCGA-C5-A8XH-01 | Cervix | cervical & endocervical cancer | Female | <65 | I/II | Unknown | Unknown | SD |
| MCTP1 | SNV | Missense_Mutation | novel | c.754G>A | p.Glu252Lys | p.E252K | Q6DN14 | protein_coding | tolerated(0.09) | benign(0.038) | TCGA-C5-A905-01 | Cervix | cervical & endocervical cancer | Female | <65 | I/II | Unknown | Unknown | SD |
| Page: 1 2 3 4 5 6 7 8 9 10 11 12 |
Top |
Related drugs of malignant transformation related genes |
| Identification of chemicals and drugs interact with genes involved in malignant transfromation |
| (DGIdb 4.0) |
| Entrez ID | Symbol | Category | Interaction Types | Drug Claim Name | Drug Name | PMIDs |
| Page: 1 |

Copyright 2023-Present -The University of Texas Health Science Center at Houston |