Schematic overview of the cellular and molecular mechanisms involved in the cancer progression, including the proposed cellular and molecular mechanisms in cancer cells trajectory. AT1: alveolar type 1 cells; AT2: alveolar type 2 cells; AAH: atypical adenomatous hyperplasia; AIS: adenocarcinoma in situ; MIA: minimally invasive adenocarcinoma; IA: invasive adenocarcinoma; EMT: epithelial-mesenchymal transition

Home

Download

Statistics

Help

Contact

Center for Computational Systems Medicine
leaf

Gene summary

leaf

Malignant transformation analysis

leaf

Malignant transformation related pathway analysis

leaf

Cell-cell communication analysis

leaf

Single-cell gene regulatory network inference analysis

leaf

Somatic mutation of malignant transformation related genes

leaf

Related drugs of malignant transformation related genes

Gene: MBIP

Gene summary for MBIP

check button Gene summary.

Gene informationSpeciesHuman
Gene symbol

MBIP

Gene ID

51562

Gene nameMAP3K12 binding inhibitory protein 1
Gene AliasMBIP
Cytomap14q13.3
Gene Typeprotein-coding
GO ID

GO:0000165

UniProtAcc

Q9NS73


Top

Malignant transformation analysis

check button Identification of the aberrant gene expression in precancerous and cancerous lesions by comparing the gene expression of stem-like cells in diseased tissues with normal stem cells
check button Malignant transformation involving gene list.
Entrez IDSymbolReplicatesSpeciesOrganTissueAdj P-valueLog2FCMalignancy
51562MBIPLZE2THumanEsophagusESCC1.25e-042.98e-010.082
51562MBIPLZE4THumanEsophagusESCC3.16e-236.40e-010.0811
51562MBIPLZE5THumanEsophagusESCC1.61e-054.21e-010.0514
51562MBIPLZE7THumanEsophagusESCC1.51e-047.81e-020.0667
51562MBIPLZE8THumanEsophagusESCC6.74e-061.16e-010.067
51562MBIPLZE20THumanEsophagusESCC2.81e-061.23e-010.0662
51562MBIPLZE22THumanEsophagusESCC9.76e-054.21e-010.068
51562MBIPLZE24THumanEsophagusESCC7.29e-192.31e-010.0596
51562MBIPLZE6THumanEsophagusESCC1.53e-051.18e-010.0845
51562MBIPP2T-EHumanEsophagusESCC6.61e-213.09e-010.1177
51562MBIPP4T-EHumanEsophagusESCC5.81e-112.98e-010.1323
51562MBIPP5T-EHumanEsophagusESCC3.21e-203.58e-010.1327
51562MBIPP8T-EHumanEsophagusESCC1.14e-691.21e+000.0889
51562MBIPP9T-EHumanEsophagusESCC3.27e-132.27e-010.1131
51562MBIPP10T-EHumanEsophagusESCC8.86e-356.51e-010.116
51562MBIPP11T-EHumanEsophagusESCC3.06e-125.13e-010.1426
51562MBIPP12T-EHumanEsophagusESCC7.10e-731.54e+000.1122
51562MBIPP15T-EHumanEsophagusESCC1.75e-418.41e-010.1149
51562MBIPP16T-EHumanEsophagusESCC1.42e-152.57e-010.1153
51562MBIPP17T-EHumanEsophagusESCC2.57e-042.84e-010.1278
Page: 1 2 3 4 5 

check button Transcriptomic changes along malignancy continuum.
TissueExpression DynamicsAbbreviation
EsophagusThe image shows the transcriptomic changes along malignancy continuum.log2FC in expression of this searched gene in stem-like cells from each diseased tissue sample relative to stem-like cells in normal samples in each tissue plotted against the malignancy continuum. Samples are colored based on if they are from different disease stage.ESCC: Esophageal squamous cell carcinoma
HGIN: High-grade intraepithelial neoplasias
LGIN: Low-grade intraepithelial neoplasias
LiverThe image shows the transcriptomic changes along malignancy continuum.log2FC in expression of this searched gene in stem-like cells from each diseased tissue sample relative to stem-like cells in normal samples in each tissue plotted against the malignancy continuum. Samples are colored based on if they are from different disease stage.
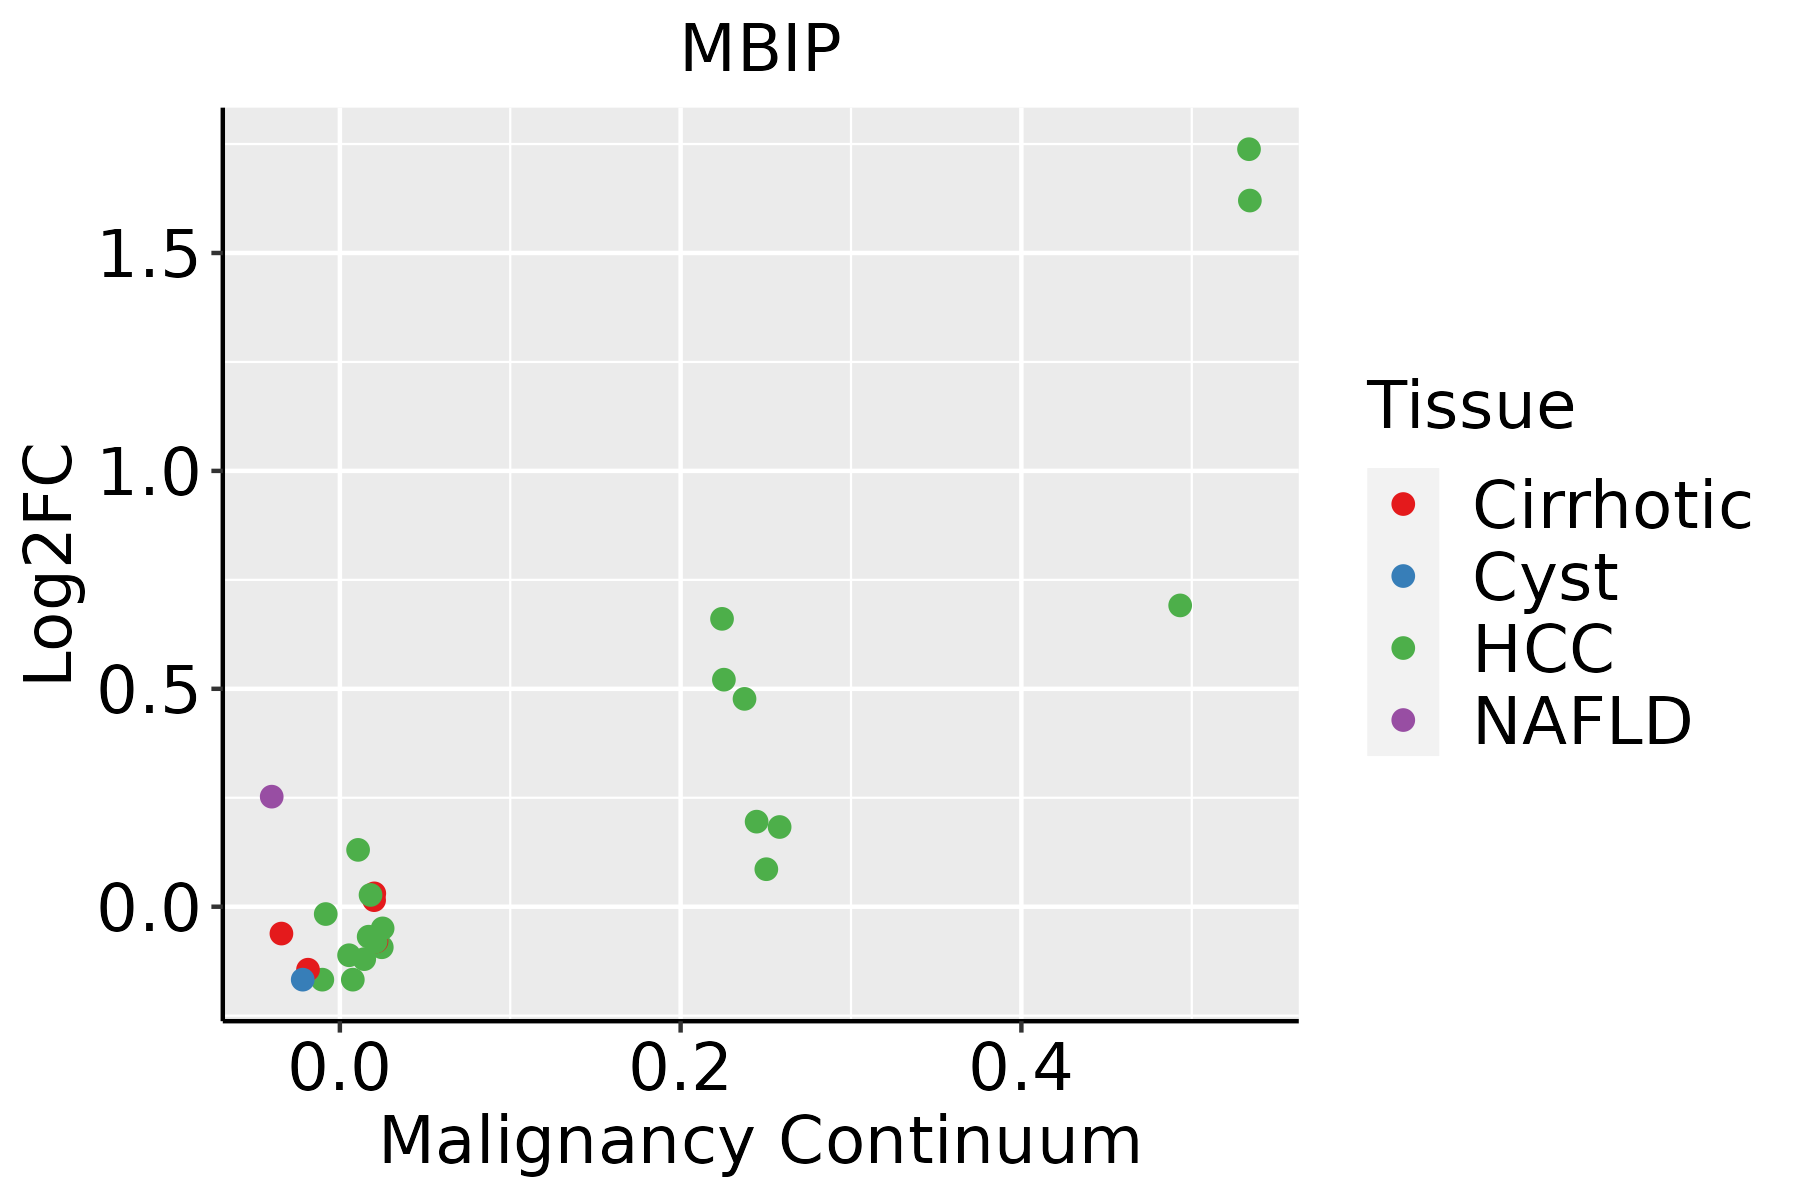
HCC: Hepatocellular carcinoma
NAFLD: Non-alcoholic fatty liver disease
Oral CavityThe image shows the transcriptomic changes along malignancy continuum.log2FC in expression of this searched gene in stem-like cells from each diseased tissue sample relative to stem-like cells in normal samples in each tissue plotted against the malignancy continuum. Samples are colored based on if they are from different disease stage.EOLP: Erosive Oral lichen planus
LP: leukoplakia
NEOLP: Non-erosive oral lichen planus
OSCC: Oral squamous cell carcinoma
SkinThe image shows the transcriptomic changes along malignancy continuum.log2FC in expression of this searched gene in stem-like cells from each diseased tissue sample relative to stem-like cells in normal samples in each tissue plotted against the malignancy continuum. Samples are colored based on if they are from different disease stage.
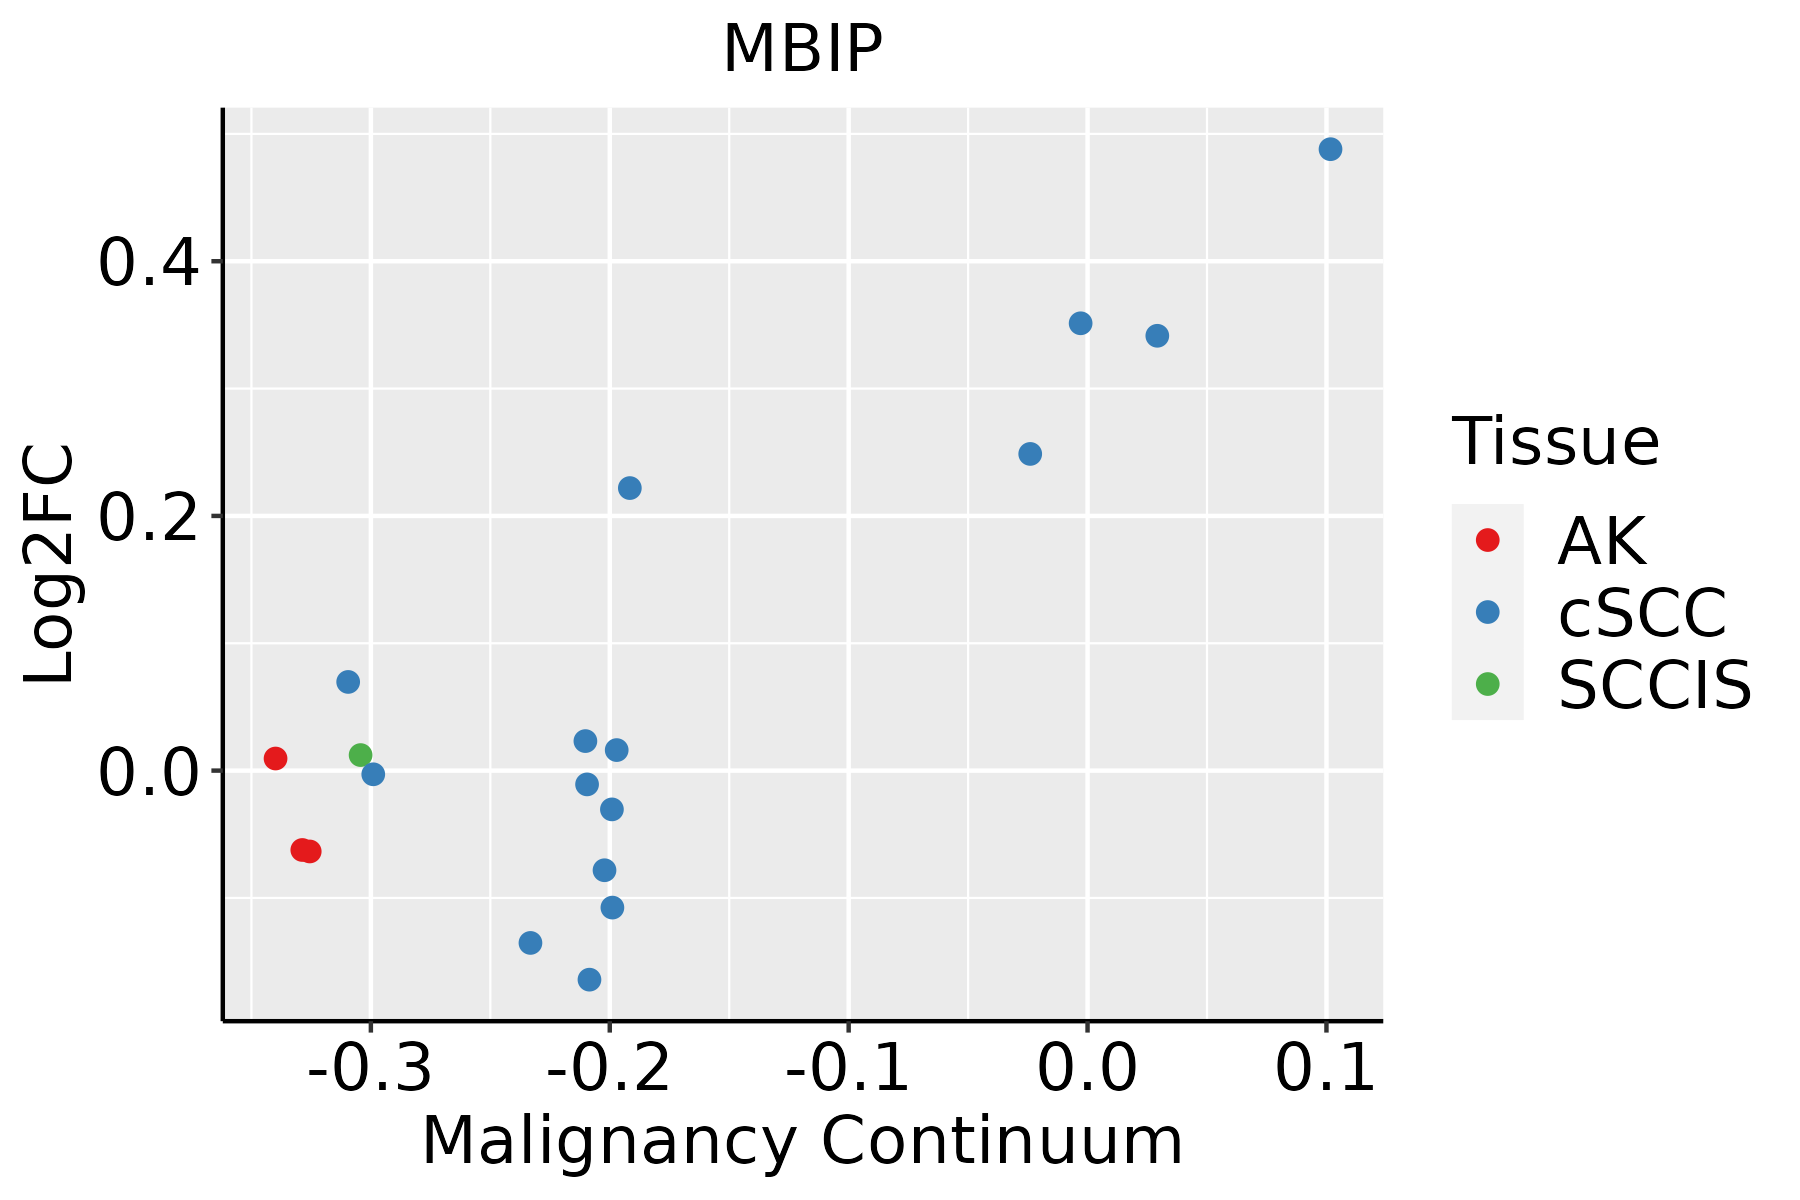
AK: Actinic keratosis
cSCC: Cutaneous squamous cell carcinoma
SCCIS:squamous cell carcinoma in situ
ThyroidThe image shows the transcriptomic changes along malignancy continuum.log2FC in expression of this searched gene in stem-like cells from each diseased tissue sample relative to stem-like cells in normal samples in each tissue plotted against the malignancy continuum. Samples are colored based on if they are from different disease stage.
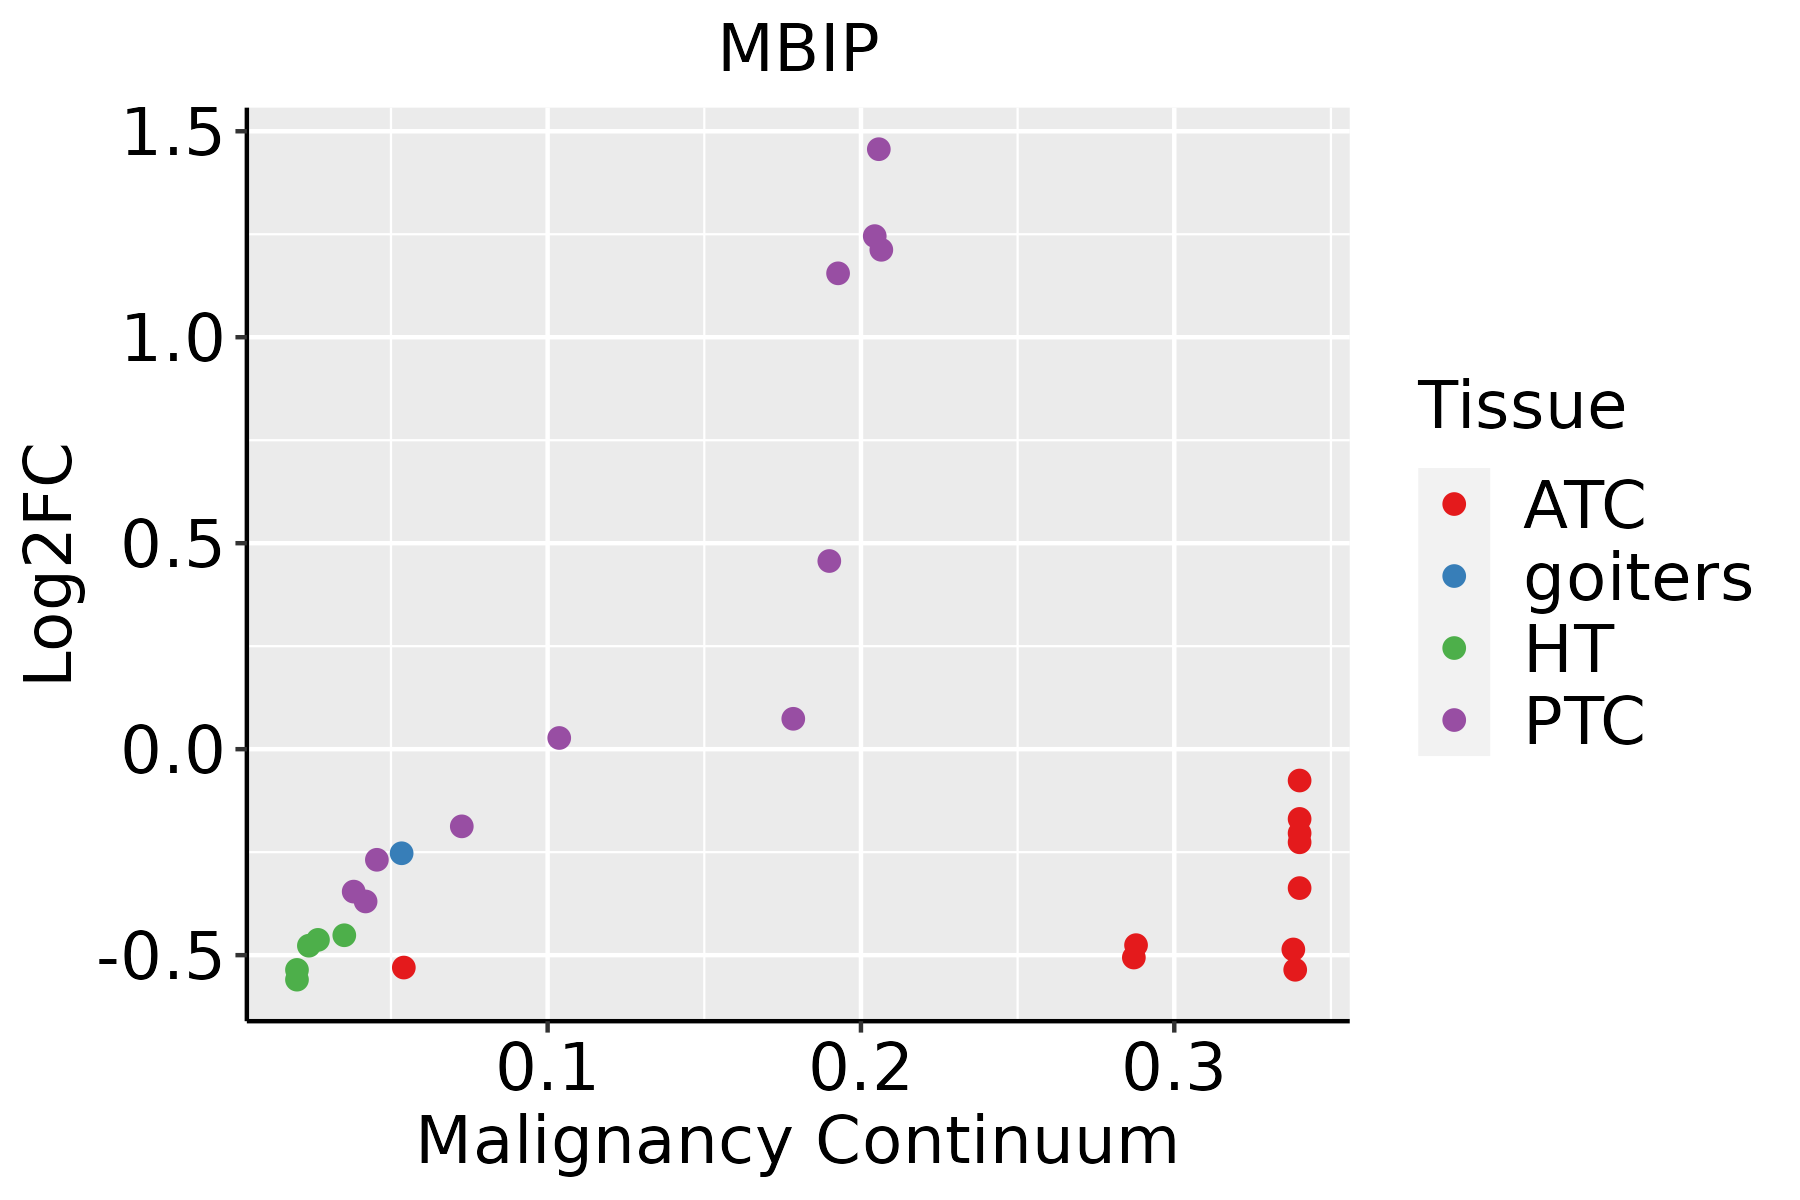
ATC: Anaplastic thyroid cancer
HT: Hashimoto's thyroiditis
PTC: Papillary thyroid cancer
∗log2FC in expression of this searched gene in stem-like cells from each diseased tissue sample relative to stem-like cells in normal samples in each tissue plotted against the malignancy continuum. Samples are colored based on if they are from different disease stage.

Top

Malignant transformation related pathway analysis

check buttonFind out the enriched GO biological processes and KEGG pathways involved in transition from healthy to precancer to cancer
check button Figure of enriched GO biological processes.
TissueDisease StageEnriched GO biological Processes
ColorectumADGO analysis - Figure of enriched GO biological processes: Top 15 enriched GO BP terms are showed in the bar plot of each disease state in each tissue. Each row represents a significant GO biological process which is colored according to the -log10(p.adjust).
ColorectumSERGO analysis - Figure of enriched GO biological processes: Top 15 enriched GO BP terms are showed in the bar plot of each disease state in each tissue. Each row represents a significant GO biological process which is colored according to the -log10(p.adjust).
ColorectumMSSGO analysis - Figure of enriched GO biological processes: Top 15 enriched GO BP terms are showed in the bar plot of each disease state in each tissue. Each row represents a significant GO biological process which is colored according to the -log10(p.adjust).
ColorectumMSI-HGO analysis - Figure of enriched GO biological processes: Top 15 enriched GO BP terms are showed in the bar plot of each disease state in each tissue. Each row represents a significant GO biological process which is colored according to the -log10(p.adjust).
ColorectumFAPGO analysis - Figure of enriched GO biological processes: Top 15 enriched GO BP terms are showed in the bar plot of each disease state in each tissue. Each row represents a significant GO biological process which is colored according to the -log10(p.adjust).
∗Top 15 enriched GO BP terms are showed in the bar plot of each disease state in each tissue. Each row represents a significant GO biological process which is colored according to the -log10(p.adjust).
Page: 1 2 3 4 5 6 7 8 9 

check button Enriched GO biological processes.
GO IDTissueDisease StageDescriptionGene RatioBg Ratiopvaluep.adjustCount
GO:003109816Oral cavityOSCCstress-activated protein kinase signaling cascade141/7305247/187235.74e-091.25e-07141
GO:005140316Oral cavityOSCCstress-activated MAPK cascade134/7305239/187236.02e-081.09e-06134
GO:007030210Oral cavityOSCCregulation of stress-activated protein kinase signaling cascade111/7305195/187232.82e-074.34e-06111
GO:003287210Oral cavityOSCCregulation of stress-activated MAPK cascade108/7305192/187238.97e-071.22e-05108
GO:00072548Oral cavityOSCCJNK cascade90/7305167/187236.49e-055.26e-0490
GO:00463288Oral cavityOSCCregulation of JNK cascade74/7305133/187237.22e-055.69e-0474
GO:00439661Oral cavityOSCChistone H3 acetylation36/730561/187231.21e-036.10e-0336
GO:00703045Oral cavityOSCCpositive regulation of stress-activated protein kinase signaling cascade66/7305128/187232.58e-031.13e-0266
GO:00328744Oral cavityOSCCpositive regulation of stress-activated MAPK cascade64/7305126/187234.67e-031.87e-0264
GO:00434107Oral cavityOSCCpositive regulation of MAPK cascade213/7305480/187238.71e-033.16e-02213
GO:00463301Oral cavityOSCCpositive regulation of JNK cascade46/730589/187231.01e-023.50e-0246
GO:001657024SkincSCChistone modification179/4864463/187239.65e-103.74e-08179
GO:000647314SkincSCCprotein acetylation84/4864201/187236.94e-071.29e-0584
GO:001839414SkincSCCpeptidyl-lysine acetylation72/4864169/187231.81e-063.02e-0572
GO:001820515SkincSCCpeptidyl-lysine modification137/4864376/187234.09e-066.09e-05137
GO:004354314SkincSCCprotein acylation95/4864243/187234.56e-066.71e-0595
GO:000647514SkincSCCinternal protein amino acid acetylation66/4864160/187231.72e-052.07e-0466
GO:001839314SkincSCCinternal peptidyl-lysine acetylation65/4864158/187232.19e-052.54e-0465
GO:001657313SkincSCChistone acetylation62/4864152/187234.54e-054.75e-0462
GO:003109825SkincSCCstress-activated protein kinase signaling cascade92/4864247/187235.78e-055.74e-0492
Page: 1 2 3 4 5 6 

check button Enriched KEGG pathways.
Pathway IDTissueDisease StageDescriptionGene RatioBg Ratiopvaluep.adjustqvalueCount
Page: 1 

Top

Cell-cell communication analysis

check buttonIdentification of potential cell-cell interactions between two cell types and their ligand-receptor pairs for different disease states
LigandReceptorLRpairPathwayTissueDisease Stage
Page: 1 

Top

Single-cell gene regulatory network inference analysis

check buttonFind out the significant the regulons (TFs) and the target genes of each regulon across cell types for different disease states
TFCell TypeTissueDisease StageTarget GeneRSSRegulon Activity
∗The dot plots of a searched regulon are shown for all cell subpopulations in each disease state of each tissue based on the regulon specific score inferred using pySCENIC and by calculating the average expression.
Page: 1 

Top

Somatic mutation of malignant transformation related genes

check buttonAnnotation of somatic variants for genes involved in malignant transformation
Hugo SymbolVariant ClassVariant ClassificationdbSNP RSHGVScHGVSpHGVSp ShortSWISSPROTBIOTYPESIFTPolyPhenTumor Sample BarcodeTissueHistologySexAgeStageTherapy TypesDrugsOutcome
MBIPSNVMissense_Mutationnovelc.558N>Gp.Ile186Metp.I186MQ9NS73protein_codingtolerated(0.06)probably_damaging(0.951)TCGA-E9-A54X-01Breastbreast invasive carcinomaFemale>=65I/IIUnknownUnknownSD
MBIPSNVMissense_Mutationrs764812440c.557N>Cp.Ile186Thrp.I186TQ9NS73protein_codingdeleterious(0)possibly_damaging(0.791)TCGA-E9-A54X-01Breastbreast invasive carcinomaFemale>=65I/IIUnknownUnknownSD
MBIPSNVMissense_Mutationnovelc.145N>Ap.Asp49Asnp.D49NQ9NS73protein_codingtolerated(0.17)probably_damaging(0.922)TCGA-WT-AB41-01Breastbreast invasive carcinomaFemale<65I/IIChemotherapytaxotereCR
MBIPinsertionFrame_Shift_Insnovelc.889-1_889insCAACCGGAGTTTTCAGGTGGGTTACAGAp.Ser297GlnfsTer29p.S297Qfs*29Q9NS73protein_codingTCGA-AO-A0J5-01Breastbreast invasive carcinomaFemale<65III/IVOther, specify in notesBisphosphonatezoledronicPD
MBIPdeletionFrame_Shift_Delnovelc.264delNp.Lys88AsnfsTer17p.K88Nfs*17Q9NS73protein_codingTCGA-EW-A2FV-01Breastbreast invasive carcinomaFemale<65III/IVChemotherapydocetaxelSD
MBIPSNVMissense_Mutationnovelc.101N>Cp.Phe34Serp.F34SQ9NS73protein_codingtolerated(0.1)benign(0.069)TCGA-2W-A8YY-01Cervixcervical & endocervical cancerFemale<65I/IIChemotherapycisplatinCR
MBIPSNVMissense_Mutationnovelc.133N>Cp.Asp45Hisp.D45HQ9NS73protein_codingdeleterious(0.01)benign(0.132)TCGA-C5-A2LZ-01Cervixcervical & endocervical cancerFemale>=65III/IVUnknownUnknownPD
MBIPSNVMissense_Mutationc.257T>Cp.Leu86Serp.L86SQ9NS73protein_codingtolerated(0.23)probably_damaging(0.97)TCGA-AA-3710-01Colorectumcolon adenocarcinomaFemale>=65I/IIUnknownUnknownSD
MBIPSNVMissense_Mutationc.844A>Gp.Ile282Valp.I282VQ9NS73protein_codingtolerated(0.05)possibly_damaging(0.472)TCGA-F5-6813-01Colorectumrectum adenocarcinomaMale>=65III/IVUnknownUnknownPD
MBIPdeletionFrame_Shift_Delc.257delNp.Leu86Terp.L86*Q9NS73protein_codingTCGA-AD-A5EJ-01Colorectumcolon adenocarcinomaFemale>=65I/IIUnknownUnknownSD
Page: 1 2 3 4 5 

Top

Related drugs of malignant transformation related genes

check buttonIdentification of chemicals and drugs interact with genes involved in malignant transfromation
(DGIdb 4.0)
Entrez IDSymbolCategoryInteraction TypesDrug Claim NameDrug NamePMIDs
Page: 1