
|
|||||
|
 | |
| |
| |
| |
| |
| |
|
Gene: MAP1S |
Gene summary for MAP1S |
| Gene information | Species | Human | Gene symbol | MAP1S | Gene ID | 55201 |
| Gene name | microtubule associated protein 1S | |
| Gene Alias | BPY2IP1 | |
| Cytomap | 19p13.11 | |
| Gene Type | protein-coding | GO ID | GO:0000226 | UniProtAcc | Q66K74 |
Top |
Malignant transformation analysis |
| Identification of the aberrant gene expression in precancerous and cancerous lesions by comparing the gene expression of stem-like cells in diseased tissues with normal stem cells |
| Entrez ID | Symbol | Replicates | Species | Organ | Tissue | Adj P-value | Log2FC | Malignancy |
| 55201 | MAP1S | LZE4T | Human | Esophagus | ESCC | 2.70e-08 | 1.68e-01 | 0.0811 |
| 55201 | MAP1S | LZE7T | Human | Esophagus | ESCC | 1.39e-08 | 3.57e-01 | 0.0667 |
| 55201 | MAP1S | LZE24T | Human | Esophagus | ESCC | 7.74e-22 | 5.45e-01 | 0.0596 |
| 55201 | MAP1S | LZE21T | Human | Esophagus | ESCC | 4.49e-07 | 2.70e-01 | 0.0655 |
| 55201 | MAP1S | P1T-E | Human | Esophagus | ESCC | 9.38e-08 | 4.36e-01 | 0.0875 |
| 55201 | MAP1S | P2T-E | Human | Esophagus | ESCC | 6.43e-16 | 1.43e-01 | 0.1177 |
| 55201 | MAP1S | P4T-E | Human | Esophagus | ESCC | 4.11e-17 | 3.13e-01 | 0.1323 |
| 55201 | MAP1S | P5T-E | Human | Esophagus | ESCC | 4.13e-07 | 1.42e-01 | 0.1327 |
| 55201 | MAP1S | P8T-E | Human | Esophagus | ESCC | 1.59e-18 | 3.60e-01 | 0.0889 |
| 55201 | MAP1S | P9T-E | Human | Esophagus | ESCC | 1.08e-13 | 2.10e-01 | 0.1131 |
| 55201 | MAP1S | P10T-E | Human | Esophagus | ESCC | 1.19e-12 | 1.88e-01 | 0.116 |
| 55201 | MAP1S | P11T-E | Human | Esophagus | ESCC | 1.47e-06 | 3.54e-01 | 0.1426 |
| 55201 | MAP1S | P12T-E | Human | Esophagus | ESCC | 4.31e-27 | 5.19e-01 | 0.1122 |
| 55201 | MAP1S | P15T-E | Human | Esophagus | ESCC | 4.25e-20 | 4.66e-01 | 0.1149 |
| 55201 | MAP1S | P16T-E | Human | Esophagus | ESCC | 3.09e-09 | 1.50e-01 | 0.1153 |
| 55201 | MAP1S | P17T-E | Human | Esophagus | ESCC | 4.57e-16 | 5.11e-01 | 0.1278 |
| 55201 | MAP1S | P19T-E | Human | Esophagus | ESCC | 2.79e-03 | 3.89e-01 | 0.1662 |
| 55201 | MAP1S | P20T-E | Human | Esophagus | ESCC | 1.33e-08 | 2.28e-01 | 0.1124 |
| 55201 | MAP1S | P21T-E | Human | Esophagus | ESCC | 1.91e-09 | 1.07e-01 | 0.1617 |
| 55201 | MAP1S | P22T-E | Human | Esophagus | ESCC | 4.03e-11 | 1.40e-01 | 0.1236 |
| Page: 1 2 3 4 5 |
| Tissue | Expression Dynamics | Abbreviation |
| Esophagus | 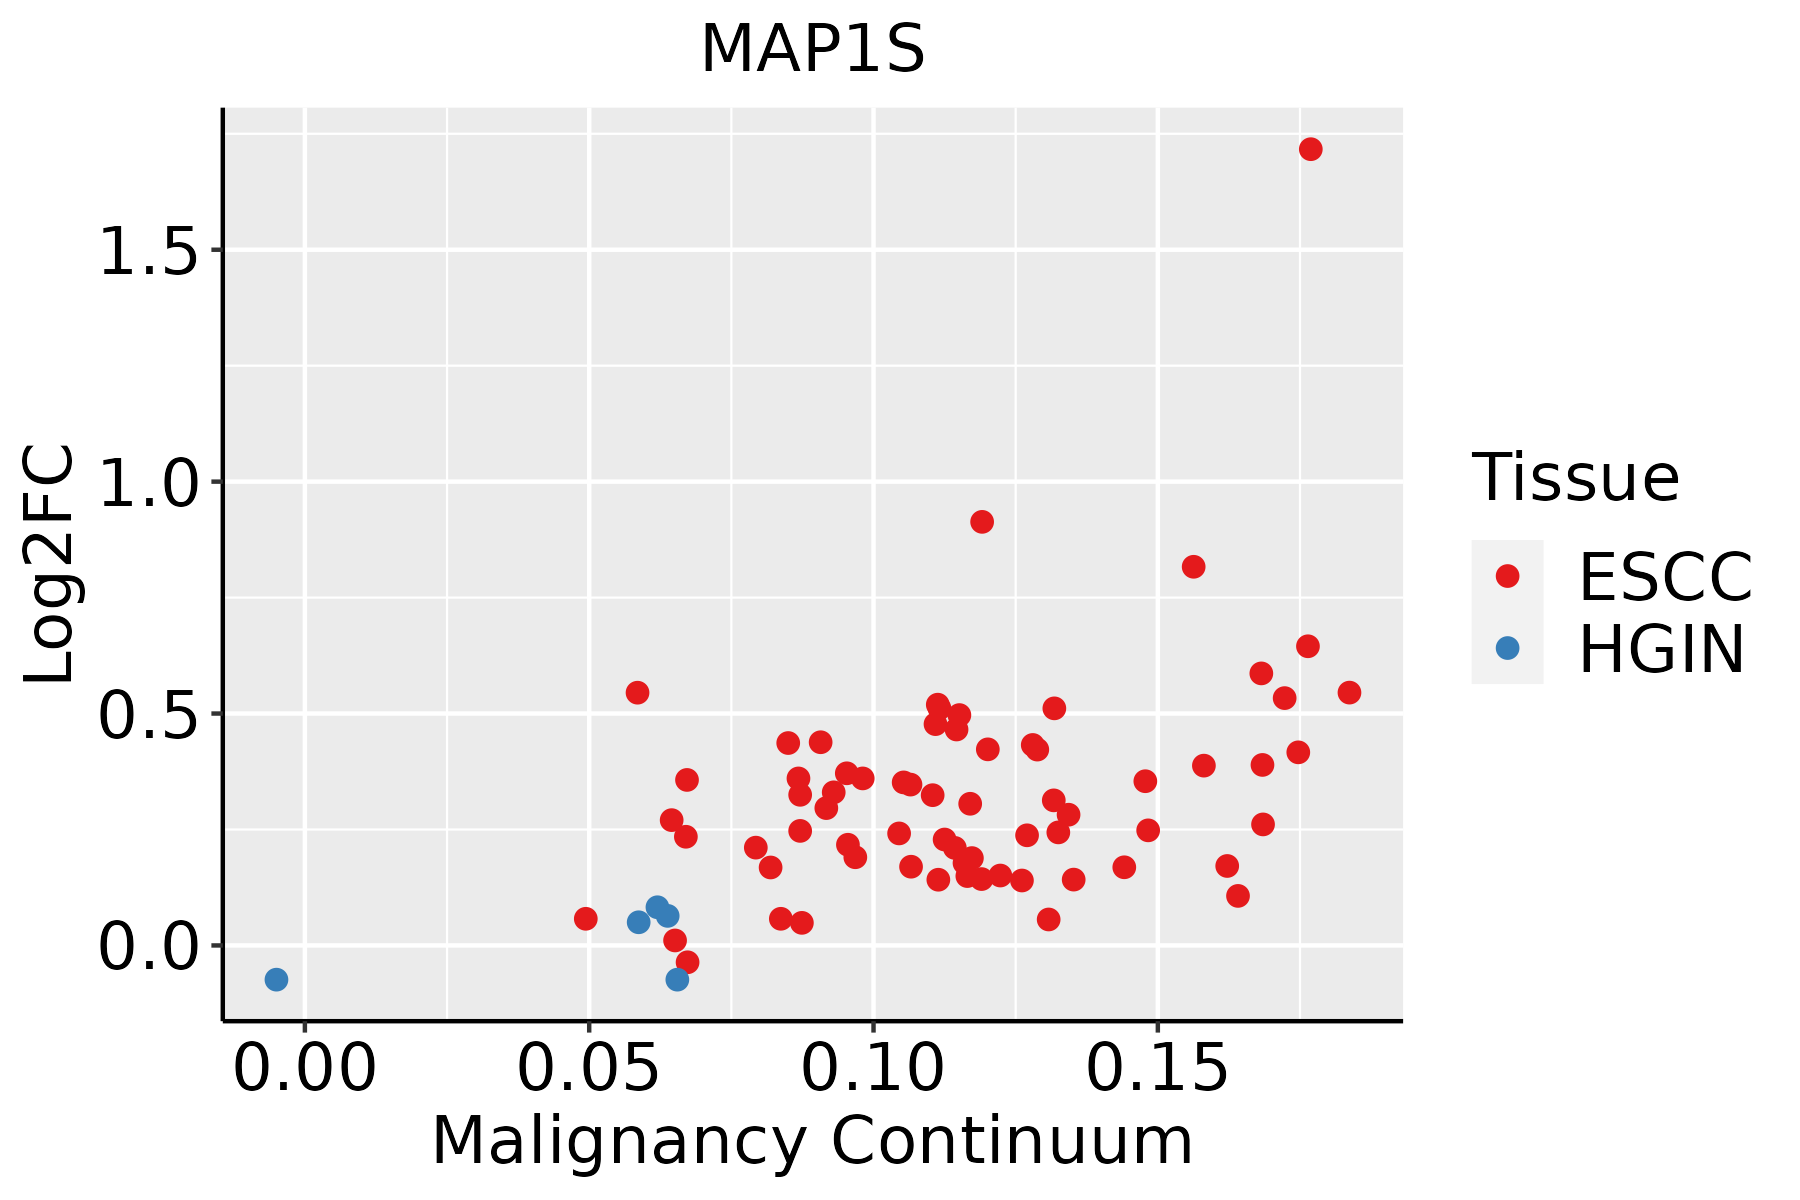 | ESCC: Esophageal squamous cell carcinoma |
| HGIN: High-grade intraepithelial neoplasias | ||
| LGIN: Low-grade intraepithelial neoplasias | ||
| Liver | 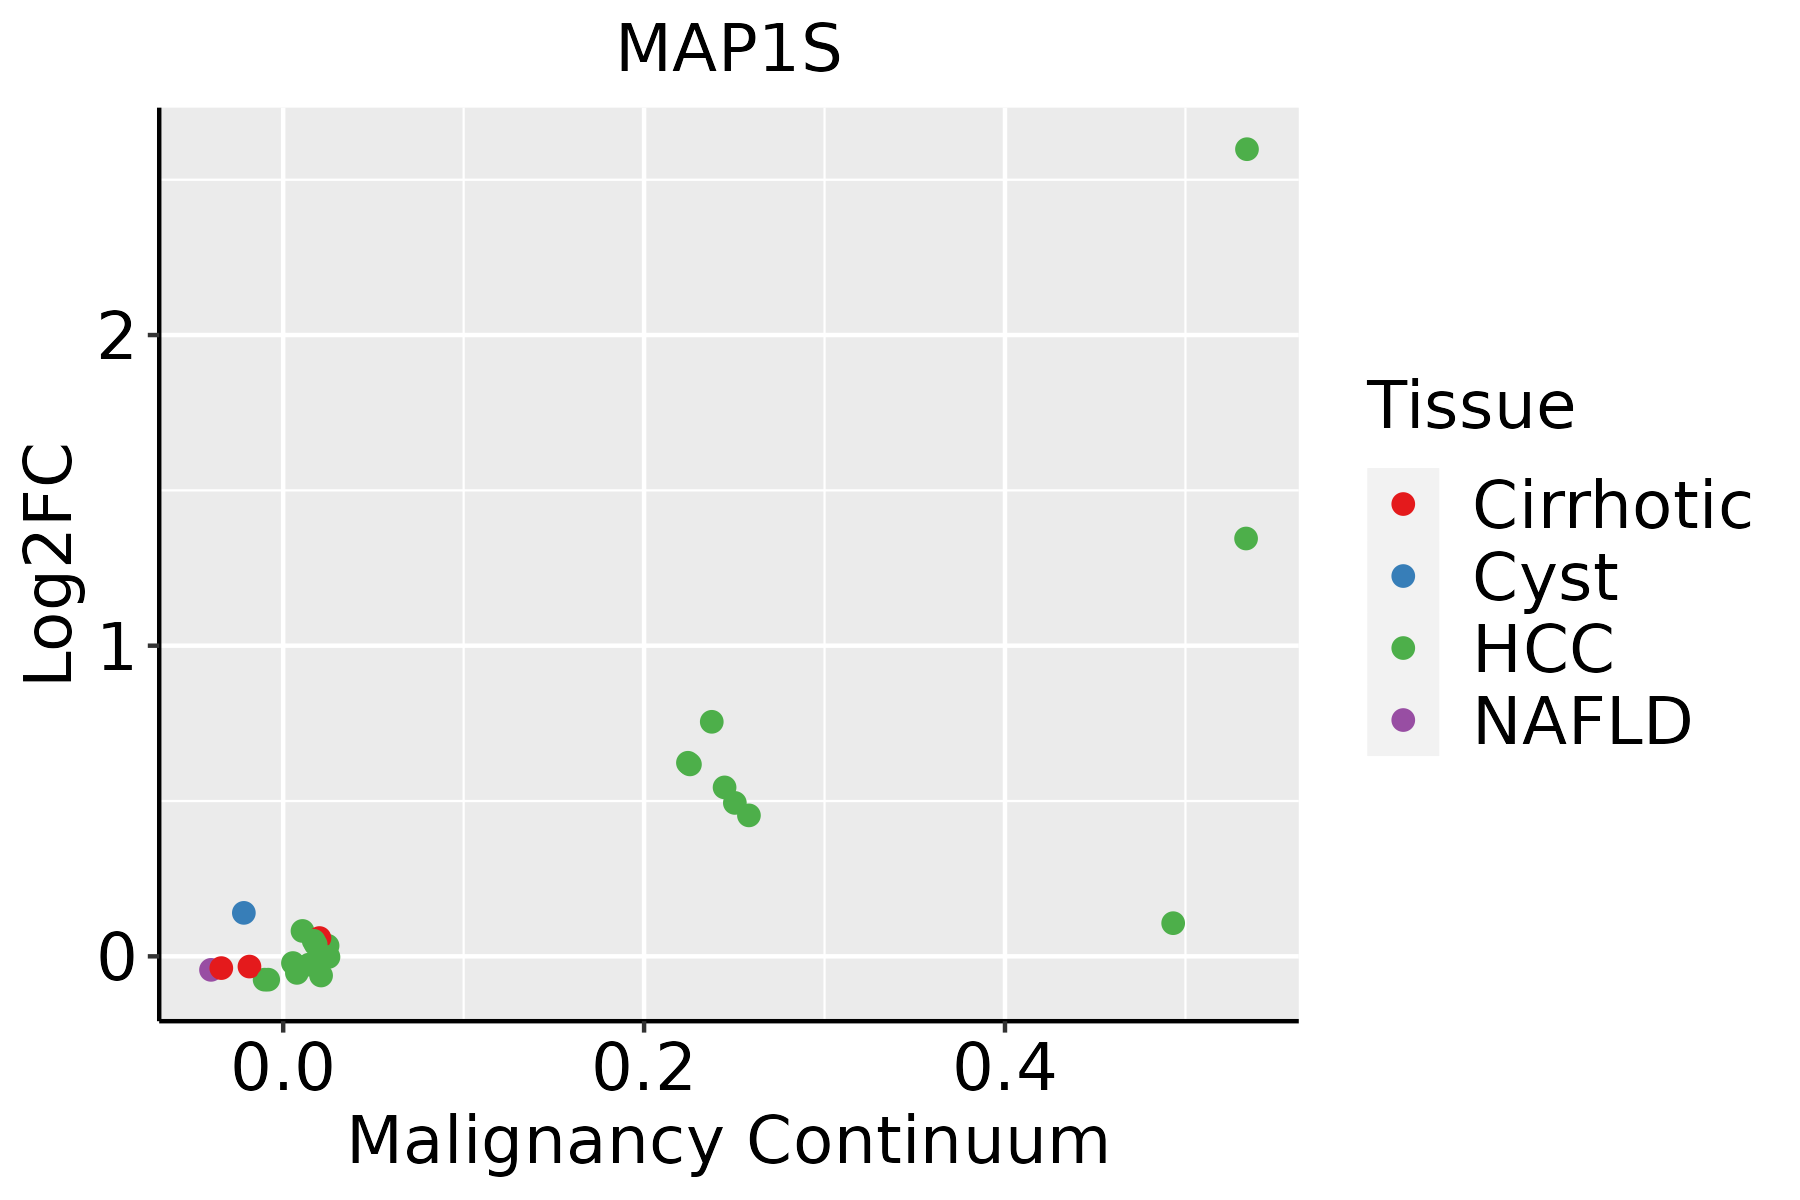 | HCC: Hepatocellular carcinoma |
| NAFLD: Non-alcoholic fatty liver disease | ||
| Thyroid | 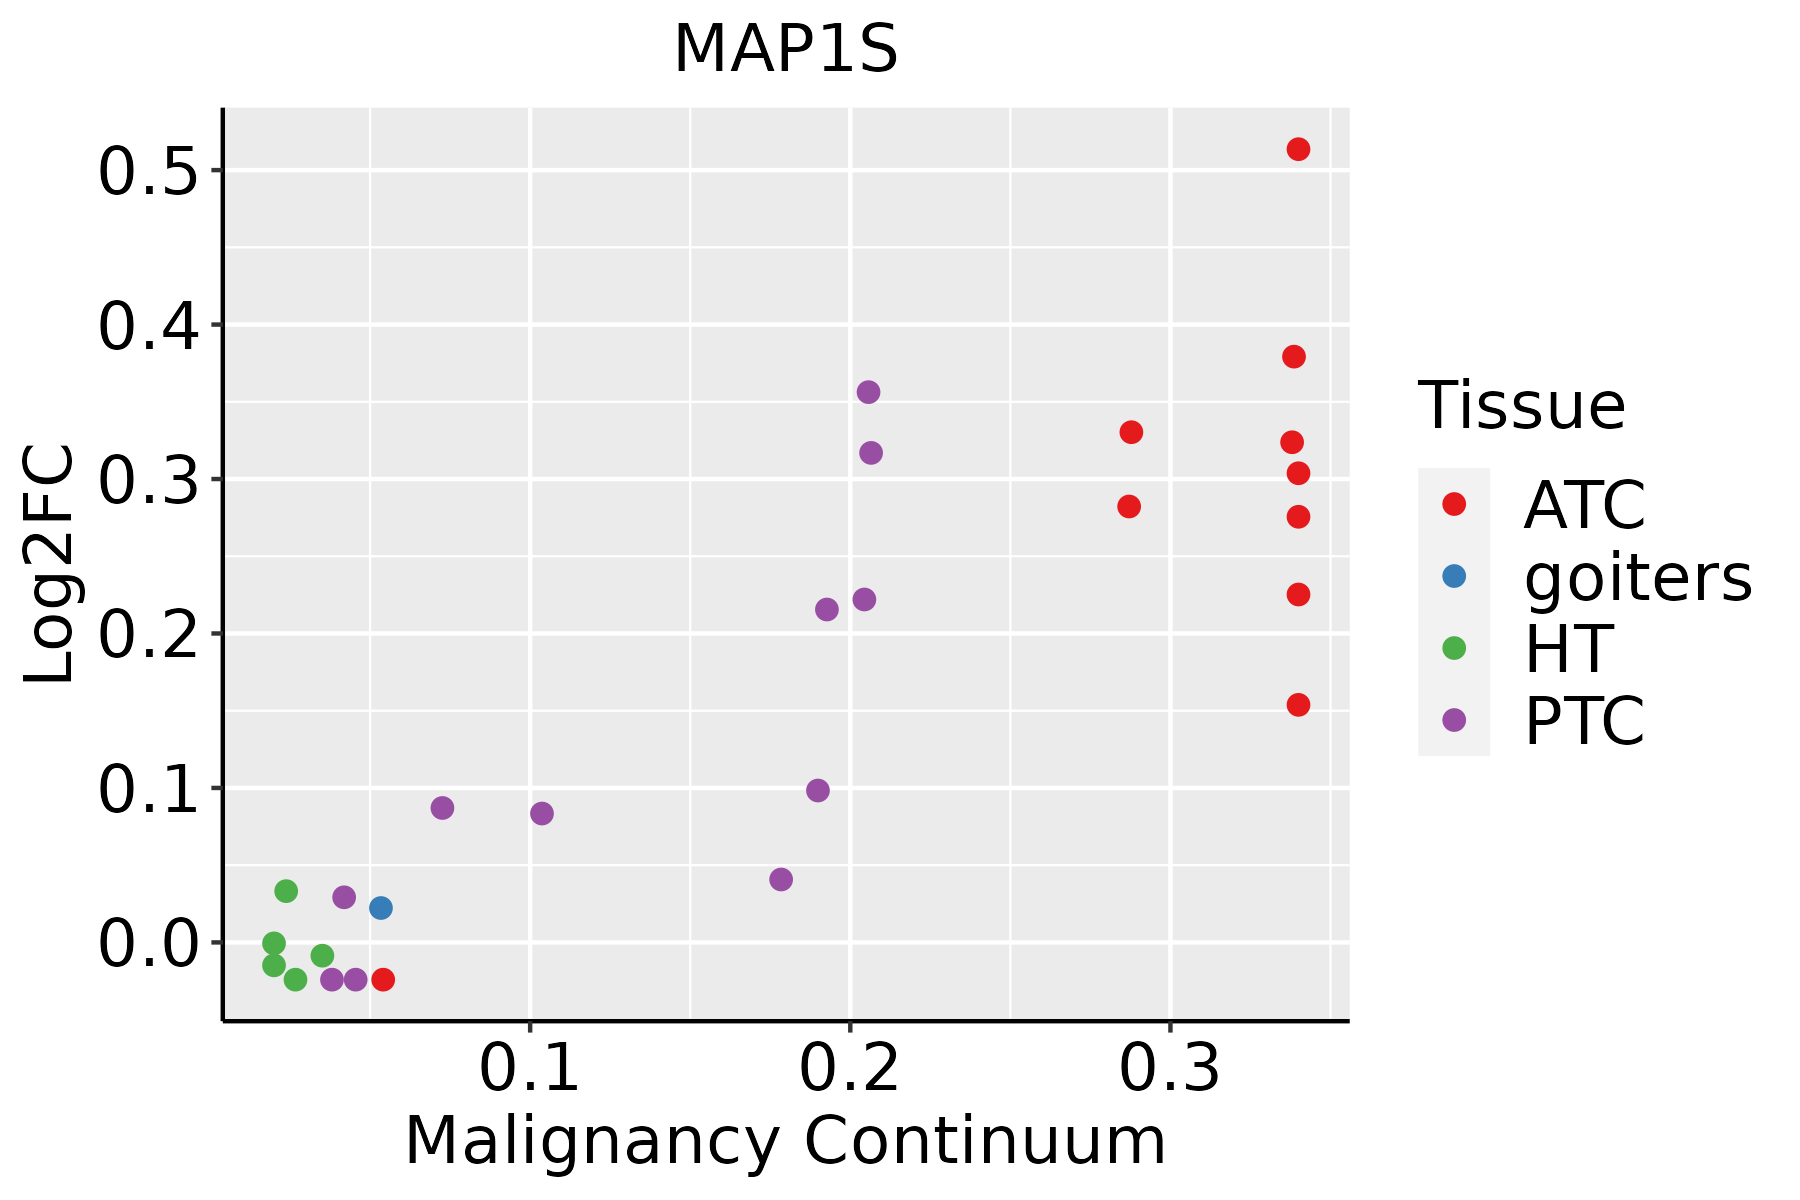 | ATC: Anaplastic thyroid cancer |
| HT: Hashimoto's thyroiditis | ||
| PTC: Papillary thyroid cancer |
| ∗log2FC in expression of this searched gene in stem-like cells from each diseased tissue sample relative to stem-like cells in normal samples in each tissue plotted against the malignancy continuum. Samples are colored based on if they are from different disease stage. |
Top |
Malignant transformation related pathway analysis |
| Find out the enriched GO biological processes and KEGG pathways involved in transition from healthy to precancer to cancer |
| Tissue | Disease Stage | Enriched GO biological Processes |
| Colorectum | AD |  |
| Colorectum | SER |  |
| Colorectum | MSS |  |
| Colorectum | MSI-H |  |
| Colorectum | FAP |  |
| ∗Top 15 enriched GO BP terms are showed in the bar plot of each disease state in each tissue. Each row represents a significant GO biological process which is colored according to the -log10(p.adjust). |
| Page: 1 2 3 4 5 6 7 8 9 |
| GO ID | Tissue | Disease Stage | Description | Gene Ratio | Bg Ratio | pvalue | p.adjust | Count |
| GO:0047497 | Liver | HCC | mitochondrion transport along microtubule | 18/7958 | 26/18723 | 5.37e-03 | 2.24e-02 | 18 |
| GO:00314983 | Liver | HCC | chromatin disassembly | 14/7958 | 20/18723 | 1.21e-02 | 4.41e-02 | 14 |
| GO:001635811 | Liver | HCC | dendrite development | 121/7958 | 243/18723 | 1.26e-02 | 4.56e-02 | 121 |
| GO:00436242 | Liver | HCC | cellular protein complex disassembly | 71/7958 | 136/18723 | 1.39e-02 | 4.95e-02 | 71 |
| GO:0022411113 | Thyroid | PTC | cellular component disassembly | 232/5968 | 443/18723 | 1.36e-19 | 1.75e-17 | 232 |
| GO:1902903113 | Thyroid | PTC | regulation of supramolecular fiber organization | 202/5968 | 383/18723 | 1.16e-17 | 1.15e-15 | 202 |
| GO:005165620 | Thyroid | PTC | establishment of organelle localization | 193/5968 | 390/18723 | 2.21e-13 | 1.15e-11 | 193 |
| GO:0030705111 | Thyroid | PTC | cytoskeleton-dependent intracellular transport | 104/5968 | 195/18723 | 3.87e-10 | 1.24e-08 | 104 |
| GO:0032984110 | Thyroid | PTC | protein-containing complex disassembly | 114/5968 | 224/18723 | 2.26e-09 | 6.33e-08 | 114 |
| GO:007050717 | Thyroid | PTC | regulation of microtubule cytoskeleton organization | 80/5968 | 148/18723 | 1.79e-08 | 4.19e-07 | 80 |
| GO:000632520 | Thyroid | PTC | chromatin organization | 183/5968 | 409/18723 | 2.55e-08 | 5.70e-07 | 183 |
| GO:00109709 | Thyroid | PTC | transport along microtubule | 80/5968 | 155/18723 | 2.48e-07 | 4.32e-06 | 80 |
| GO:001635819 | Thyroid | PTC | dendrite development | 115/5968 | 243/18723 | 3.16e-07 | 5.35e-06 | 115 |
| GO:006156419 | Thyroid | PTC | axon development | 199/5968 | 467/18723 | 5.27e-07 | 8.53e-06 | 199 |
| GO:000740918 | Thyroid | PTC | axonogenesis | 178/5968 | 418/18723 | 2.17e-06 | 2.91e-05 | 178 |
| GO:00723848 | Thyroid | PTC | organelle transport along microtubule | 47/5968 | 85/18723 | 6.61e-06 | 7.83e-05 | 47 |
| GO:00991115 | Thyroid | PTC | microtubule-based transport | 88/5968 | 190/18723 | 2.08e-05 | 2.08e-04 | 88 |
| GO:00328866 | Thyroid | PTC | regulation of microtubule-based process | 105/5968 | 240/18723 | 6.91e-05 | 6.03e-04 | 105 |
| GO:00436247 | Thyroid | PTC | cellular protein complex disassembly | 64/5968 | 136/18723 | 1.49e-04 | 1.15e-03 | 64 |
| GO:00311105 | Thyroid | PTC | regulation of microtubule polymerization or depolymerization | 44/5968 | 88/18723 | 3.00e-04 | 2.11e-03 | 44 |
| Page: 1 2 3 4 5 |
| Pathway ID | Tissue | Disease Stage | Description | Gene Ratio | Bg Ratio | pvalue | p.adjust | qvalue | Count |
| hsa032509 | Esophagus | ESCC | Viral life cycle - HIV-1 | 54/4205 | 63/8465 | 2.01e-09 | 2.17e-08 | 1.11e-08 | 54 |
| hsa0325014 | Esophagus | ESCC | Viral life cycle - HIV-1 | 54/4205 | 63/8465 | 2.01e-09 | 2.17e-08 | 1.11e-08 | 54 |
| hsa032502 | Liver | HCC | Viral life cycle - HIV-1 | 46/4020 | 63/8465 | 3.25e-05 | 1.88e-04 | 1.04e-04 | 46 |
| hsa0325011 | Liver | HCC | Viral life cycle - HIV-1 | 46/4020 | 63/8465 | 3.25e-05 | 1.88e-04 | 1.04e-04 | 46 |
| Page: 1 |
Top |
Cell-cell communication analysis |
| Identification of potential cell-cell interactions between two cell types and their ligand-receptor pairs for different disease states |
| Ligand | Receptor | LRpair | Pathway | Tissue | Disease Stage |
| Page: 1 |
Top |
Single-cell gene regulatory network inference analysis |
| Find out the significant the regulons (TFs) and the target genes of each regulon across cell types for different disease states |
| TF | Cell Type | Tissue | Disease Stage | Target Gene | RSS | Regulon Activity |
| ∗The dot plots of a searched regulon are shown for all cell subpopulations in each disease state of each tissue based on the regulon specific score inferred using pySCENIC and by calculating the average expression. |
| Page: 1 |
Top |
Somatic mutation of malignant transformation related genes |
| Annotation of somatic variants for genes involved in malignant transformation |
| Hugo Symbol | Variant Class | Variant Classification | dbSNP RS | HGVSc | HGVSp | HGVSp Short | SWISSPROT | BIOTYPE | SIFT | PolyPhen | Tumor Sample Barcode | Tissue | Histology | Sex | Age | Stage | Therapy Types | Drugs | Outcome |
| MAP1S | SNV | Missense_Mutation | rs371306436 | c.3073N>A | p.Ala1025Thr | p.A1025T | Q66K74 | protein_coding | deleterious(0.01) | benign(0.05) | TCGA-AO-A12A-01 | Breast | breast invasive carcinoma | Female | <65 | I/II | Chemotherapy | cyclophosphamide | SD |
| MAP1S | SNV | Missense_Mutation | c.2948A>G | p.Gln983Arg | p.Q983R | Q66K74 | protein_coding | tolerated(0.88) | benign(0.003) | TCGA-D8-A1J8-01 | Breast | breast invasive carcinoma | Female | >=65 | I/II | Hormone Therapy | nolvadex | SD | |
| MAP1S | insertion | Frame_Shift_Ins | novel | c.3041_3042insT | p.Asp1016ArgfsTer35 | p.D1016Rfs*35 | Q66K74 | protein_coding | TCGA-2W-A8YY-01 | Cervix | cervical & endocervical cancer | Female | <65 | I/II | Chemotherapy | cisplatin | CR | ||
| MAP1S | SNV | Missense_Mutation | novel | c.2983G>A | p.Ala995Thr | p.A995T | Q66K74 | protein_coding | deleterious(0) | possibly_damaging(0.794) | TCGA-5M-AAT6-01 | Colorectum | colon adenocarcinoma | Female | <65 | III/IV | Unknown | Unknown | PD |
| MAP1S | SNV | Missense_Mutation | c.1910N>A | p.Arg637His | p.R637H | Q66K74 | protein_coding | tolerated(0.14) | benign(0) | TCGA-A6-3809-01 | Colorectum | colon adenocarcinoma | Female | >=65 | I/II | Unknown | Unknown | SD | |
| MAP1S | SNV | Missense_Mutation | c.2345N>T | p.Thr782Met | p.T782M | Q66K74 | protein_coding | deleterious(0) | probably_damaging(0.993) | TCGA-A6-5661-01 | Colorectum | colon adenocarcinoma | Female | >=65 | I/II | Unknown | Unknown | SD | |
| MAP1S | SNV | Missense_Mutation | c.1369N>T | p.Pro457Ser | p.P457S | Q66K74 | protein_coding | deleterious(0.01) | possibly_damaging(0.82) | TCGA-A6-6780-01 | Colorectum | colon adenocarcinoma | Male | >=65 | I/II | Unknown | Unknown | SD | |
| MAP1S | SNV | Missense_Mutation | c.173N>G | p.Lys58Arg | p.K58R | Q66K74 | protein_coding | tolerated(0.1) | probably_damaging(0.929) | TCGA-AA-3710-01 | Colorectum | colon adenocarcinoma | Female | >=65 | I/II | Unknown | Unknown | SD | |
| MAP1S | SNV | Missense_Mutation | novel | c.1014C>A | p.Phe338Leu | p.F338L | Q66K74 | protein_coding | deleterious(0) | probably_damaging(0.996) | TCGA-AA-A010-01 | Colorectum | colon adenocarcinoma | Female | <65 | I/II | Chemotherapy | folinic | CR |
| MAP1S | SNV | Missense_Mutation | c.1523N>A | p.Arg508Gln | p.R508Q | Q66K74 | protein_coding | tolerated(0.34) | possibly_damaging(0.709) | TCGA-AD-6899-01 | Colorectum | colon adenocarcinoma | Male | >=65 | III/IV | Unknown | Unknown | SD |
| Page: 1 2 3 4 5 6 7 |
Top |
Related drugs of malignant transformation related genes |
| Identification of chemicals and drugs interact with genes involved in malignant transfromation |
| (DGIdb 4.0) |
| Entrez ID | Symbol | Category | Interaction Types | Drug Claim Name | Drug Name | PMIDs |
| Page: 1 |

Copyright 2023-Present -The University of Texas Health Science Center at Houston |