| Tissue | Expression Dynamics | Abbreviation |
| Endometrium | 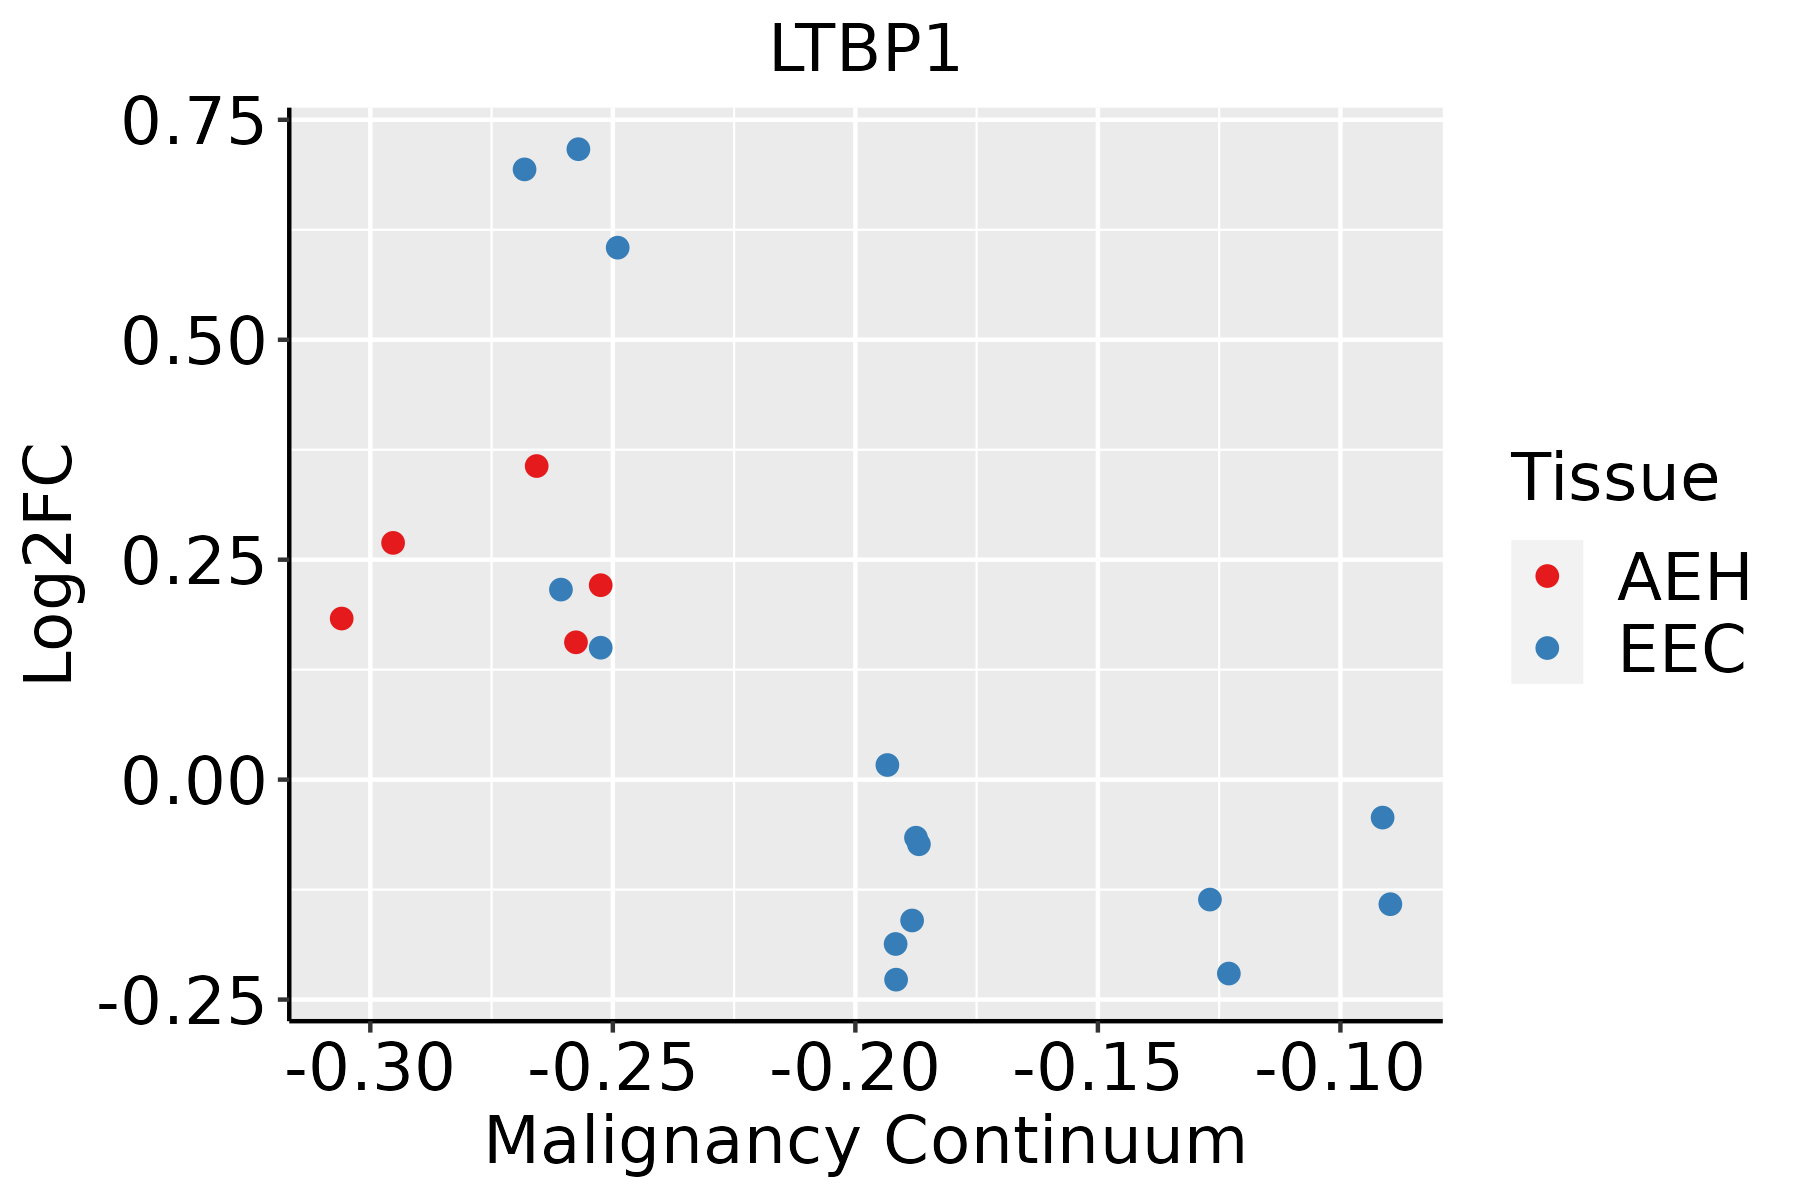 | AEH: Atypical endometrial hyperplasia |
| EEC: Endometrioid Cancer |
| Esophagus | 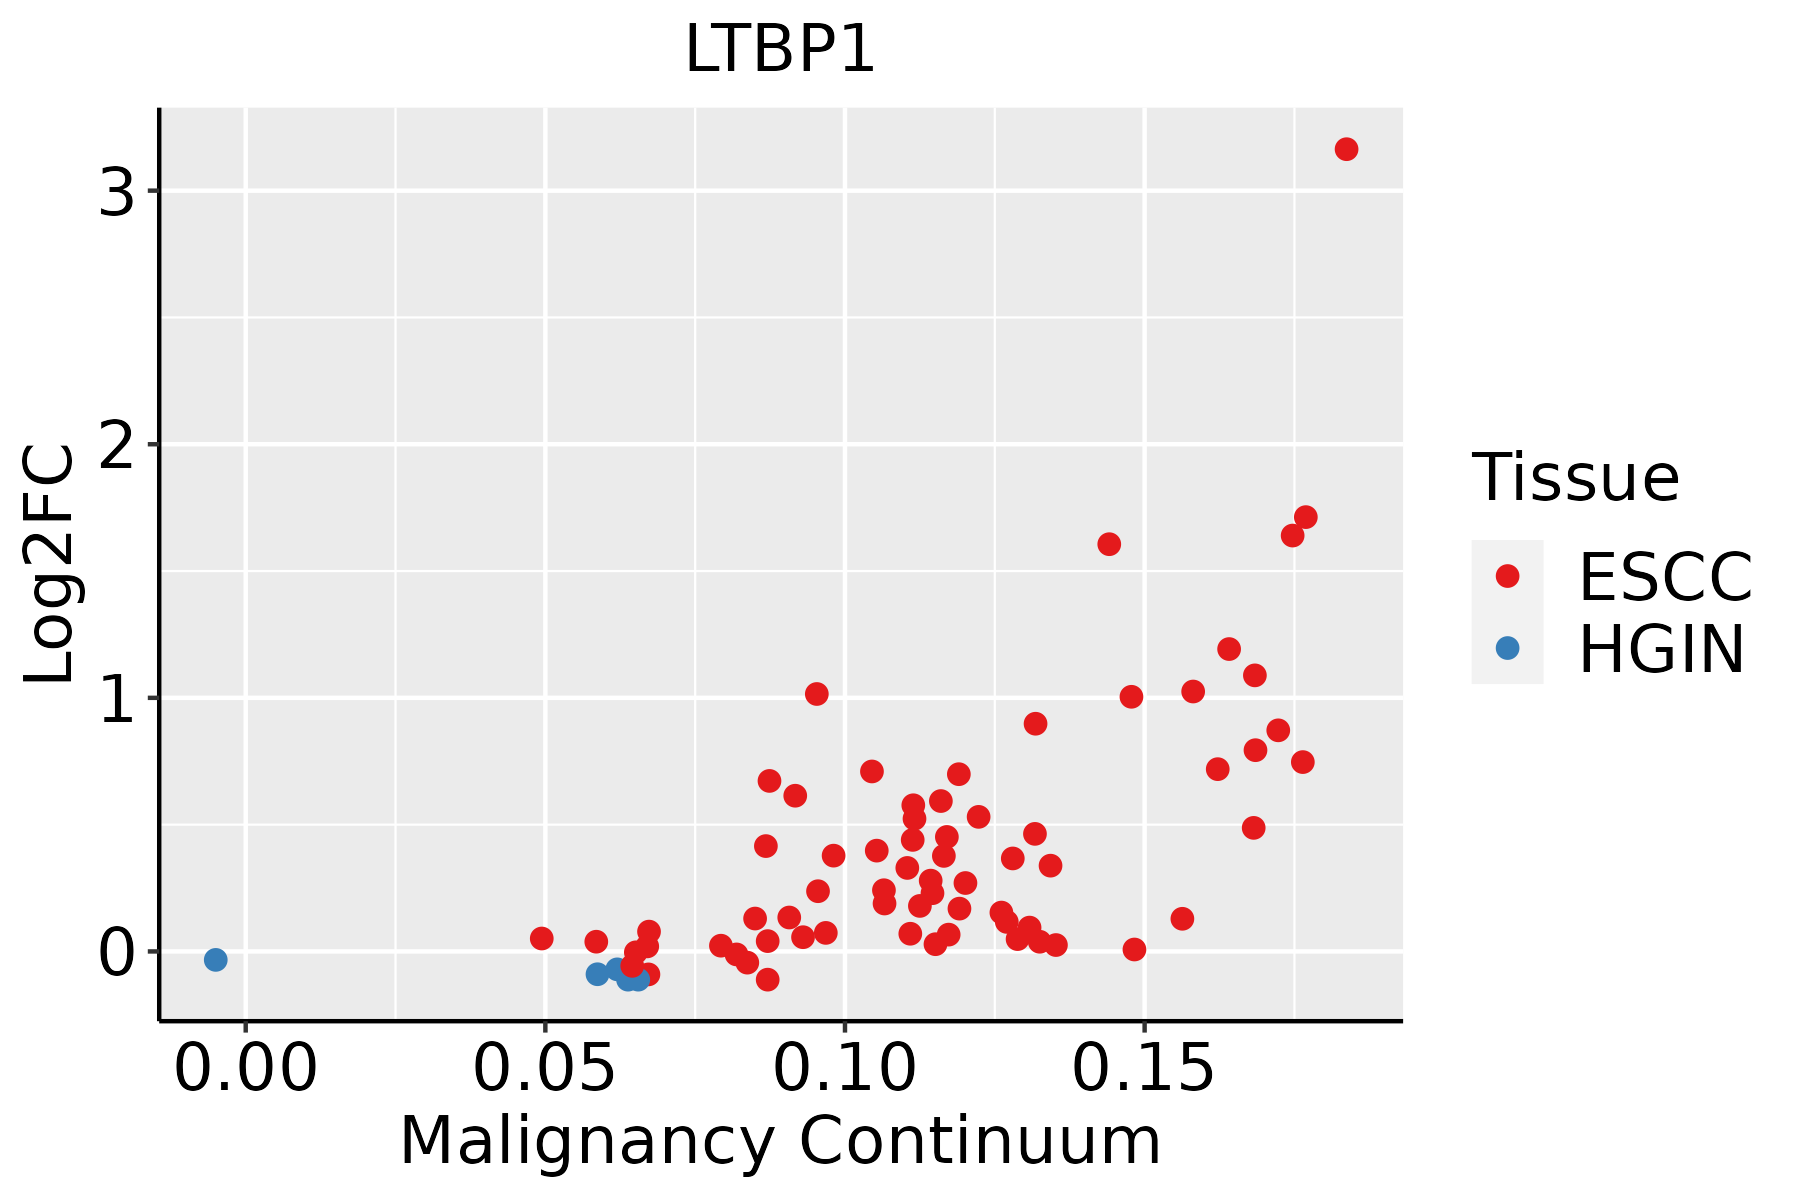 | ESCC: Esophageal squamous cell carcinoma |
| HGIN: High-grade intraepithelial neoplasias |
| LGIN: Low-grade intraepithelial neoplasias |
| Oral Cavity | 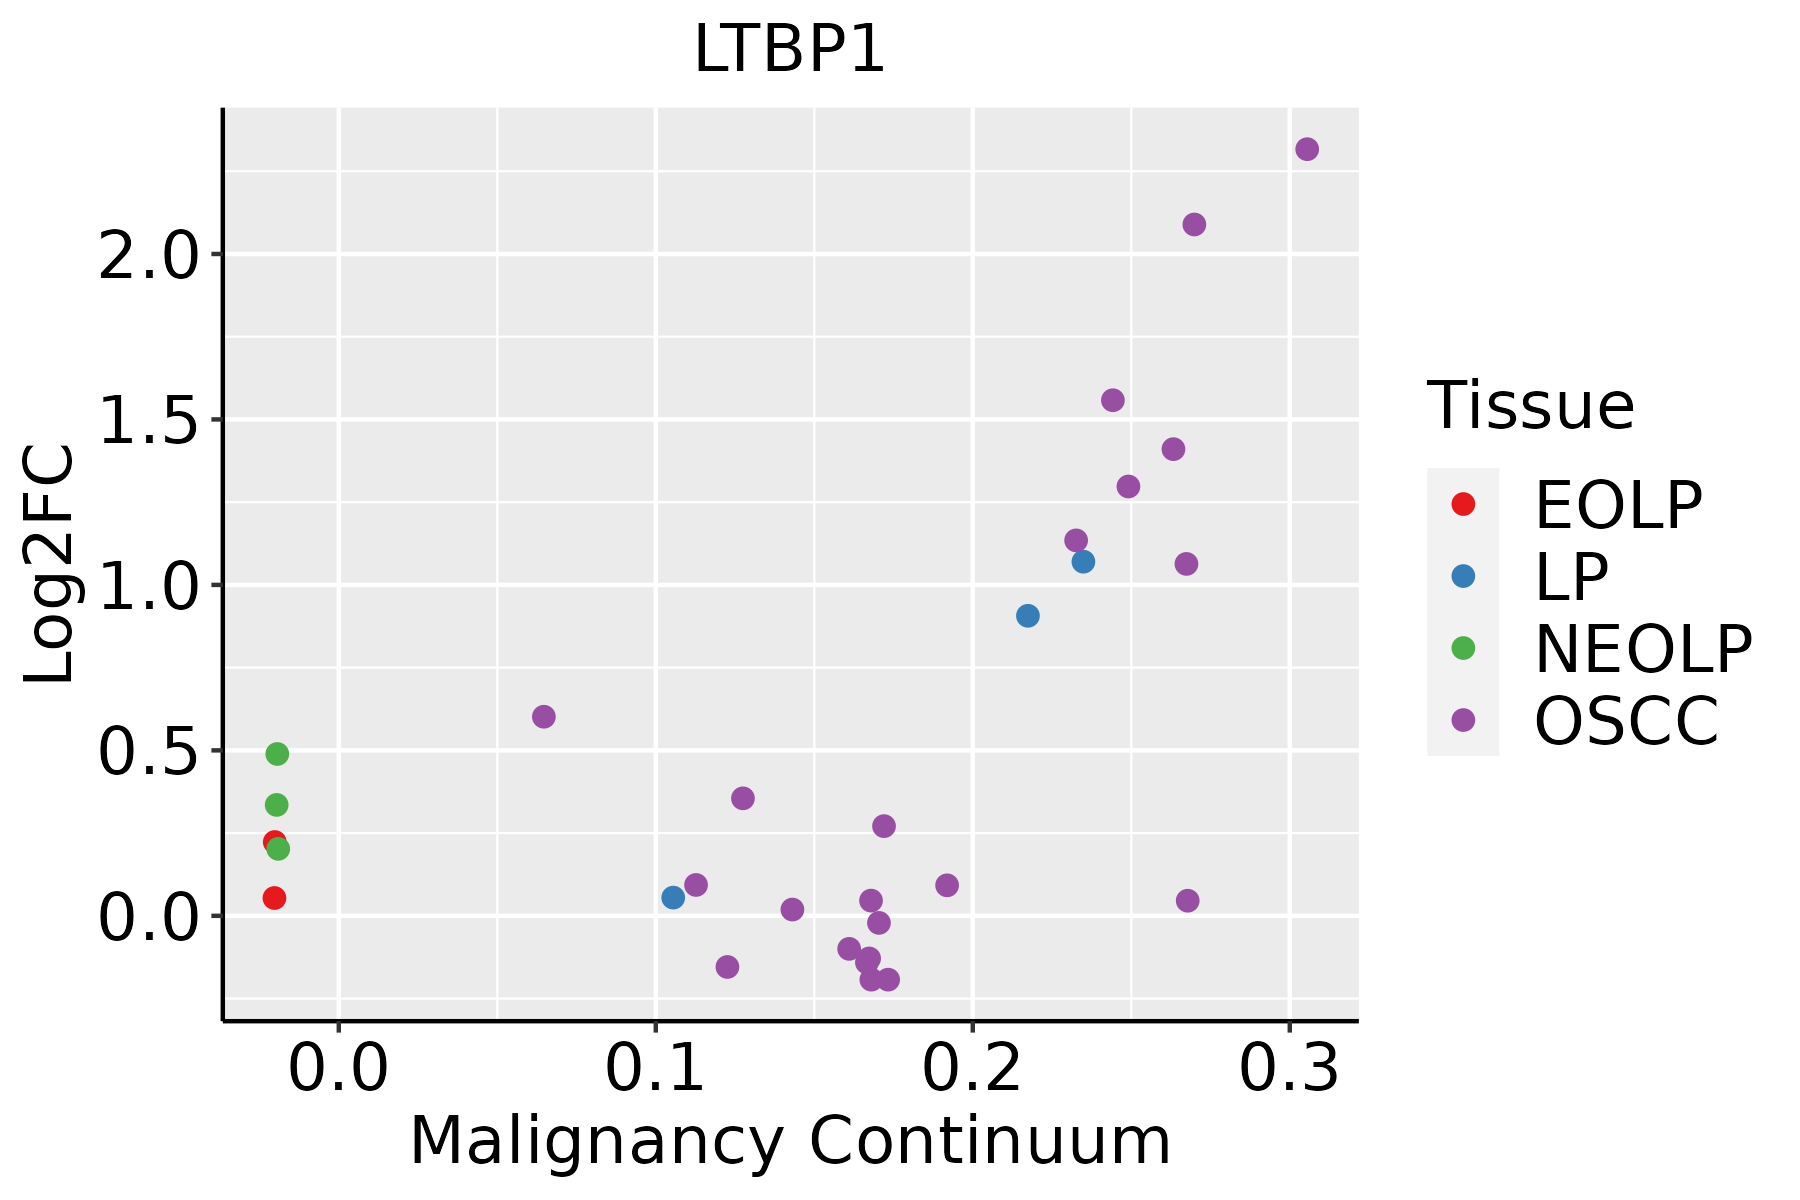 | EOLP: Erosive Oral lichen planus |
| LP: leukoplakia |
| NEOLP: Non-erosive oral lichen planus |
| OSCC: Oral squamous cell carcinoma |
| Prostate | 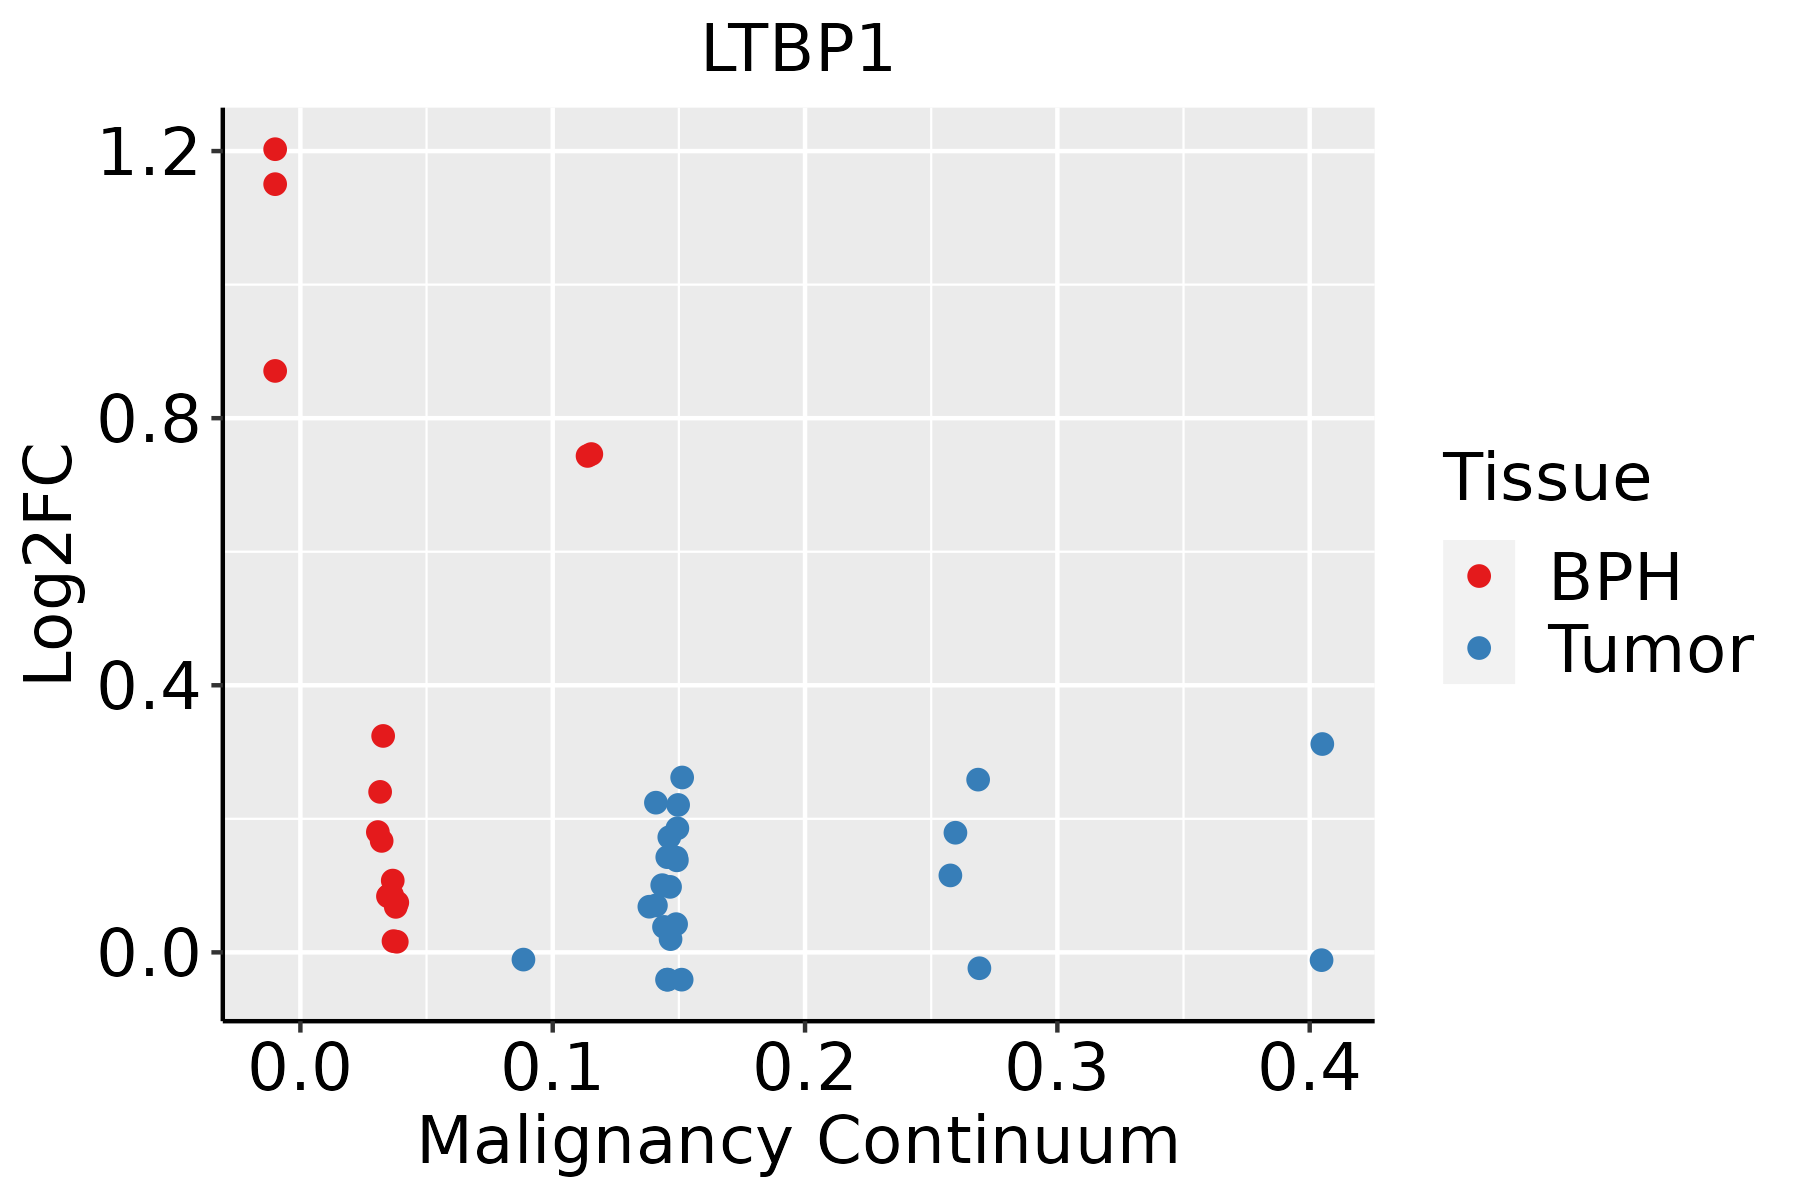 | BPH: Benign Prostatic Hyperplasia |
| Skin |  | AK: Actinic keratosis |
| cSCC: Cutaneous squamous cell carcinoma |
| SCCIS:squamous cell carcinoma in situ |
| Thyroid |  | ATC: Anaplastic thyroid cancer |
| HT: Hashimoto's thyroiditis |
| PTC: Papillary thyroid cancer |
| GO ID | Tissue | Disease Stage | Description | Gene Ratio | Bg Ratio | pvalue | p.adjust | Count |
| GO:000717923 | Oral cavity | NEOLP | transforming growth factor beta receptor signaling pathway | 48/2005 | 198/18723 | 4.01e-08 | 1.66e-06 | 48 |
| GO:000717822 | Oral cavity | NEOLP | transmembrane receptor protein serine/threonine kinase signaling pathway | 70/2005 | 355/18723 | 3.04e-07 | 9.62e-06 | 70 |
| GO:001701521 | Oral cavity | NEOLP | regulation of transforming growth factor beta receptor signaling pathway | 33/2005 | 128/18723 | 1.18e-06 | 3.08e-05 | 33 |
| GO:190384421 | Oral cavity | NEOLP | regulation of cellular response to transforming growth factor beta stimulus | 33/2005 | 131/18723 | 2.05e-06 | 4.86e-05 | 33 |
| GO:003051211 | Oral cavity | NEOLP | negative regulation of transforming growth factor beta receptor signaling pathway | 24/2005 | 81/18723 | 2.40e-06 | 5.53e-05 | 24 |
| GO:005123531 | Oral cavity | NEOLP | maintenance of location | 62/2005 | 327/18723 | 5.41e-06 | 1.12e-04 | 62 |
| GO:00901011 | Oral cavity | NEOLP | negative regulation of transmembrane receptor protein serine/threonine kinase signaling pathway | 32/2005 | 131/18723 | 5.88e-06 | 1.19e-04 | 32 |
| GO:004518531 | Oral cavity | NEOLP | maintenance of protein location | 25/2005 | 94/18723 | 1.25e-05 | 2.25e-04 | 25 |
| GO:009028711 | Oral cavity | NEOLP | regulation of cellular response to growth factor stimulus | 56/2005 | 304/18723 | 3.55e-05 | 5.20e-04 | 56 |
| GO:009009213 | Oral cavity | NEOLP | regulation of transmembrane receptor protein serine/threonine kinase signaling pathway | 49/2005 | 256/18723 | 3.90e-05 | 5.62e-04 | 49 |
| GO:007163431 | Oral cavity | NEOLP | regulation of transforming growth factor beta production | 14/2005 | 41/18723 | 5.34e-05 | 7.29e-04 | 14 |
| GO:007160431 | Oral cavity | NEOLP | transforming growth factor beta production | 14/2005 | 43/18723 | 9.66e-05 | 1.18e-03 | 14 |
| GO:00715597 | Prostate | BPH | response to transforming growth factor beta | 76/3107 | 256/18723 | 1.14e-07 | 2.73e-06 | 76 |
| GO:00715607 | Prostate | BPH | cellular response to transforming growth factor beta stimulus | 72/3107 | 250/18723 | 8.71e-07 | 1.61e-05 | 72 |
| GO:004518518 | Prostate | BPH | maintenance of protein location | 35/3107 | 94/18723 | 1.16e-06 | 2.07e-05 | 35 |
| GO:00071797 | Prostate | BPH | transforming growth factor beta receptor signaling pathway | 57/3107 | 198/18723 | 1.17e-05 | 1.58e-04 | 57 |
| GO:00071788 | Prostate | BPH | transmembrane receptor protein serine/threonine kinase signaling pathway | 90/3107 | 355/18723 | 1.48e-05 | 1.90e-04 | 90 |
| GO:005123516 | Prostate | BPH | maintenance of location | 80/3107 | 327/18723 | 1.55e-04 | 1.36e-03 | 80 |
| GO:00716345 | Prostate | BPH | regulation of transforming growth factor beta production | 16/3107 | 41/18723 | 5.01e-04 | 3.57e-03 | 16 |
| GO:19038445 | Prostate | BPH | regulation of cellular response to transforming growth factor beta stimulus | 37/3107 | 131/18723 | 5.57e-04 | 3.89e-03 | 37 |
| Pathway ID | Tissue | Disease Stage | Description | Gene Ratio | Bg Ratio | pvalue | p.adjust | qvalue | Count |
| hsa043504 | Endometrium | AEH | TGF-beta signaling pathway | 26/1197 | 108/8465 | 3.82e-03 | 2.18e-02 | 1.59e-02 | 26 |
| hsa0435011 | Endometrium | AEH | TGF-beta signaling pathway | 26/1197 | 108/8465 | 3.82e-03 | 2.18e-02 | 1.59e-02 | 26 |
| hsa043502 | Endometrium | EEC | TGF-beta signaling pathway | 26/1237 | 108/8465 | 5.95e-03 | 3.12e-02 | 2.33e-02 | 26 |
| hsa043503 | Endometrium | EEC | TGF-beta signaling pathway | 26/1237 | 108/8465 | 5.95e-03 | 3.12e-02 | 2.33e-02 | 26 |
| hsa043507 | Esophagus | ESCC | TGF-beta signaling pathway | 69/4205 | 108/8465 | 1.92e-03 | 5.54e-03 | 2.84e-03 | 69 |
| hsa0435014 | Esophagus | ESCC | TGF-beta signaling pathway | 69/4205 | 108/8465 | 1.92e-03 | 5.54e-03 | 2.84e-03 | 69 |
| hsa043506 | Oral cavity | OSCC | TGF-beta signaling pathway | 60/3704 | 108/8465 | 8.66e-03 | 1.97e-02 | 1.00e-02 | 60 |
| hsa0435013 | Oral cavity | OSCC | TGF-beta signaling pathway | 60/3704 | 108/8465 | 8.66e-03 | 1.97e-02 | 1.00e-02 | 60 |
| hsa0435041 | Oral cavity | NEOLP | TGF-beta signaling pathway | 28/1112 | 108/8465 | 2.46e-04 | 1.62e-03 | 1.02e-03 | 28 |
| hsa0435051 | Oral cavity | NEOLP | TGF-beta signaling pathway | 28/1112 | 108/8465 | 2.46e-04 | 1.62e-03 | 1.02e-03 | 28 |
| hsa043505 | Prostate | BPH | TGF-beta signaling pathway | 35/1718 | 108/8465 | 1.98e-03 | 7.92e-03 | 4.90e-03 | 35 |
| hsa0435012 | Prostate | BPH | TGF-beta signaling pathway | 35/1718 | 108/8465 | 1.98e-03 | 7.92e-03 | 4.90e-03 | 35 |
| hsa0435021 | Prostate | Tumor | TGF-beta signaling pathway | 39/1791 | 108/8465 | 2.33e-04 | 1.35e-03 | 8.39e-04 | 39 |
| hsa0435031 | Prostate | Tumor | TGF-beta signaling pathway | 39/1791 | 108/8465 | 2.33e-04 | 1.35e-03 | 8.39e-04 | 39 |
| Hugo Symbol | Variant Class | Variant Classification | dbSNP RS | HGVSc | HGVSp | HGVSp Short | SWISSPROT | BIOTYPE | SIFT | PolyPhen | Tumor Sample Barcode | Tissue | Histology | Sex | Age | Stage | Therapy Types | Drugs | Outcome |
| LTBP1 | SNV | Missense_Mutation | novel | c.4960G>C | p.Asp1654His | p.D1654H | Q14766 | protein_coding | deleterious(0) | probably_damaging(0.999) | TCGA-3C-AALI-01 | Breast | breast invasive carcinoma | Female | <65 | I/II | Unspecific | Poly E | Complete Response |
| LTBP1 | SNV | Missense_Mutation | | c.2086N>T | p.His696Tyr | p.H696Y | Q14766 | protein_coding | deleterious(0.01) | benign(0.366) | TCGA-A2-A0EY-01 | Breast | breast invasive carcinoma | Female | <65 | I/II | Chemotherapy | adriamycin | SD |
| LTBP1 | SNV | Missense_Mutation | | c.4876N>C | p.Gly1626Arg | p.G1626R | Q14766 | protein_coding | deleterious(0) | probably_damaging(1) | TCGA-A8-A076-01 | Breast | breast invasive carcinoma | Female | >=65 | I/II | Hormone Therapy | anastrozole | SD |
| LTBP1 | SNV | Missense_Mutation | | c.3138N>G | p.Asn1046Lys | p.N1046K | Q14766 | protein_coding | tolerated(0.88) | benign(0.003) | TCGA-A8-A07R-01 | Breast | breast invasive carcinoma | Female | >=65 | III/IV | Ancillary | zoledronic | SD |
| LTBP1 | SNV | Missense_Mutation | novel | c.2511N>T | p.Gln837His | p.Q837H | Q14766 | protein_coding | deleterious(0.02) | benign(0.025) | TCGA-AN-A046-01 | Breast | breast invasive carcinoma | Female | >=65 | I/II | Unknown | Unknown | SD |
| LTBP1 | SNV | Missense_Mutation | | c.2878G>C | p.Glu960Gln | p.E960Q | Q14766 | protein_coding | deleterious(0.02) | probably_damaging(0.959) | TCGA-AN-A0XW-01 | Breast | breast invasive carcinoma | Female | <65 | III/IV | Unknown | Unknown | SD |
| LTBP1 | SNV | Missense_Mutation | | c.3898G>A | p.Ala1300Thr | p.A1300T | Q14766 | protein_coding | deleterious(0) | probably_damaging(0.997) | TCGA-AO-A0JB-01 | Breast | breast invasive carcinoma | Female | <65 | III/IV | Chemotherapy | cyclophosphamide | SD |
| LTBP1 | SNV | Missense_Mutation | rs748096563 | c.3959A>G | p.Tyr1320Cys | p.Y1320C | Q14766 | protein_coding | deleterious(0) | probably_damaging(0.999) | TCGA-B6-A0RE-01 | Breast | breast invasive carcinoma | Female | <65 | I/II | Unknown | Unknown | SD |
| LTBP1 | SNV | Missense_Mutation | | c.3705N>G | p.Ile1235Met | p.I1235M | Q14766 | protein_coding | tolerated(0.2) | possibly_damaging(0.689) | TCGA-BH-A0BO-01 | Breast | breast invasive carcinoma | Female | <65 | I/II | Unknown | Unknown | SD |
| LTBP1 | SNV | Missense_Mutation | | c.2983N>G | p.Arg995Gly | p.R995G | Q14766 | protein_coding | deleterious(0.04) | benign(0.062) | TCGA-BH-A0DL-01 | Breast | breast invasive carcinoma | Female | <65 | I/II | Chemotherapy | cytoxan | CR |


