Schematic overview of the cellular and molecular mechanisms involved in the cancer progression, including the proposed cellular and molecular mechanisms in cancer cells trajectory. AT1: alveolar type 1 cells; AT2: alveolar type 2 cells; AAH: atypical adenomatous hyperplasia; AIS: adenocarcinoma in situ; MIA: minimally invasive adenocarcinoma; IA: invasive adenocarcinoma; EMT: epithelial-mesenchymal transition

Home

Download

Statistics

Help

Contact

Center for Computational Systems Medicine
leaf

Gene summary

leaf

Malignant transformation analysis

leaf

Malignant transformation related pathway analysis

leaf

Cell-cell communication analysis

leaf

Single-cell gene regulatory network inference analysis

leaf

Somatic mutation of malignant transformation related genes

leaf

Related drugs of malignant transformation related genes

Gene: KIF3B

Gene summary for KIF3B

check button Gene summary.

Gene informationSpeciesHuman
Gene symbol

KIF3B

Gene ID

9371

Gene namekinesin family member 3B
Gene AliasFLA8
Cytomap20q11.21
Gene Typeprotein-coding
GO ID

GO:0000226

UniProtAcc

O15066


Top

Malignant transformation analysis

check button Identification of the aberrant gene expression in precancerous and cancerous lesions by comparing the gene expression of stem-like cells in diseased tissues with normal stem cells
check button Malignant transformation involving gene list.
Entrez IDSymbolReplicatesSpeciesOrganTissueAdj P-valueLog2FCMalignancy
9371KIF3BHTA11_3410_2000001011HumanColorectumAD2.38e-021.68e-010.0155
9371KIF3BHTA11_1938_2000001011HumanColorectumAD7.23e-055.03e-01-0.0811
9371KIF3BHTA11_347_2000001011HumanColorectumAD6.04e-155.90e-01-0.1954
9371KIF3BHTA11_696_2000001011HumanColorectumAD6.16e-094.02e-01-0.1464
9371KIF3BHTA11_866_2000001011HumanColorectumAD1.36e-073.03e-01-0.1001
9371KIF3BHTA11_1391_2000001011HumanColorectumAD2.54e-076.20e-01-0.059
9371KIF3BHTA11_546_2000001011HumanColorectumAD1.66e-024.04e-01-0.0842
9371KIF3BHTA11_7663_2000001011HumanColorectumSER4.54e-036.01e-010.0131
9371KIF3BHTA11_7696_3000711011HumanColorectumAD3.86e-113.92e-010.0674
9371KIF3BHTA11_99999965104_69814HumanColorectumMSS4.89e-023.72e-010.281
9371KIF3BHTA11_99999971662_82457HumanColorectumMSS1.04e-401.12e+000.3859
9371KIF3BHTA11_99999973899_84307HumanColorectumMSS4.26e-066.91e-010.2585
9371KIF3BHTA11_99999974143_84620HumanColorectumMSS1.25e-032.59e-010.3005
9371KIF3BA002-C-205HumanColorectumFAP8.21e-031.15e-01-0.1236
9371KIF3BA015-C-104HumanColorectumFAP1.66e-026.78e-03-0.1899
9371KIF3BA002-C-116HumanColorectumFAP1.00e-024.09e-03-0.0452
9371KIF3BCRC-3-11773HumanColorectumCRC4.91e-084.84e-010.2564
9371KIF3BLZE4THumanEsophagusESCC2.50e-082.01e-010.0811
9371KIF3BLZE20THumanEsophagusESCC3.97e-025.39e-020.0662
9371KIF3BLZE24THumanEsophagusESCC1.33e-217.32e-010.0596
Page: 1 2 3 4 5 6 7 

check button Transcriptomic changes along malignancy continuum.
TissueExpression DynamicsAbbreviation
Colorectum (GSE201348)The image shows the transcriptomic changes along malignancy continuum.log2FC in expression of this searched gene in stem-like cells from each diseased tissue sample relative to stem-like cells in normal samples in each tissue plotted against the malignancy continuum. Samples are colored based on if they are from different disease stage.FAP: Familial adenomatous polyposis
CRC: Colorectal cancer
Colorectum (HTA11)The image shows the transcriptomic changes along malignancy continuum.log2FC in expression of this searched gene in stem-like cells from each diseased tissue sample relative to stem-like cells in normal samples in each tissue plotted against the malignancy continuum. Samples are colored based on if they are from different disease stage.AD: Adenomas
SER: Sessile serrated lesions
MSI-H: Microsatellite-high colorectal cancer
MSS: Microsatellite stable colorectal cancer
EsophagusThe image shows the transcriptomic changes along malignancy continuum.log2FC in expression of this searched gene in stem-like cells from each diseased tissue sample relative to stem-like cells in normal samples in each tissue plotted against the malignancy continuum. Samples are colored based on if they are from different disease stage.ESCC: Esophageal squamous cell carcinoma
HGIN: High-grade intraepithelial neoplasias
LGIN: Low-grade intraepithelial neoplasias
LiverThe image shows the transcriptomic changes along malignancy continuum.log2FC in expression of this searched gene in stem-like cells from each diseased tissue sample relative to stem-like cells in normal samples in each tissue plotted against the malignancy continuum. Samples are colored based on if they are from different disease stage.
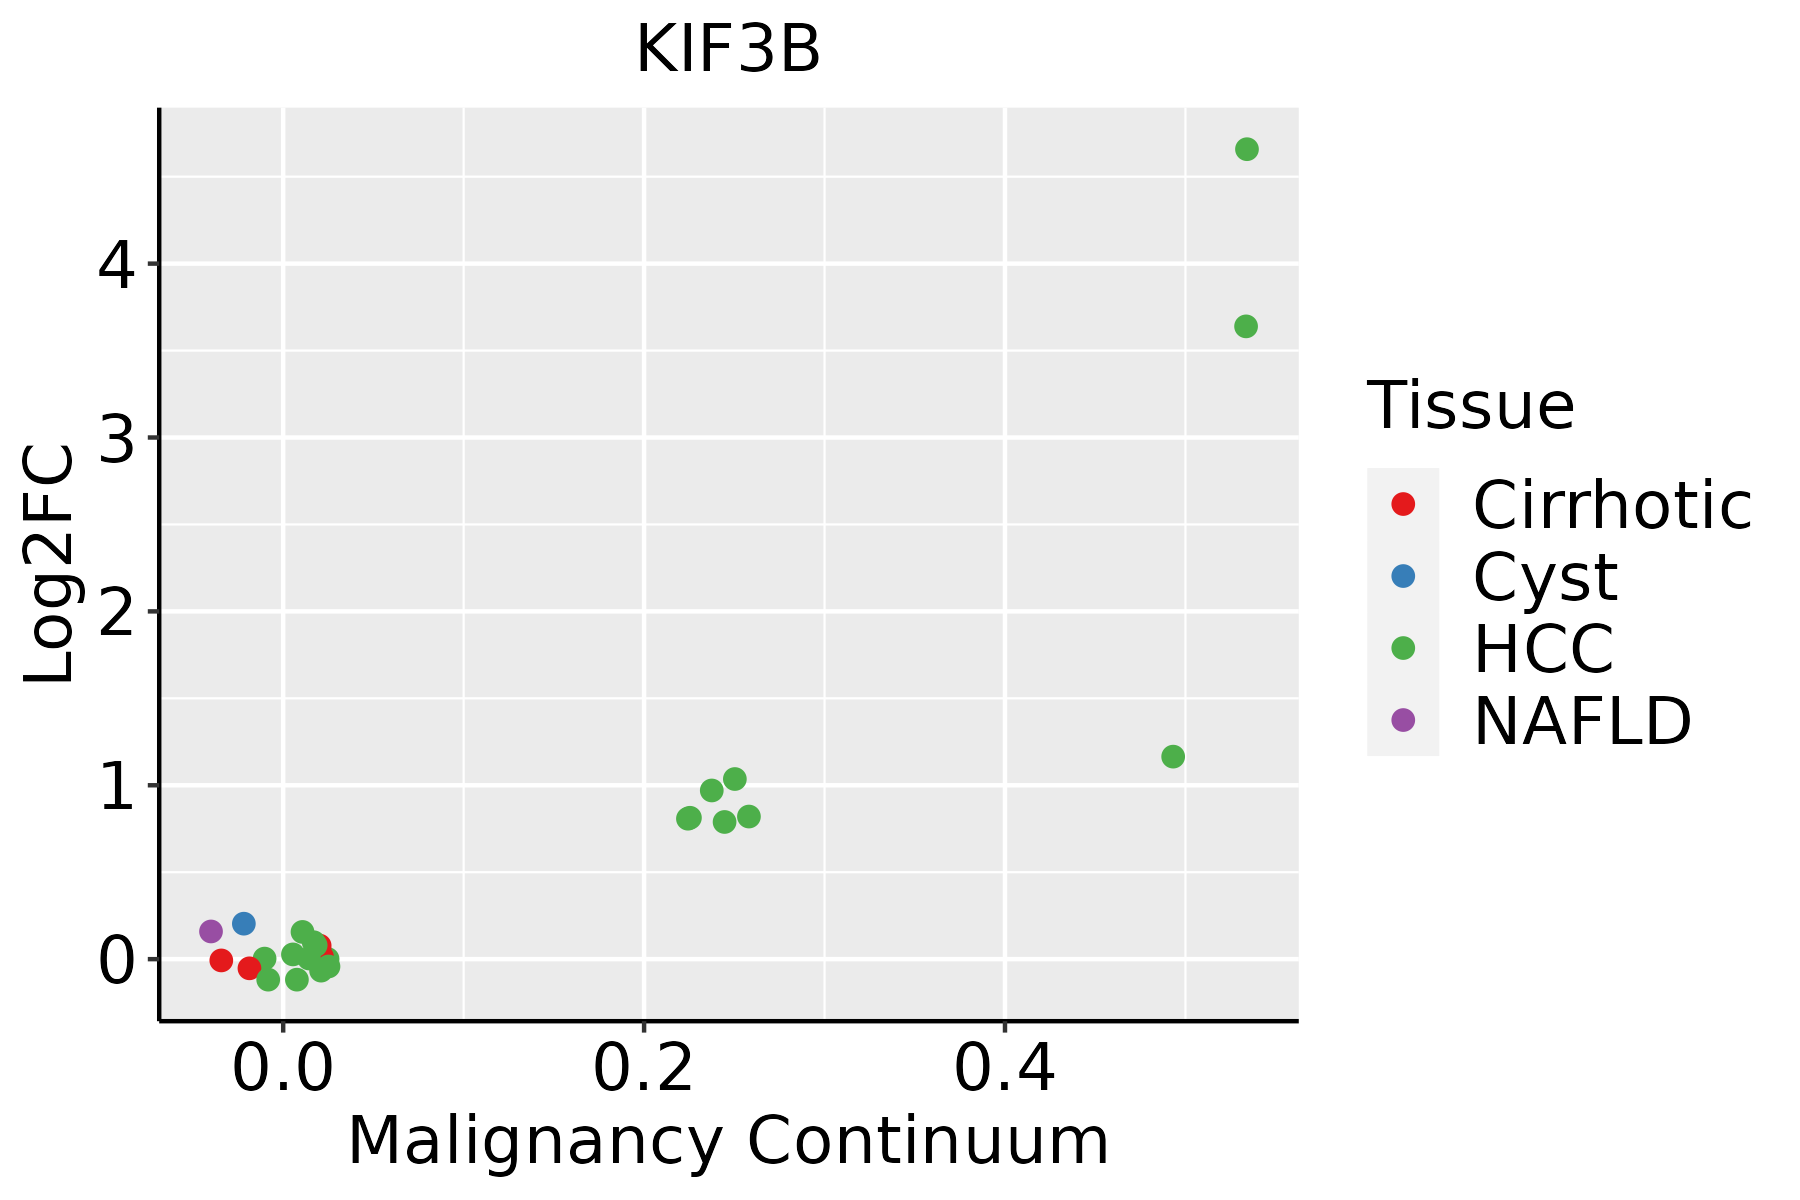
HCC: Hepatocellular carcinoma
NAFLD: Non-alcoholic fatty liver disease
Oral CavityThe image shows the transcriptomic changes along malignancy continuum.log2FC in expression of this searched gene in stem-like cells from each diseased tissue sample relative to stem-like cells in normal samples in each tissue plotted against the malignancy continuum. Samples are colored based on if they are from different disease stage.
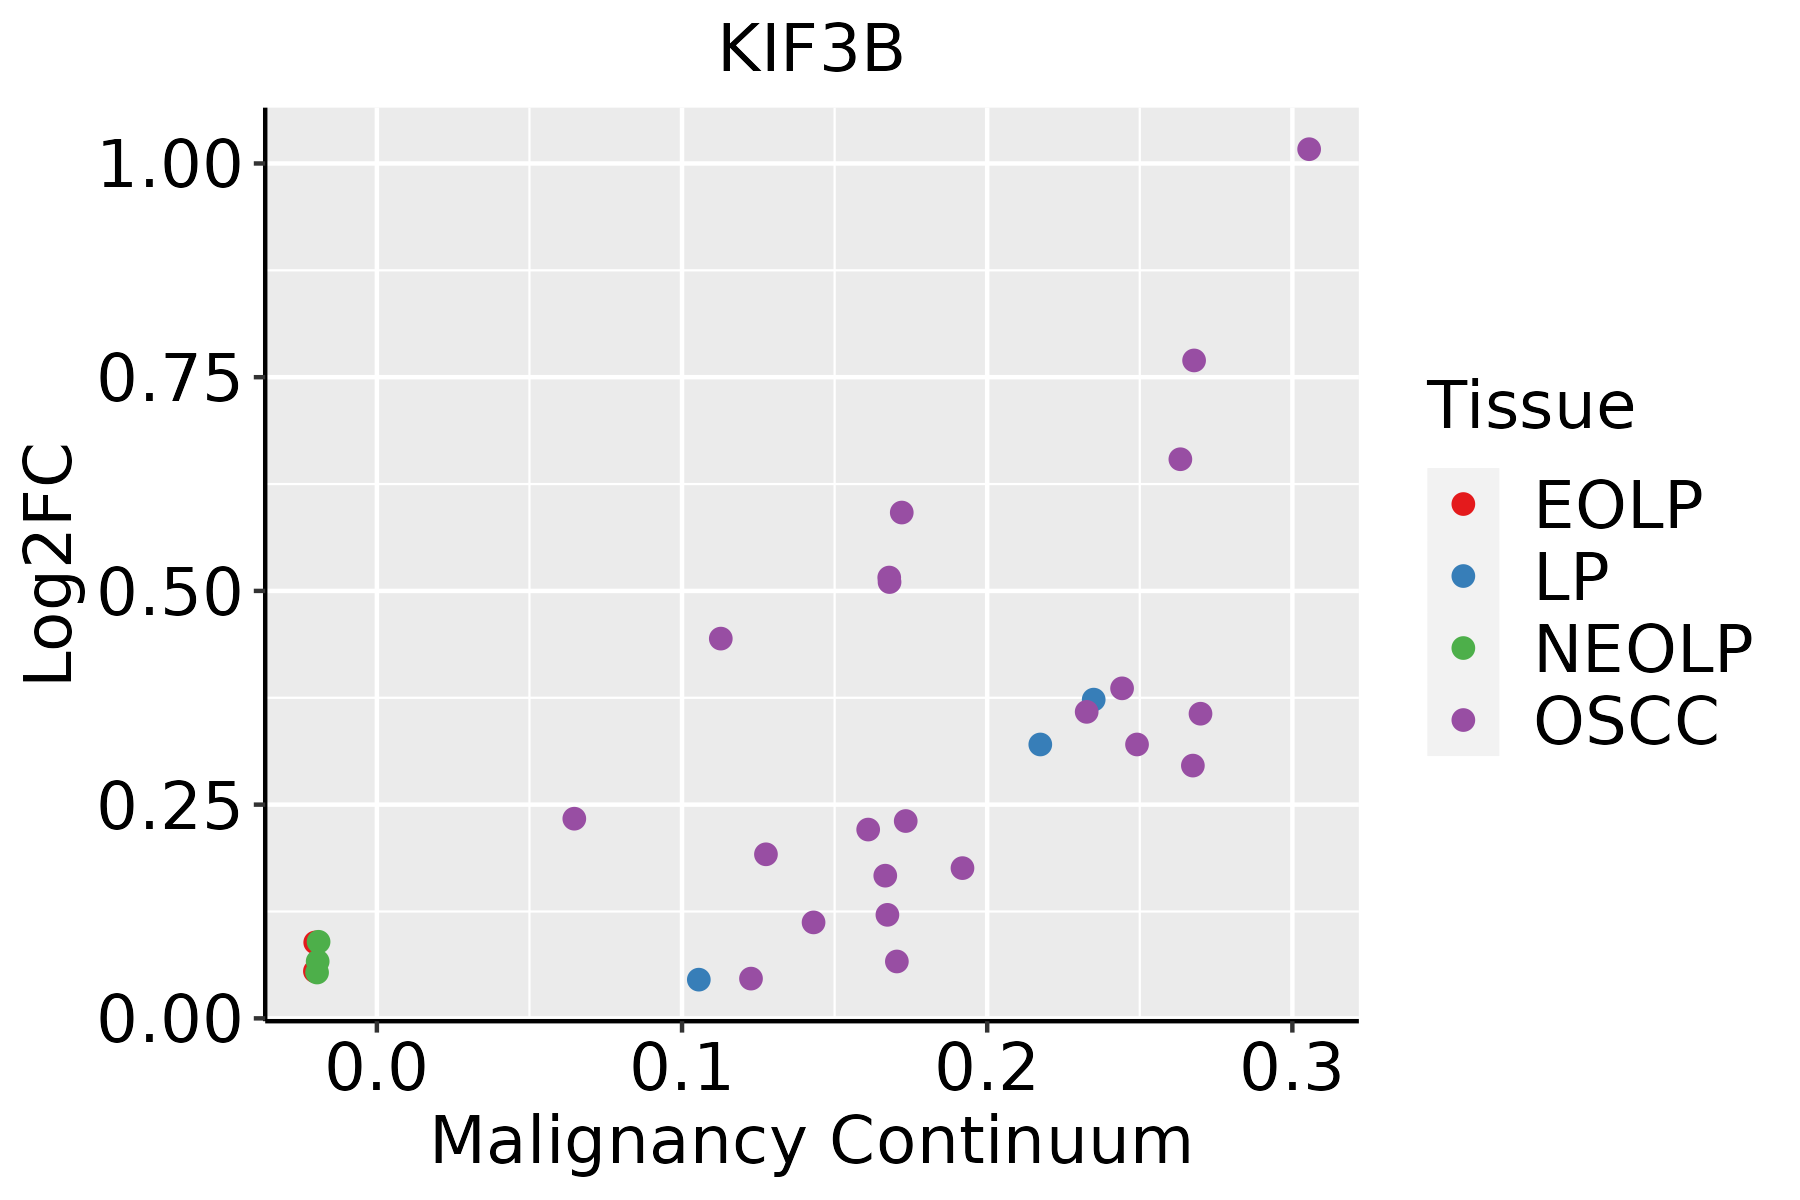
EOLP: Erosive Oral lichen planus
LP: leukoplakia
NEOLP: Non-erosive oral lichen planus
OSCC: Oral squamous cell carcinoma
ProstateThe image shows the transcriptomic changes along malignancy continuum.log2FC in expression of this searched gene in stem-like cells from each diseased tissue sample relative to stem-like cells in normal samples in each tissue plotted against the malignancy continuum. Samples are colored based on if they are from different disease stage.BPH: Benign Prostatic Hyperplasia
ThyroidThe image shows the transcriptomic changes along malignancy continuum.log2FC in expression of this searched gene in stem-like cells from each diseased tissue sample relative to stem-like cells in normal samples in each tissue plotted against the malignancy continuum. Samples are colored based on if they are from different disease stage.
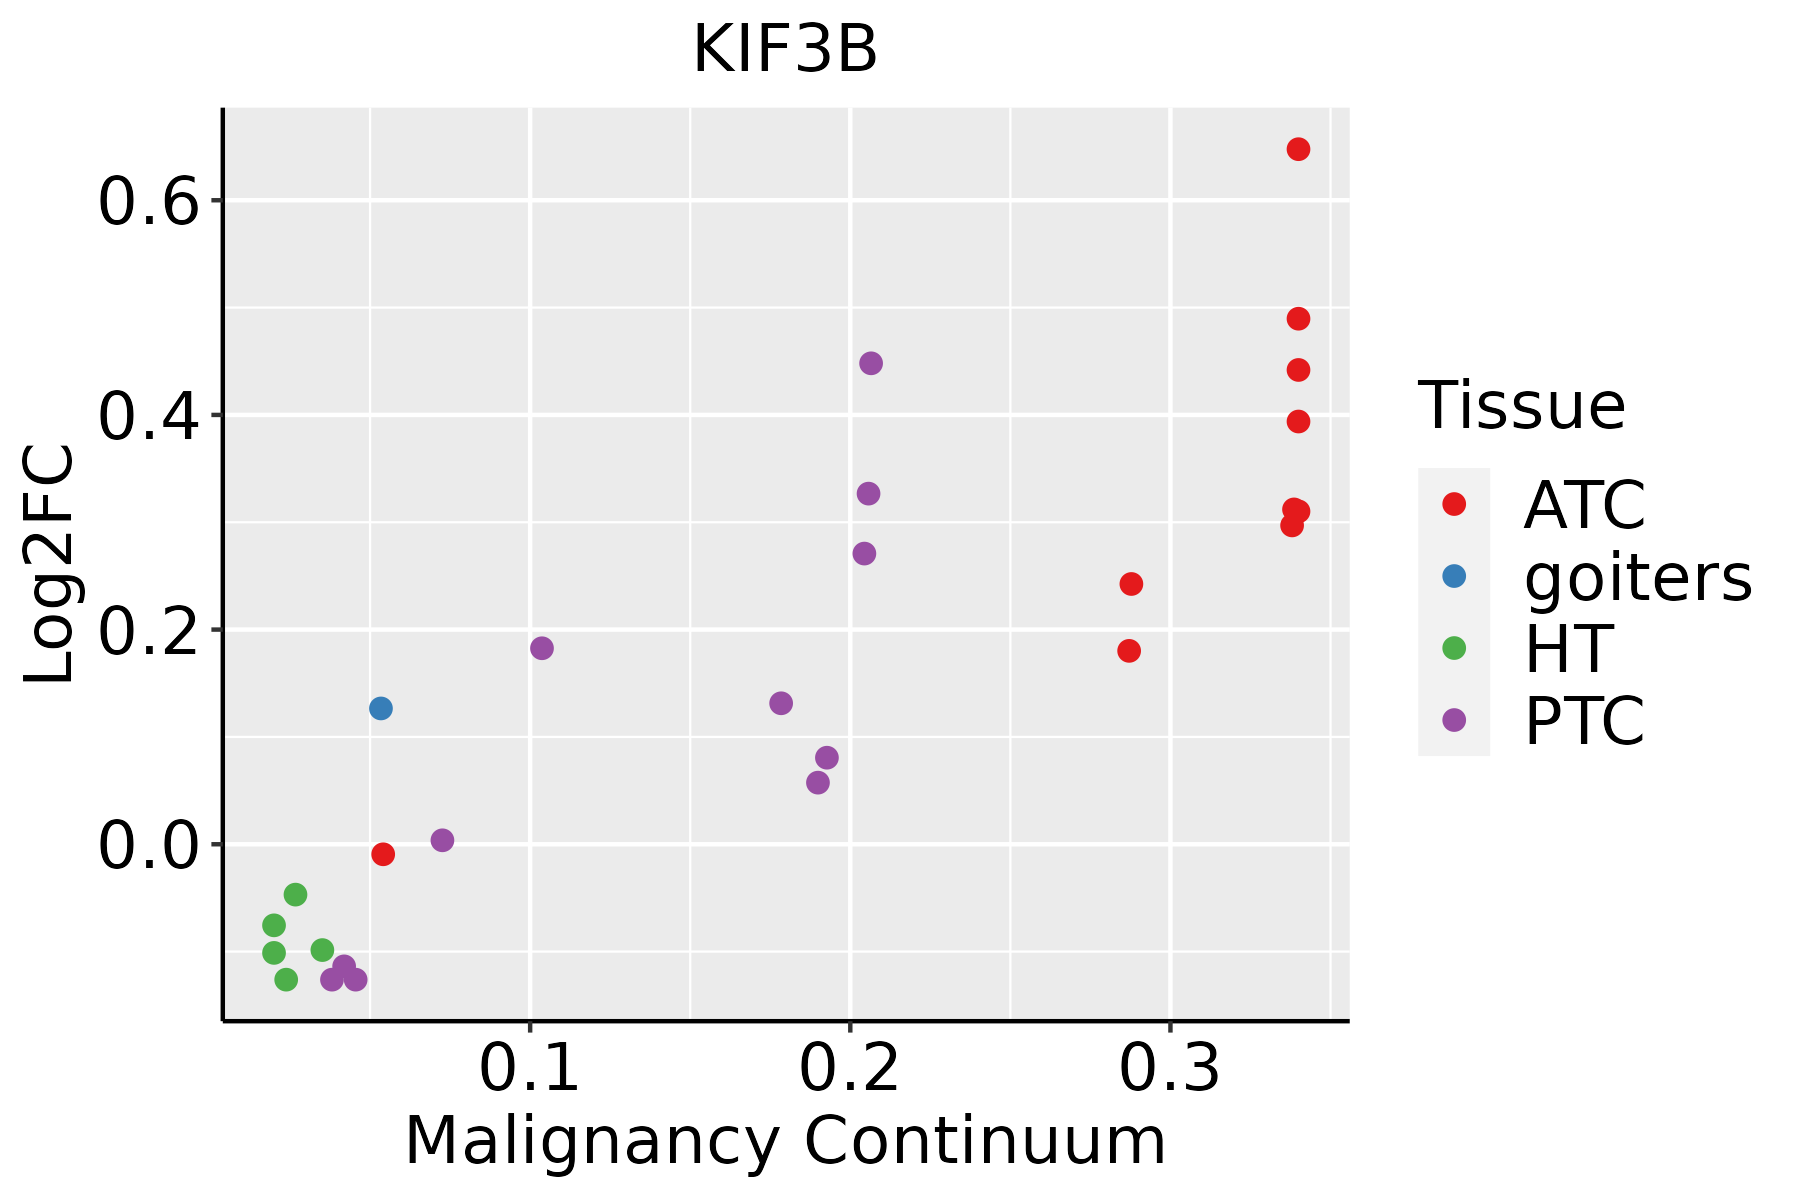
ATC: Anaplastic thyroid cancer
HT: Hashimoto's thyroiditis
PTC: Papillary thyroid cancer
∗log2FC in expression of this searched gene in stem-like cells from each diseased tissue sample relative to stem-like cells in normal samples in each tissue plotted against the malignancy continuum. Samples are colored based on if they are from different disease stage.

Top

Malignant transformation related pathway analysis

check buttonFind out the enriched GO biological processes and KEGG pathways involved in transition from healthy to precancer to cancer
check button Figure of enriched GO biological processes.
TissueDisease StageEnriched GO biological Processes
ColorectumADGO analysis - Figure of enriched GO biological processes: Top 15 enriched GO BP terms are showed in the bar plot of each disease state in each tissue. Each row represents a significant GO biological process which is colored according to the -log10(p.adjust).
ColorectumSERGO analysis - Figure of enriched GO biological processes: Top 15 enriched GO BP terms are showed in the bar plot of each disease state in each tissue. Each row represents a significant GO biological process which is colored according to the -log10(p.adjust).
ColorectumMSSGO analysis - Figure of enriched GO biological processes: Top 15 enriched GO BP terms are showed in the bar plot of each disease state in each tissue. Each row represents a significant GO biological process which is colored according to the -log10(p.adjust).
ColorectumMSI-HGO analysis - Figure of enriched GO biological processes: Top 15 enriched GO BP terms are showed in the bar plot of each disease state in each tissue. Each row represents a significant GO biological process which is colored according to the -log10(p.adjust).
ColorectumFAPGO analysis - Figure of enriched GO biological processes: Top 15 enriched GO BP terms are showed in the bar plot of each disease state in each tissue. Each row represents a significant GO biological process which is colored according to the -log10(p.adjust).
∗Top 15 enriched GO BP terms are showed in the bar plot of each disease state in each tissue. Each row represents a significant GO biological process which is colored according to the -log10(p.adjust).
Page: 1 2 3 4 5 6 7 8 9 

check button Enriched GO biological processes.
GO IDTissueDisease StageDescriptionGene RatioBg Ratiopvaluep.adjustCount
GO:00009103ColorectumFAPcytokinesis37/2622173/187235.10e-033.37e-0237
GO:0008088ColorectumFAPaxo-dendritic transport19/262275/187236.44e-034.01e-0219
GO:00516564ColorectumCRCestablishment of organelle localization76/2078390/187236.53e-074.50e-0576
GO:00307054ColorectumCRCcytoskeleton-dependent intracellular transport45/2078195/187231.29e-067.21e-0545
GO:00516504ColorectumCRCestablishment of vesicle localization39/2078161/187231.82e-069.07e-0539
GO:00516484ColorectumCRCvesicle localization41/2078177/187233.39e-061.50e-0441
GO:00995181ColorectumCRCvesicle cytoskeletal trafficking21/207873/187232.87e-057.61e-0421
GO:00457873ColorectumCRCpositive regulation of cell cycle55/2078313/187233.76e-045.57e-0355
GO:00009104ColorectumCRCcytokinesis34/2078173/187236.47e-048.55e-0334
GO:00903072ColorectumCRCmitotic spindle assembly16/207865/187231.62e-031.69e-0216
GO:0010970ColorectumCRCtransport along microtubule30/2078155/187231.67e-031.73e-0230
GO:00723842ColorectumCRCorganelle transport along microtubule19/207885/187232.12e-032.09e-0219
GO:00080881ColorectumCRCaxo-dendritic transport17/207875/187233.04e-032.71e-0217
GO:00070513ColorectumCRCspindle organization32/2078184/187236.70e-034.77e-0232
GO:00900682ColorectumCRCpositive regulation of cell cycle process39/2078236/187237.23e-034.98e-0239
GO:014001414EsophagusESCCmitotic nuclear division218/8552287/187236.17e-261.78e-23218
GO:005165617EsophagusESCCestablishment of organelle localization273/8552390/187239.13e-231.81e-20273
GO:190285015EsophagusESCCmicrotubule cytoskeleton organization involved in mitosis116/8552147/187231.25e-169.91e-15116
GO:000705214EsophagusESCCmitotic spindle organization97/8552120/187232.17e-151.33e-1397
GO:000705114EsophagusESCCspindle organization134/8552184/187235.70e-142.87e-12134
Page: 1 2 3 4 5 6 7 8 9 10 11 12 

check button Enriched KEGG pathways.
Pathway IDTissueDisease StageDescriptionGene RatioBg Ratiopvaluep.adjustqvalueCount
Page: 1 

Top

Cell-cell communication analysis

check buttonIdentification of potential cell-cell interactions between two cell types and their ligand-receptor pairs for different disease states
LigandReceptorLRpairPathwayTissueDisease Stage
Page: 1 

Top

Single-cell gene regulatory network inference analysis

check buttonFind out the significant the regulons (TFs) and the target genes of each regulon across cell types for different disease states
TFCell TypeTissueDisease StageTarget GeneRSSRegulon Activity
∗The dot plots of a searched regulon are shown for all cell subpopulations in each disease state of each tissue based on the regulon specific score inferred using pySCENIC and by calculating the average expression.
Page: 1 

Top

Somatic mutation of malignant transformation related genes

check buttonAnnotation of somatic variants for genes involved in malignant transformation
Hugo SymbolVariant ClassVariant ClassificationdbSNP RSHGVScHGVSpHGVSp ShortSWISSPROTBIOTYPESIFTPolyPhenTumor Sample BarcodeTissueHistologySexAgeStageTherapy TypesDrugsOutcome
KIF3BSNVMissense_Mutationc.1484N>Tp.Lys495Ilep.K495IO15066protein_codingdeleterious(0)possibly_damaging(0.514)TCGA-A7-A13D-01Breastbreast invasive carcinomaFemale<65I/IIChemotherapycytoxanSD
KIF3BSNVMissense_Mutationc.1579T>Cp.Tyr527Hisp.Y527HO15066protein_codingtolerated(0.07)probably_damaging(0.947)TCGA-AO-A128-01Breastbreast invasive carcinomaFemale<65I/IIChemotherapydoxorubicinSD
KIF3BSNVMissense_Mutationnovelc.122N>Gp.Val41Glyp.V41GO15066protein_codingdeleterious(0)probably_damaging(0.99)TCGA-BH-A1F8-01Breastbreast invasive carcinomaFemale>=65III/IVUnknownUnknownPD
KIF3BSNVMissense_Mutationnovelc.1367A>Gp.Glu456Glyp.E456GO15066protein_codingdeleterious(0)possibly_damaging(0.71)TCGA-C8-A273-01Breastbreast invasive carcinomaFemale<65I/IIHormone TherapytamoxiphenSD
KIF3BinsertionNonsense_Mutationnovelc.2191_2192insATCATTp.Gly731delinsAspHisTerp.G731delinsDH*O15066protein_codingTCGA-AR-A0TY-01Breastbreast invasive carcinomaFemale<65I/IIUnspecificPaclitaxelPD
KIF3BinsertionIn_Frame_Insnovelc.2192_2193insGAAACTACATCCTATp.Gly731_Thr732insLysLeuHisProIlep.G731_T732insKLHPIO15066protein_codingTCGA-AR-A0TY-01Breastbreast invasive carcinomaFemale<65I/IIUnspecificPaclitaxelPD
KIF3BSNVMissense_Mutationnovelc.952N>Ap.Gly318Argp.G318RO15066protein_codingdeleterious(0)probably_damaging(1)TCGA-2W-A8YY-01Cervixcervical & endocervical cancerFemale<65I/IIChemotherapycisplatinCR
KIF3BSNVMissense_Mutationc.646N>Gp.His216Aspp.H216DO15066protein_codingdeleterious(0)probably_damaging(1)TCGA-BI-A0VR-01Cervixcervical & endocervical cancerFemale<65III/IVUnknownUnknownSD
KIF3BSNVMissense_Mutationnovelc.1231N>Tp.Asp411Tyrp.D411YO15066protein_codingdeleterious(0.01)benign(0.396)TCGA-C5-A1MN-01Cervixcervical & endocervical cancerFemale<65III/IVChemotherapycisplatinSD
KIF3BSNVMissense_Mutationnovelc.2186N>Tp.Ser729Phep.S729FO15066protein_codingdeleterious(0.04)benign(0.133)TCGA-C5-A2LY-01Cervixcervical & endocervical cancerFemale<65I/IIChemotherapycisplatinSD
Page: 1 2 3 4 5 6 7 8 

Top

Related drugs of malignant transformation related genes

check buttonIdentification of chemicals and drugs interact with genes involved in malignant transfromation
(DGIdb 4.0)
Entrez IDSymbolCategoryInteraction TypesDrug Claim NameDrug NamePMIDs
Page: 1