
|
|||||
|
 | |
| |
| |
| |
| |
| |
|
Gene: KDM5A |
Gene summary for KDM5A |
| Gene information | Species | Human | Gene symbol | KDM5A | Gene ID | 5927 |
| Gene name | lysine demethylase 5A | |
| Gene Alias | RBBP-2 | |
| Cytomap | 12p13.33 | |
| Gene Type | protein-coding | GO ID | GO:0000003 | UniProtAcc | P29375 |
Top |
Malignant transformation analysis |
| Identification of the aberrant gene expression in precancerous and cancerous lesions by comparing the gene expression of stem-like cells in diseased tissues with normal stem cells |
| Entrez ID | Symbol | Replicates | Species | Organ | Tissue | Adj P-value | Log2FC | Malignancy |
| 5927 | KDM5A | CA_HPV_1 | Human | Cervix | CC | 6.57e-04 | -4.03e-02 | 0.0264 |
| 5927 | KDM5A | CCI_2 | Human | Cervix | CC | 1.05e-02 | 7.11e-01 | 0.5249 |
| 5927 | KDM5A | CCI_3 | Human | Cervix | CC | 7.68e-10 | 1.00e+00 | 0.516 |
| 5927 | KDM5A | L1 | Human | Cervix | CC | 1.60e-05 | -3.24e-01 | 0.0802 |
| 5927 | KDM5A | LZE2T | Human | Esophagus | ESCC | 2.35e-07 | 7.27e-01 | 0.082 |
| 5927 | KDM5A | LZE4T | Human | Esophagus | ESCC | 3.15e-14 | 3.95e-01 | 0.0811 |
| 5927 | KDM5A | LZE7T | Human | Esophagus | ESCC | 2.61e-07 | 7.25e-01 | 0.0667 |
| 5927 | KDM5A | LZE8T | Human | Esophagus | ESCC | 3.38e-13 | 5.93e-01 | 0.067 |
| 5927 | KDM5A | LZE20T | Human | Esophagus | ESCC | 1.00e-04 | 3.68e-01 | 0.0662 |
| 5927 | KDM5A | LZE22T | Human | Esophagus | ESCC | 1.23e-02 | 2.99e-01 | 0.068 |
| 5927 | KDM5A | LZE24T | Human | Esophagus | ESCC | 3.92e-09 | 4.73e-01 | 0.0596 |
| 5927 | KDM5A | LZE21T | Human | Esophagus | ESCC | 3.23e-05 | 3.43e-01 | 0.0655 |
| 5927 | KDM5A | P1T-E | Human | Esophagus | ESCC | 7.68e-08 | 7.55e-01 | 0.0875 |
| 5927 | KDM5A | P2T-E | Human | Esophagus | ESCC | 1.53e-54 | 1.08e+00 | 0.1177 |
| 5927 | KDM5A | P4T-E | Human | Esophagus | ESCC | 3.96e-37 | 1.04e+00 | 0.1323 |
| 5927 | KDM5A | P5T-E | Human | Esophagus | ESCC | 1.70e-22 | 3.51e-01 | 0.1327 |
| 5927 | KDM5A | P8T-E | Human | Esophagus | ESCC | 5.30e-30 | 6.96e-01 | 0.0889 |
| 5927 | KDM5A | P9T-E | Human | Esophagus | ESCC | 2.44e-08 | 2.24e-01 | 0.1131 |
| 5927 | KDM5A | P10T-E | Human | Esophagus | ESCC | 6.36e-35 | 7.71e-01 | 0.116 |
| 5927 | KDM5A | P11T-E | Human | Esophagus | ESCC | 1.62e-12 | 5.50e-01 | 0.1426 |
| Page: 1 2 3 4 5 6 7 8 |
| Tissue | Expression Dynamics | Abbreviation |
| Cervix |  | CC: Cervix cancer |
| HSIL_HPV: HPV-infected high-grade squamous intraepithelial lesions | ||
| N_HPV: HPV-infected normal cervix | ||
| Esophagus | 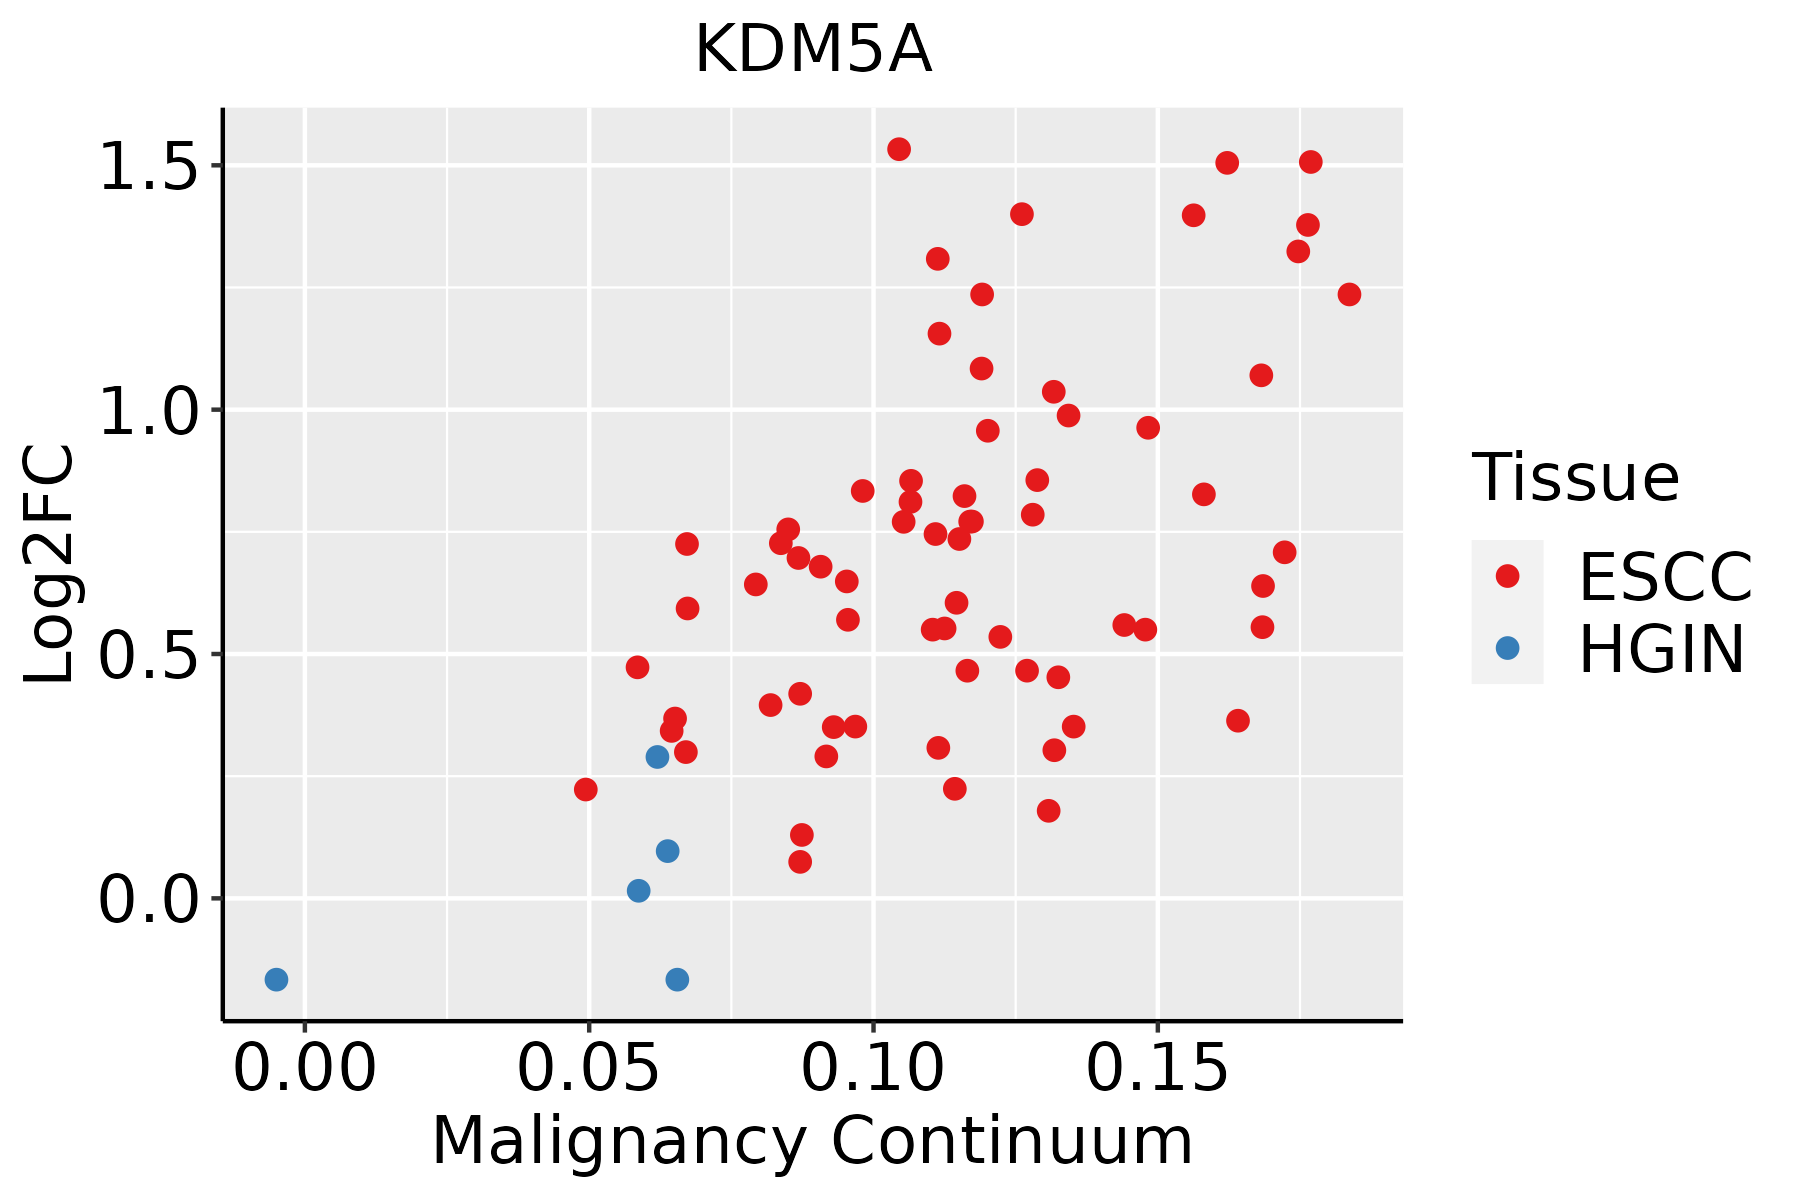 | ESCC: Esophageal squamous cell carcinoma |
| HGIN: High-grade intraepithelial neoplasias | ||
| LGIN: Low-grade intraepithelial neoplasias | ||
| Liver | 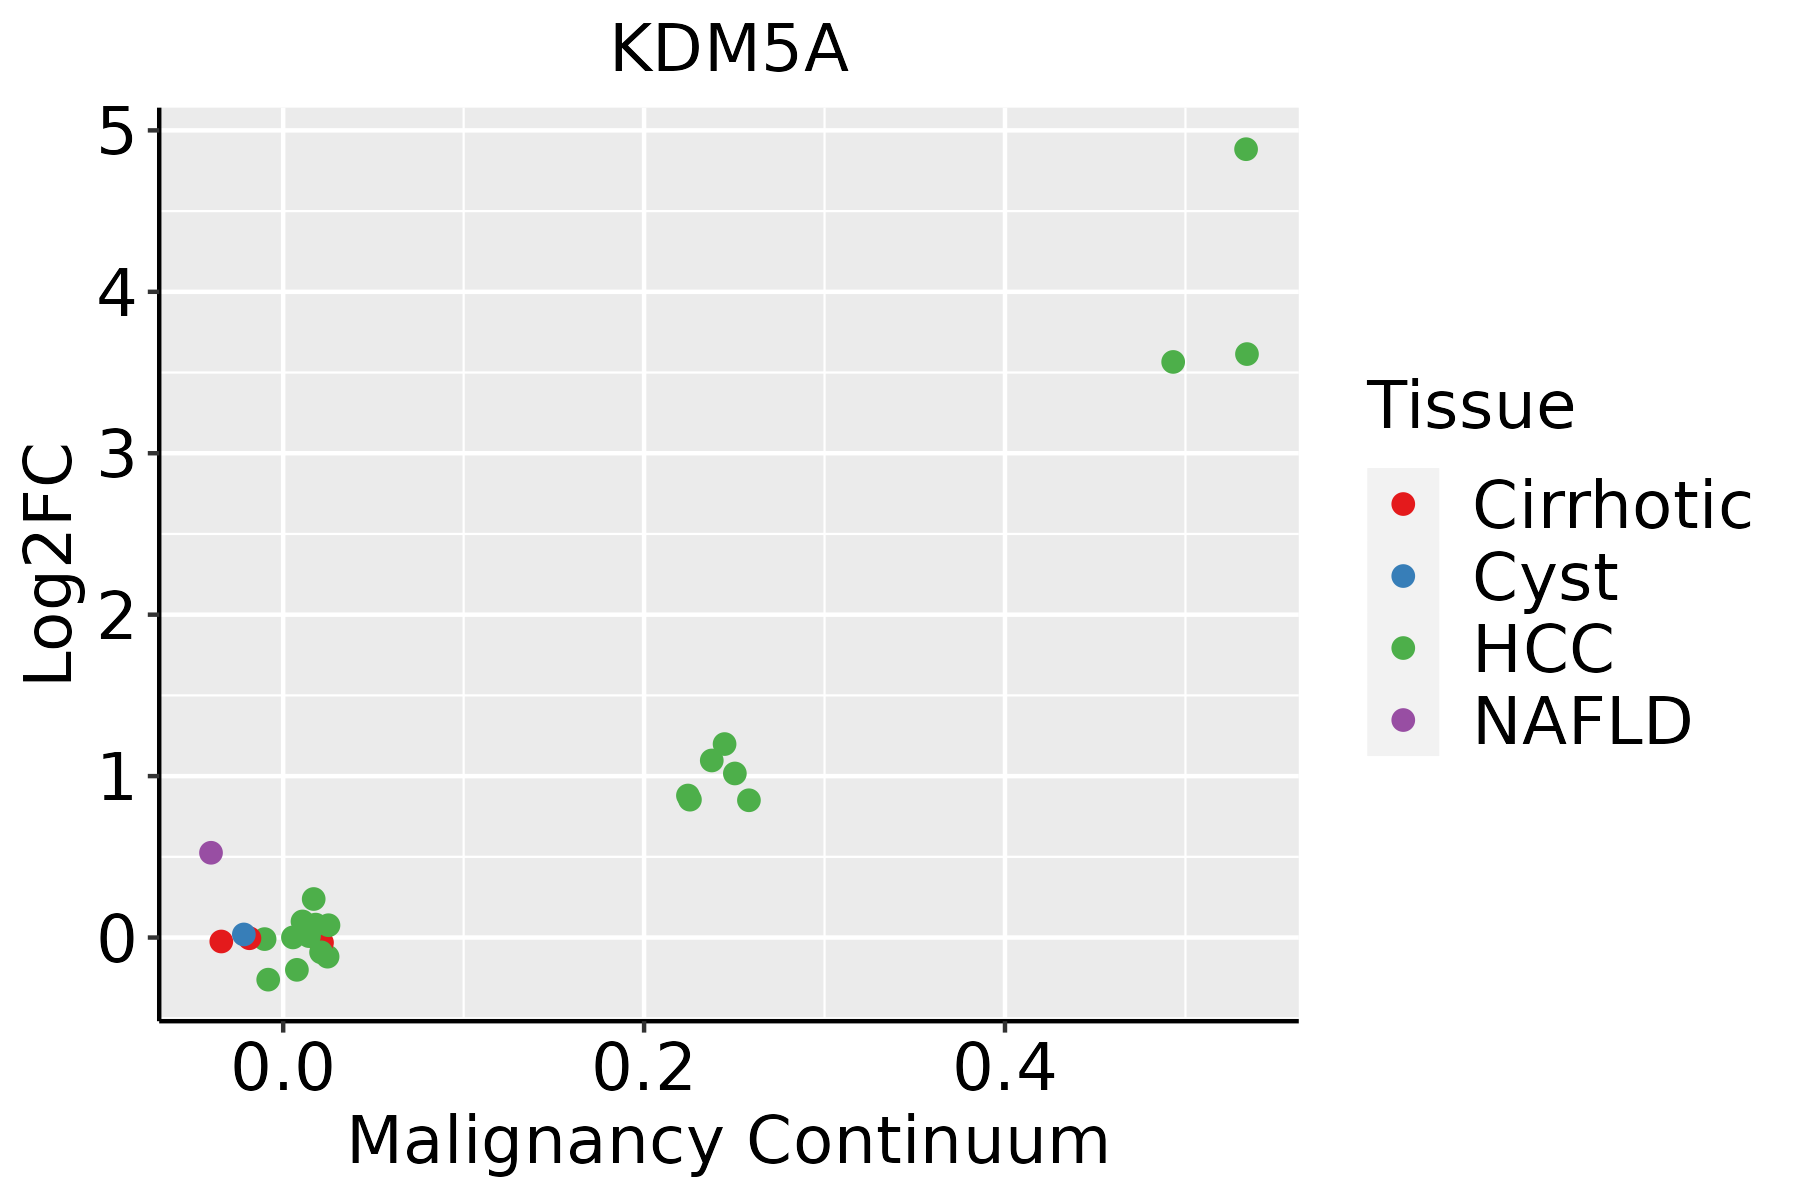 | HCC: Hepatocellular carcinoma |
| NAFLD: Non-alcoholic fatty liver disease | ||
| Oral Cavity | 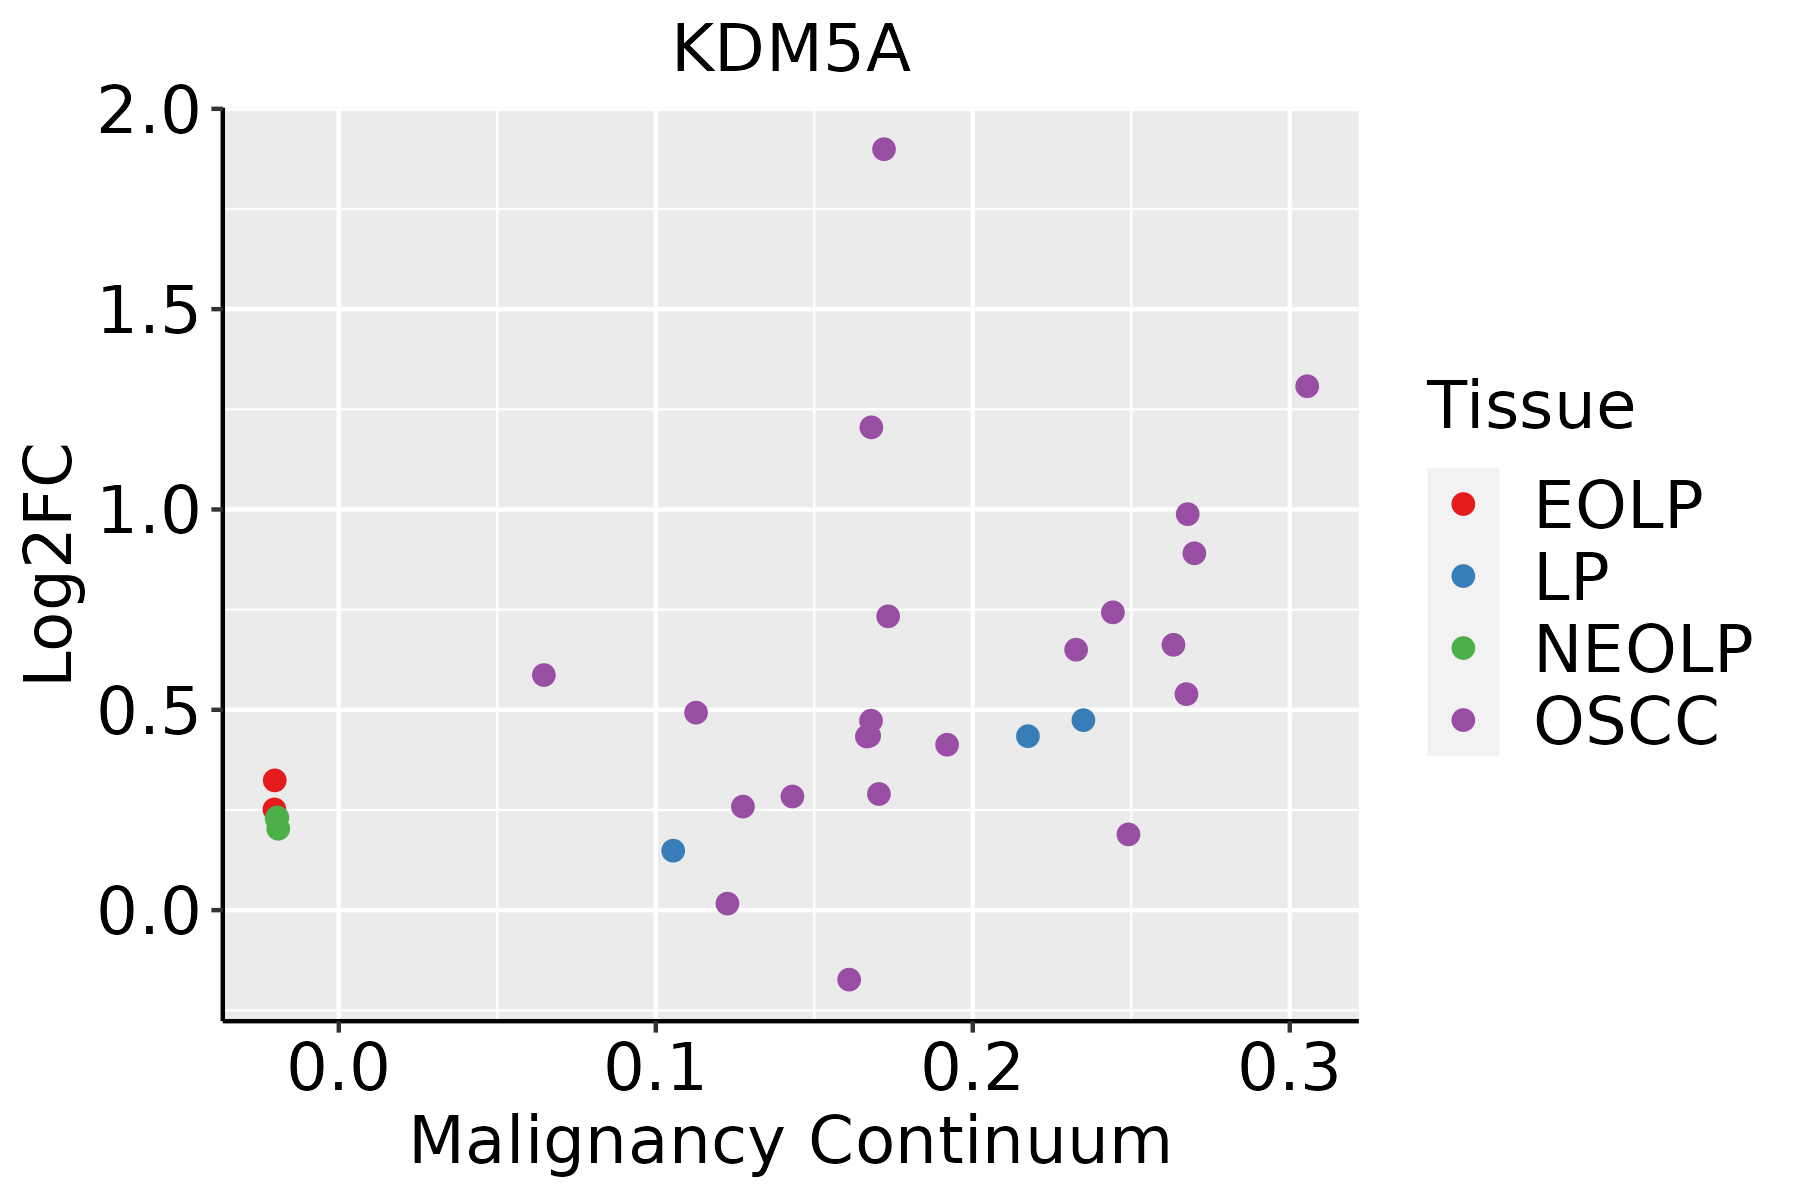 | EOLP: Erosive Oral lichen planus |
| LP: leukoplakia | ||
| NEOLP: Non-erosive oral lichen planus | ||
| OSCC: Oral squamous cell carcinoma | ||
| Prostate |  | BPH: Benign Prostatic Hyperplasia |
| Skin | 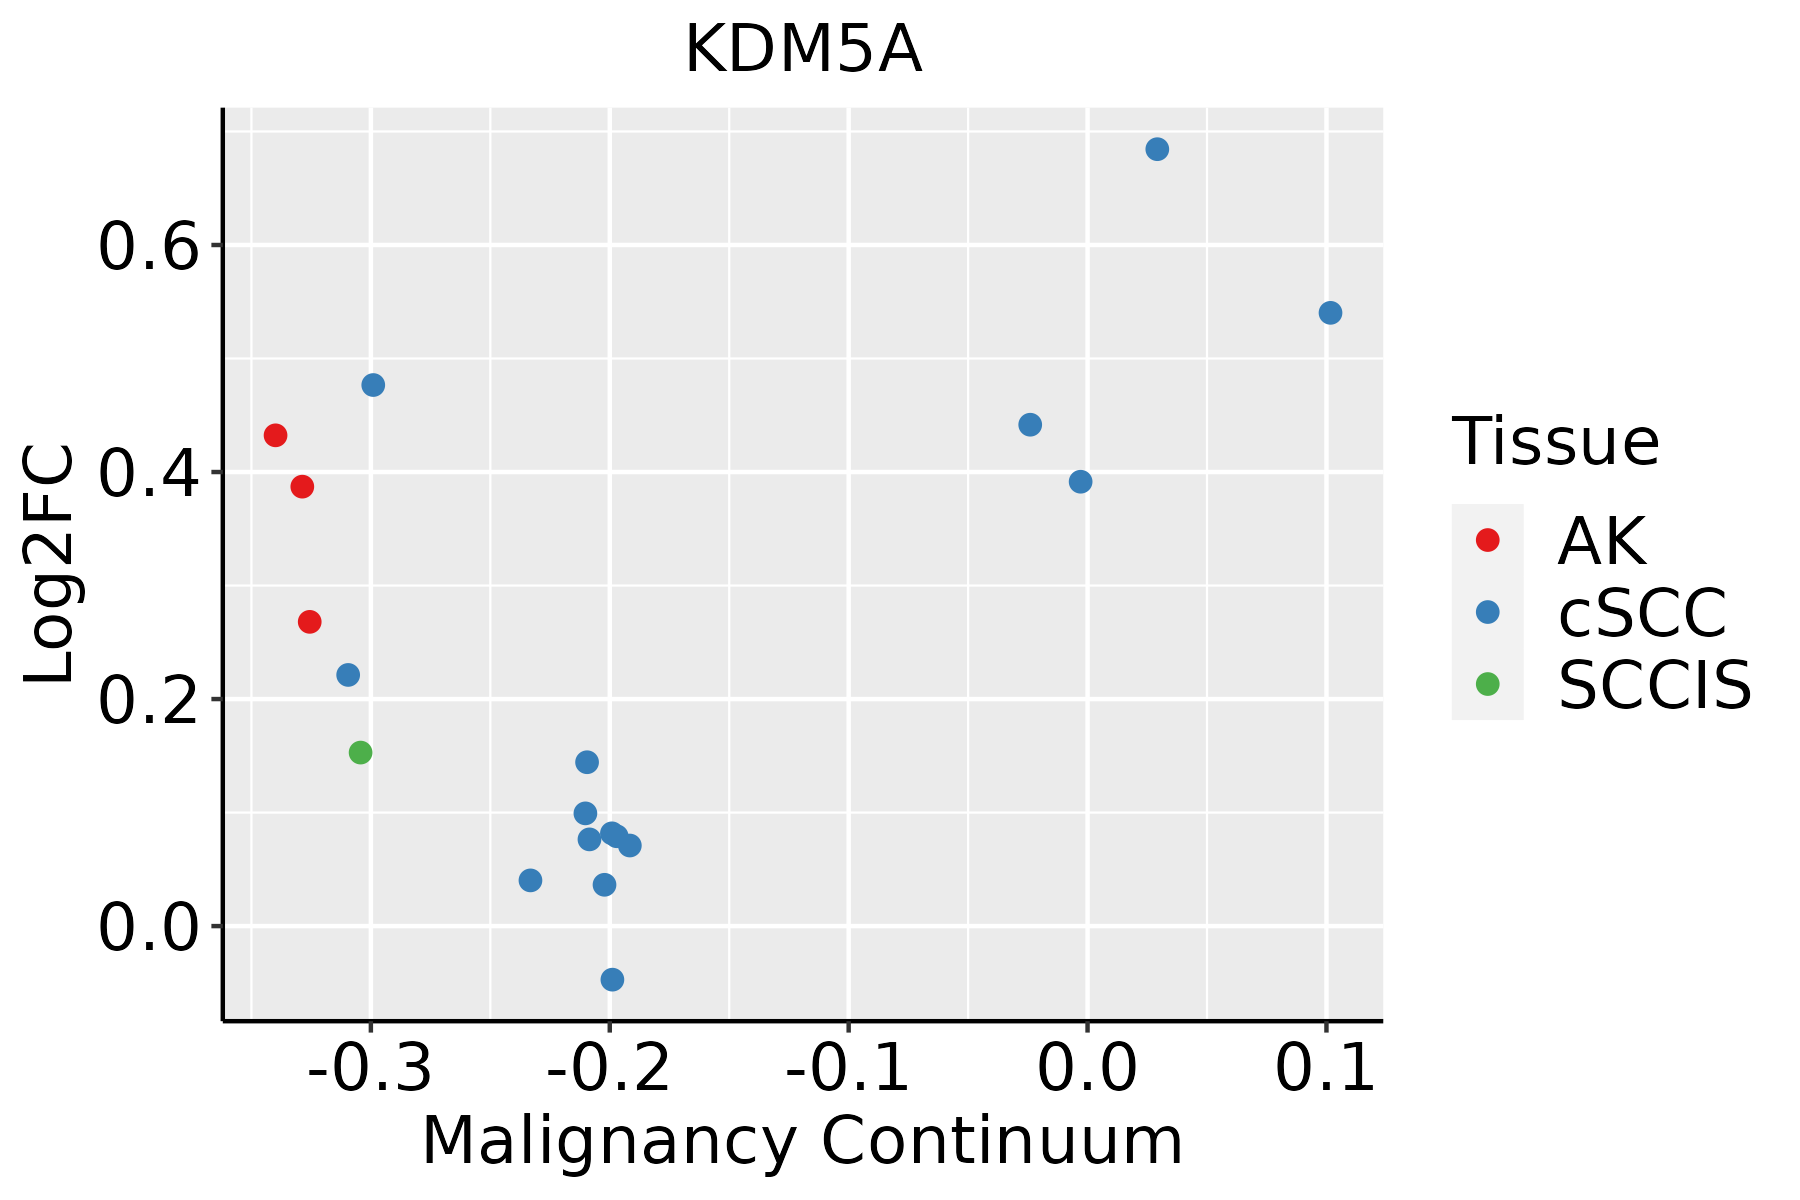 | AK: Actinic keratosis |
| cSCC: Cutaneous squamous cell carcinoma | ||
| SCCIS:squamous cell carcinoma in situ | ||
| Thyroid |  | ATC: Anaplastic thyroid cancer |
| HT: Hashimoto's thyroiditis | ||
| PTC: Papillary thyroid cancer |
| ∗log2FC in expression of this searched gene in stem-like cells from each diseased tissue sample relative to stem-like cells in normal samples in each tissue plotted against the malignancy continuum. Samples are colored based on if they are from different disease stage. |
Top |
Malignant transformation related pathway analysis |
| Find out the enriched GO biological processes and KEGG pathways involved in transition from healthy to precancer to cancer |
| Tissue | Disease Stage | Enriched GO biological Processes |
| Colorectum | AD |  |
| Colorectum | SER |  |
| Colorectum | MSS |  |
| Colorectum | MSI-H |  |
| Colorectum | FAP |  |
| ∗Top 15 enriched GO BP terms are showed in the bar plot of each disease state in each tissue. Each row represents a significant GO biological process which is colored according to the -log10(p.adjust). |
| Page: 1 2 3 4 5 6 7 8 9 |
| GO ID | Tissue | Disease Stage | Description | Gene Ratio | Bg Ratio | pvalue | p.adjust | Count |
| GO:0016577 | Liver | NAFLD | histone demethylation | 10/1882 | 31/18723 | 6.28e-04 | 8.21e-03 | 10 |
| GO:0006482 | Liver | NAFLD | protein demethylation | 10/1882 | 33/18723 | 1.09e-03 | 1.27e-02 | 10 |
| GO:0008214 | Liver | NAFLD | protein dealkylation | 10/1882 | 33/18723 | 1.09e-03 | 1.27e-02 | 10 |
| GO:0070988 | Liver | NAFLD | demethylation | 16/1882 | 73/18723 | 2.09e-03 | 2.06e-02 | 16 |
| GO:0006476 | Liver | NAFLD | protein deacetylation | 19/1882 | 101/18723 | 5.29e-03 | 4.09e-02 | 19 |
| GO:001657021 | Liver | HCC | histone modification | 283/7958 | 463/18723 | 2.68e-16 | 2.33e-14 | 283 |
| GO:003105621 | Liver | HCC | regulation of histone modification | 99/7958 | 152/18723 | 1.40e-08 | 3.40e-07 | 99 |
| GO:000762321 | Liver | HCC | circadian rhythm | 117/7958 | 210/18723 | 7.29e-05 | 6.54e-04 | 117 |
| GO:005134622 | Liver | HCC | negative regulation of hydrolase activity | 195/7958 | 379/18723 | 2.44e-04 | 1.82e-03 | 195 |
| GO:004851121 | Liver | HCC | rhythmic process | 156/7958 | 298/18723 | 3.54e-04 | 2.46e-03 | 156 |
| GO:00329222 | Liver | HCC | circadian regulation of gene expression | 43/7958 | 68/18723 | 4.48e-04 | 3.00e-03 | 43 |
| GO:0098732 | Liver | HCC | macromolecule deacylation | 67/7958 | 116/18723 | 6.46e-04 | 3.99e-03 | 67 |
| GO:000632511 | Liver | HCC | chromatin organization | 206/7958 | 409/18723 | 7.23e-04 | 4.41e-03 | 206 |
| GO:00510902 | Liver | HCC | regulation of DNA-binding transcription factor activity | 220/7958 | 440/18723 | 8.04e-04 | 4.82e-03 | 220 |
| GO:00356011 | Liver | HCC | protein deacylation | 64/7958 | 112/18723 | 1.23e-03 | 6.83e-03 | 64 |
| GO:0031057 | Liver | HCC | negative regulation of histone modification | 29/7958 | 46/18723 | 3.95e-03 | 1.74e-02 | 29 |
| GO:0090311 | Liver | HCC | regulation of protein deacetylation | 30/7958 | 48/18723 | 4.10e-03 | 1.78e-02 | 30 |
| GO:00064761 | Liver | HCC | protein deacetylation | 55/7958 | 101/18723 | 1.01e-02 | 3.79e-02 | 55 |
| GO:006145811 | Liver | HCC | reproductive system development | 205/7958 | 427/18723 | 1.16e-02 | 4.27e-02 | 205 |
| GO:00165707 | Oral cavity | OSCC | histone modification | 270/7305 | 463/18723 | 1.59e-17 | 1.50e-15 | 270 |
| Page: 1 2 3 4 5 6 7 8 9 10 11 |
| Pathway ID | Tissue | Disease Stage | Description | Gene Ratio | Bg Ratio | pvalue | p.adjust | qvalue | Count |
| Page: 1 |
Top |
Cell-cell communication analysis |
| Identification of potential cell-cell interactions between two cell types and their ligand-receptor pairs for different disease states |
| Ligand | Receptor | LRpair | Pathway | Tissue | Disease Stage |
| Page: 1 |
Top |
Single-cell gene regulatory network inference analysis |
| Find out the significant the regulons (TFs) and the target genes of each regulon across cell types for different disease states |
| TF | Cell Type | Tissue | Disease Stage | Target Gene | RSS | Regulon Activity |
| KDM5A | TREG | Esophagus | ESCC | AURKA,BCHE,RP13-516M14.4, etc. | 1.66e-01 |  |
| KDM5A | BAS | Skin | SCCIS | SLC12A8,ANO9,TSNARE1, etc. | 1.84e-01 |  |
| KDM5A | STM | Thyroid | HT | FAM118A,GPATCH2L,TMEM87B, etc. | 6.93e-01 |  |
| ∗The dot plots of a searched regulon are shown for all cell subpopulations in each disease state of each tissue based on the regulon specific score inferred using pySCENIC and by calculating the average expression. |
| Page: 1 |
Top |
Somatic mutation of malignant transformation related genes |
| Annotation of somatic variants for genes involved in malignant transformation |
| Hugo Symbol | Variant Class | Variant Classification | dbSNP RS | HGVSc | HGVSp | HGVSp Short | SWISSPROT | BIOTYPE | SIFT | PolyPhen | Tumor Sample Barcode | Tissue | Histology | Sex | Age | Stage | Therapy Types | Drugs | Outcome |
| KDM5A | SNV | Missense_Mutation | c.3908N>T | p.Ala1303Val | p.A1303V | P29375 | protein_coding | deleterious(0.04) | possibly_damaging(0.604) | TCGA-A8-A079-01 | Breast | breast invasive carcinoma | Female | >=65 | III/IV | Chemotherapy | 5-fluorouracil | SD | |
| KDM5A | SNV | Missense_Mutation | rs776901877 | c.3045N>G | p.Ser1015Arg | p.S1015R | P29375 | protein_coding | deleterious(0.03) | benign(0.189) | TCGA-A8-A095-01 | Breast | breast invasive carcinoma | Female | <65 | I/II | Chemotherapy | 5-fluorouracil | CR |
| KDM5A | SNV | Missense_Mutation | c.5042N>C | p.Leu1681Pro | p.L1681P | P29375 | protein_coding | deleterious_low_confidence(0.01) | possibly_damaging(0.478) | TCGA-A8-A09Z-01 | Breast | breast invasive carcinoma | Female | >=65 | I/II | Unknown | Unknown | SD | |
| KDM5A | SNV | Missense_Mutation | c.4082C>G | p.Ala1361Gly | p.A1361G | P29375 | protein_coding | tolerated(0.45) | benign(0) | TCGA-A8-A0AB-01 | Breast | breast invasive carcinoma | Female | <65 | I/II | Chemotherapy | 5-fluorouracil | CR | |
| KDM5A | SNV | Missense_Mutation | novel | c.791N>A | p.Arg264Gln | p.R264Q | P29375 | protein_coding | tolerated(0.34) | benign(0.03) | TCGA-AN-A046-01 | Breast | breast invasive carcinoma | Female | >=65 | I/II | Unknown | Unknown | SD |
| KDM5A | SNV | Missense_Mutation | c.349C>A | p.Leu117Met | p.L117M | P29375 | protein_coding | deleterious(0) | probably_damaging(0.999) | TCGA-AN-A0AR-01 | Breast | breast invasive carcinoma | Female | <65 | I/II | Unknown | Unknown | SD | |
| KDM5A | SNV | Missense_Mutation | rs748024384 | c.1570G>A | p.Glu524Lys | p.E524K | P29375 | protein_coding | deleterious(0) | benign(0.327) | TCGA-AN-A0FK-01 | Breast | breast invasive carcinoma | Female | >=65 | III/IV | Unknown | Unknown | SD |
| KDM5A | SNV | Missense_Mutation | c.2815G>C | p.Glu939Gln | p.E939Q | P29375 | protein_coding | deleterious(0) | benign(0.217) | TCGA-AN-A0FL-01 | Breast | breast invasive carcinoma | Female | <65 | I/II | Unknown | Unknown | SD | |
| KDM5A | SNV | Missense_Mutation | c.769G>C | p.Asp257His | p.D257H | P29375 | protein_coding | deleterious(0.02) | benign(0.011) | TCGA-D8-A1JA-01 | Breast | breast invasive carcinoma | Female | <65 | III/IV | Chemotherapy | adriamycin | PD | |
| KDM5A | SNV | Missense_Mutation | c.659N>A | p.Arg220His | p.R220H | P29375 | protein_coding | deleterious(0.02) | possibly_damaging(0.886) | TCGA-D8-A27W-01 | Breast | breast invasive carcinoma | Female | <65 | III/IV | Chemotherapy | doxorubicine+cyclophosphamide | SD |
| Page: 1 2 3 4 5 6 7 8 9 10 11 12 13 14 15 16 17 18 |
Top |
Related drugs of malignant transformation related genes |
| Identification of chemicals and drugs interact with genes involved in malignant transfromation |
| (DGIdb 4.0) |
| Entrez ID | Symbol | Category | Interaction Types | Drug Claim Name | Drug Name | PMIDs |
| 5927 | KDM5A | CLINICALLY ACTIONABLE, ENZYME, NUCLEAR HORMONE RECEPTOR | BDBM50158803 | |||
| 5927 | KDM5A | CLINICALLY ACTIONABLE, ENZYME, NUCLEAR HORMONE RECEPTOR | US9714230, 46 | |||
| 5927 | KDM5A | CLINICALLY ACTIONABLE, ENZYME, NUCLEAR HORMONE RECEPTOR | 1190312-92-5 | |||
| 5927 | KDM5A | CLINICALLY ACTIONABLE, ENZYME, NUCLEAR HORMONE RECEPTOR | US10022354, Example 152 | |||
| 5927 | KDM5A | CLINICALLY ACTIONABLE, ENZYME, NUCLEAR HORMONE RECEPTOR | AKOS020330481 | |||
| 5927 | KDM5A | CLINICALLY ACTIONABLE, ENZYME, NUCLEAR HORMONE RECEPTOR | BDBM50158794 | |||
| 5927 | KDM5A | CLINICALLY ACTIONABLE, ENZYME, NUCLEAR HORMONE RECEPTOR | inhibitor | 178103606 | ||
| 5927 | KDM5A | CLINICALLY ACTIONABLE, ENZYME, NUCLEAR HORMONE RECEPTOR | US10174026, Example 2 | |||
| 5927 | KDM5A | CLINICALLY ACTIONABLE, ENZYME, NUCLEAR HORMONE RECEPTOR | US10022354, Example 151 | |||
| 5927 | KDM5A | CLINICALLY ACTIONABLE, ENZYME, NUCLEAR HORMONE RECEPTOR | US10174026, Example 99 |
| Page: 1 2 3 |

Copyright 2023-Present -The University of Texas Health Science Center at Houston |