
|
|||||
|
 | |
| |
| |
| |
| |
| |
|
Gene: KDM2A |
Gene summary for KDM2A |
| Gene information | Species | Human | Gene symbol | KDM2A | Gene ID | 22992 |
| Gene name | lysine demethylase 2A | |
| Gene Alias | CXXC8 | |
| Cytomap | 11q13.2 | |
| Gene Type | protein-coding | GO ID | GO:0006139 | UniProtAcc | Q9Y2K7 |
Top |
Malignant transformation analysis |
| Identification of the aberrant gene expression in precancerous and cancerous lesions by comparing the gene expression of stem-like cells in diseased tissues with normal stem cells |
| Entrez ID | Symbol | Replicates | Species | Organ | Tissue | Adj P-value | Log2FC | Malignancy |
| 22992 | KDM2A | CA_HPV_1 | Human | Cervix | CC | 1.16e-02 | 5.11e-02 | 0.0264 |
| 22992 | KDM2A | CCI_1 | Human | Cervix | CC | 7.21e-06 | 9.31e-01 | 0.528 |
| 22992 | KDM2A | CCI_2 | Human | Cervix | CC | 5.17e-04 | 8.78e-01 | 0.5249 |
| 22992 | KDM2A | CCI_3 | Human | Cervix | CC | 6.90e-13 | 1.14e+00 | 0.516 |
| 22992 | KDM2A | HTA11_3410_2000001011 | Human | Colorectum | AD | 8.55e-04 | -3.87e-01 | 0.0155 |
| 22992 | KDM2A | HTA11_347_2000001011 | Human | Colorectum | AD | 6.90e-07 | 4.14e-01 | -0.1954 |
| 22992 | KDM2A | HTA11_411_2000001011 | Human | Colorectum | SER | 9.74e-04 | 6.63e-01 | -0.2602 |
| 22992 | KDM2A | HTA11_99999970781_79442 | Human | Colorectum | MSS | 4.48e-07 | -3.61e-01 | 0.294 |
| 22992 | KDM2A | HTA11_99999965062_69753 | Human | Colorectum | MSI-H | 1.25e-02 | 6.43e-01 | 0.3487 |
| 22992 | KDM2A | HTA11_99999974143_84620 | Human | Colorectum | MSS | 9.93e-11 | -4.54e-01 | 0.3005 |
| 22992 | KDM2A | F007 | Human | Colorectum | FAP | 3.36e-02 | -1.72e-01 | 0.1176 |
| 22992 | KDM2A | A002-C-010 | Human | Colorectum | FAP | 2.17e-03 | -2.50e-01 | 0.242 |
| 22992 | KDM2A | A001-C-207 | Human | Colorectum | FAP | 3.74e-02 | -2.17e-01 | 0.1278 |
| 22992 | KDM2A | A015-C-203 | Human | Colorectum | FAP | 1.62e-31 | -3.41e-01 | -0.1294 |
| 22992 | KDM2A | A015-C-204 | Human | Colorectum | FAP | 1.47e-04 | -3.05e-01 | -0.0228 |
| 22992 | KDM2A | A014-C-040 | Human | Colorectum | FAP | 3.37e-03 | -3.02e-01 | -0.1184 |
| 22992 | KDM2A | A002-C-201 | Human | Colorectum | FAP | 8.79e-16 | -4.26e-01 | 0.0324 |
| 22992 | KDM2A | A002-C-203 | Human | Colorectum | FAP | 6.27e-03 | -2.49e-01 | 0.2786 |
| 22992 | KDM2A | A001-C-119 | Human | Colorectum | FAP | 5.77e-08 | 1.14e-01 | -0.1557 |
| 22992 | KDM2A | A001-C-108 | Human | Colorectum | FAP | 2.12e-17 | -1.38e-01 | -0.0272 |
| Page: 1 2 3 4 5 6 7 8 9 10 11 |
| Tissue | Expression Dynamics | Abbreviation |
| Cervix |  | CC: Cervix cancer |
| HSIL_HPV: HPV-infected high-grade squamous intraepithelial lesions | ||
| N_HPV: HPV-infected normal cervix | ||
| Colorectum (GSE201348) |  | FAP: Familial adenomatous polyposis |
| CRC: Colorectal cancer | ||
| Colorectum (HTA11) | 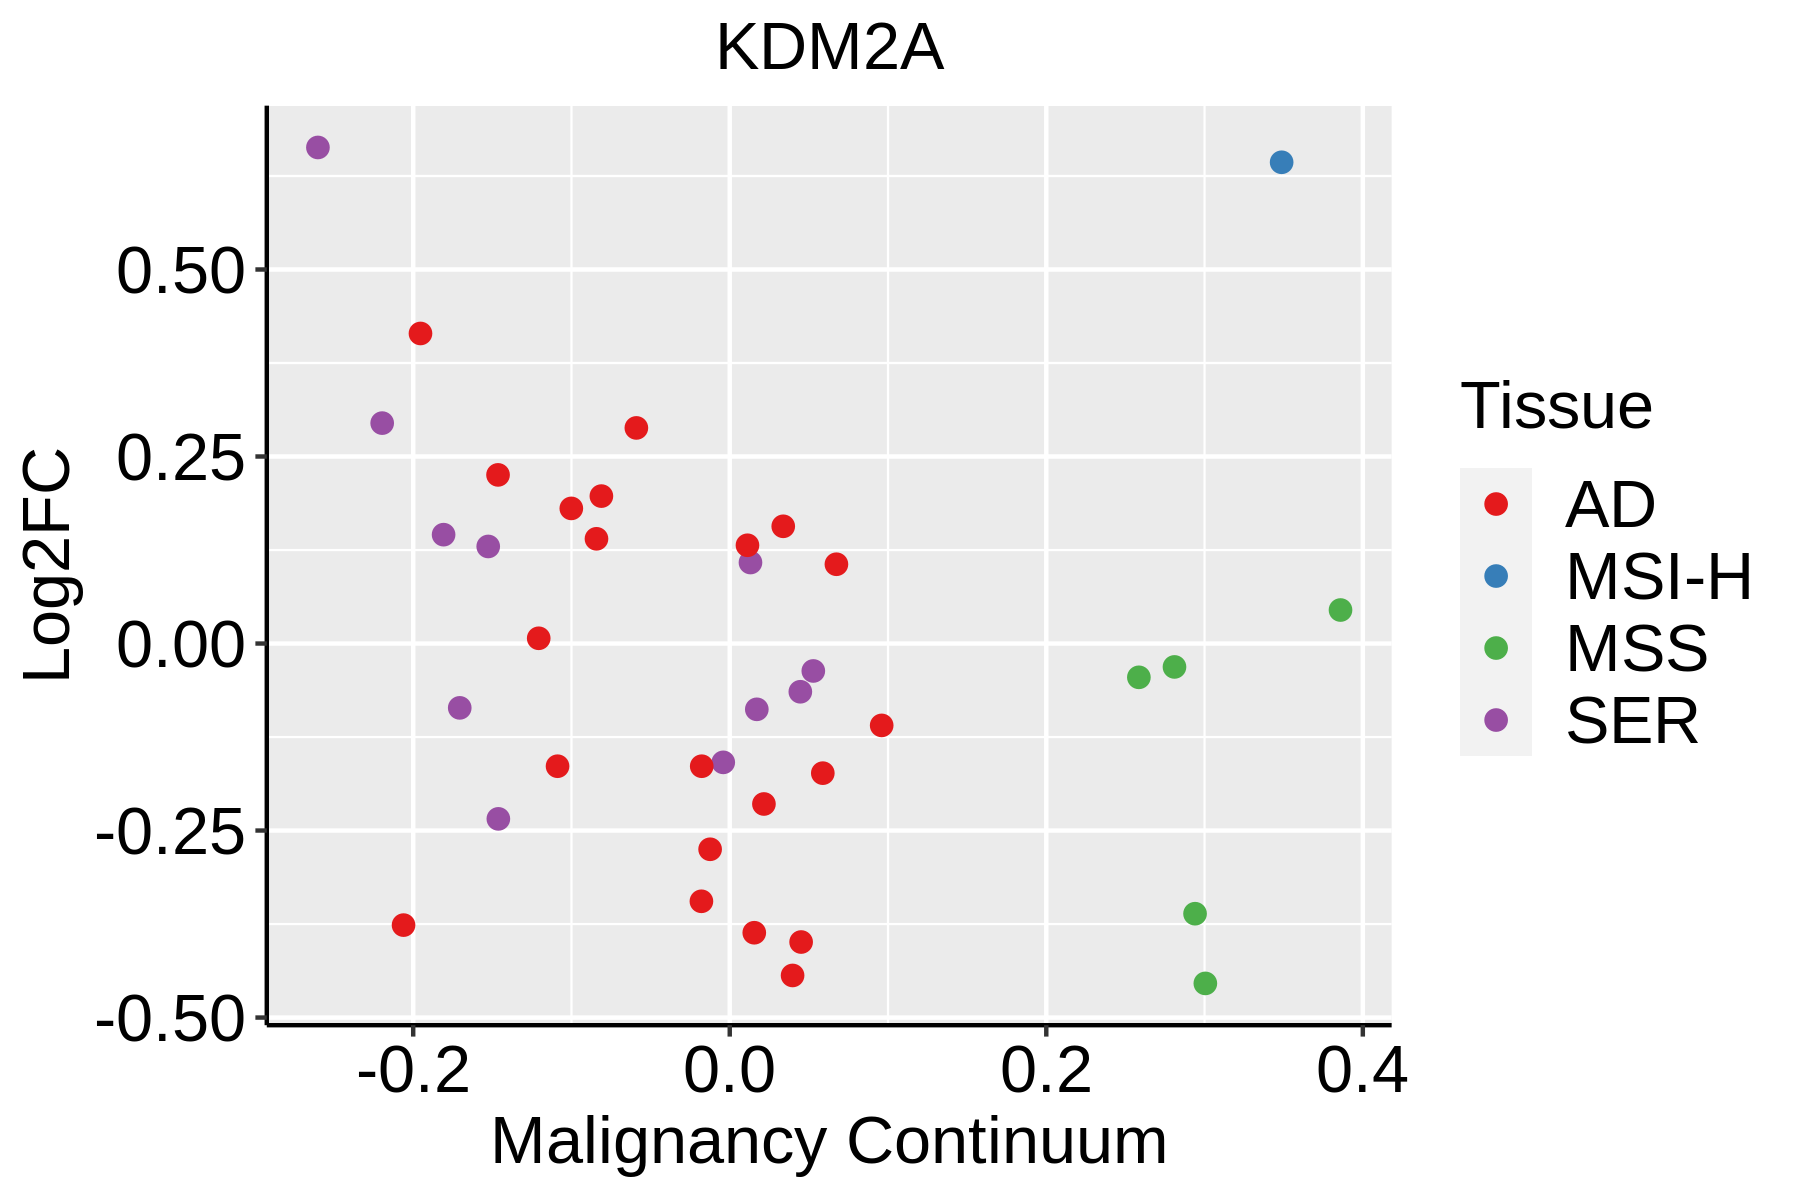 | AD: Adenomas |
| SER: Sessile serrated lesions | ||
| MSI-H: Microsatellite-high colorectal cancer | ||
| MSS: Microsatellite stable colorectal cancer | ||
| Endometrium | 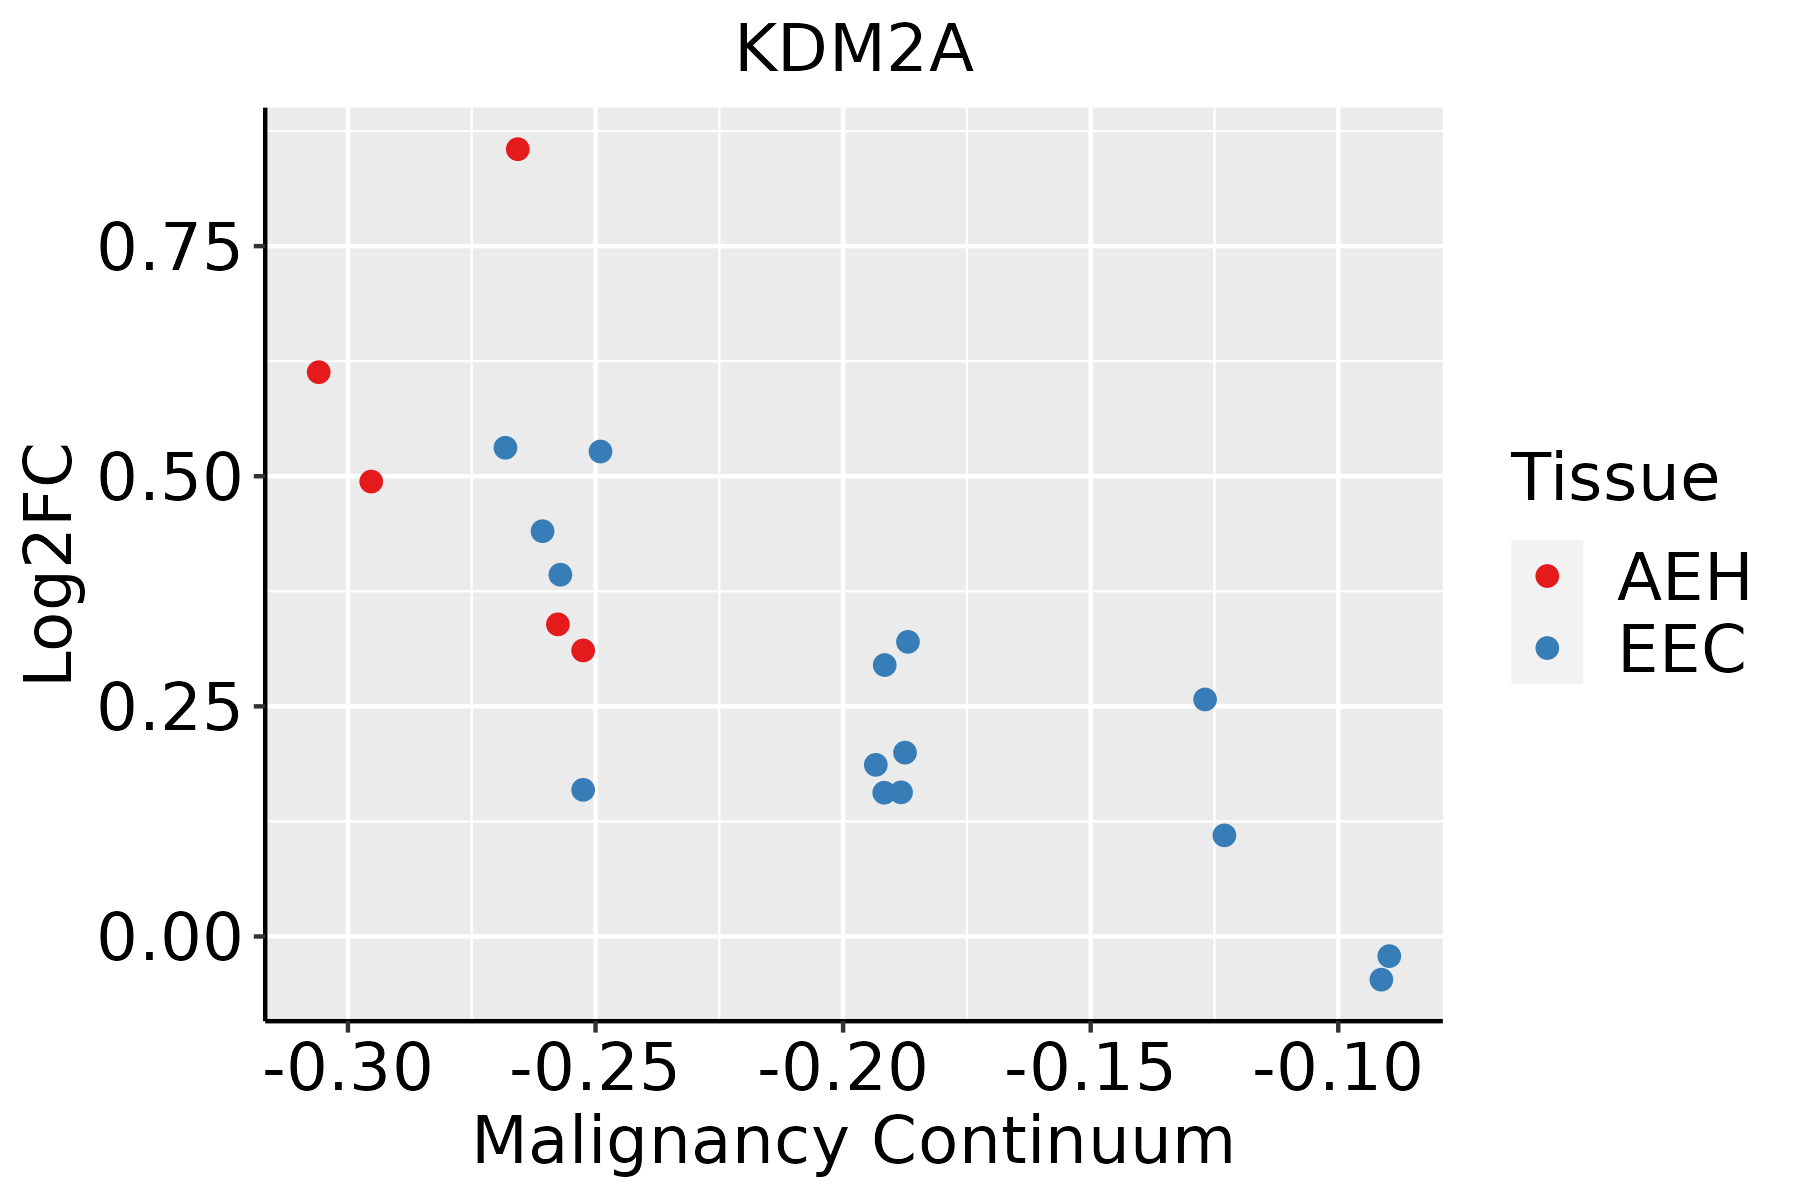 | AEH: Atypical endometrial hyperplasia |
| EEC: Endometrioid Cancer | ||
| Esophagus | 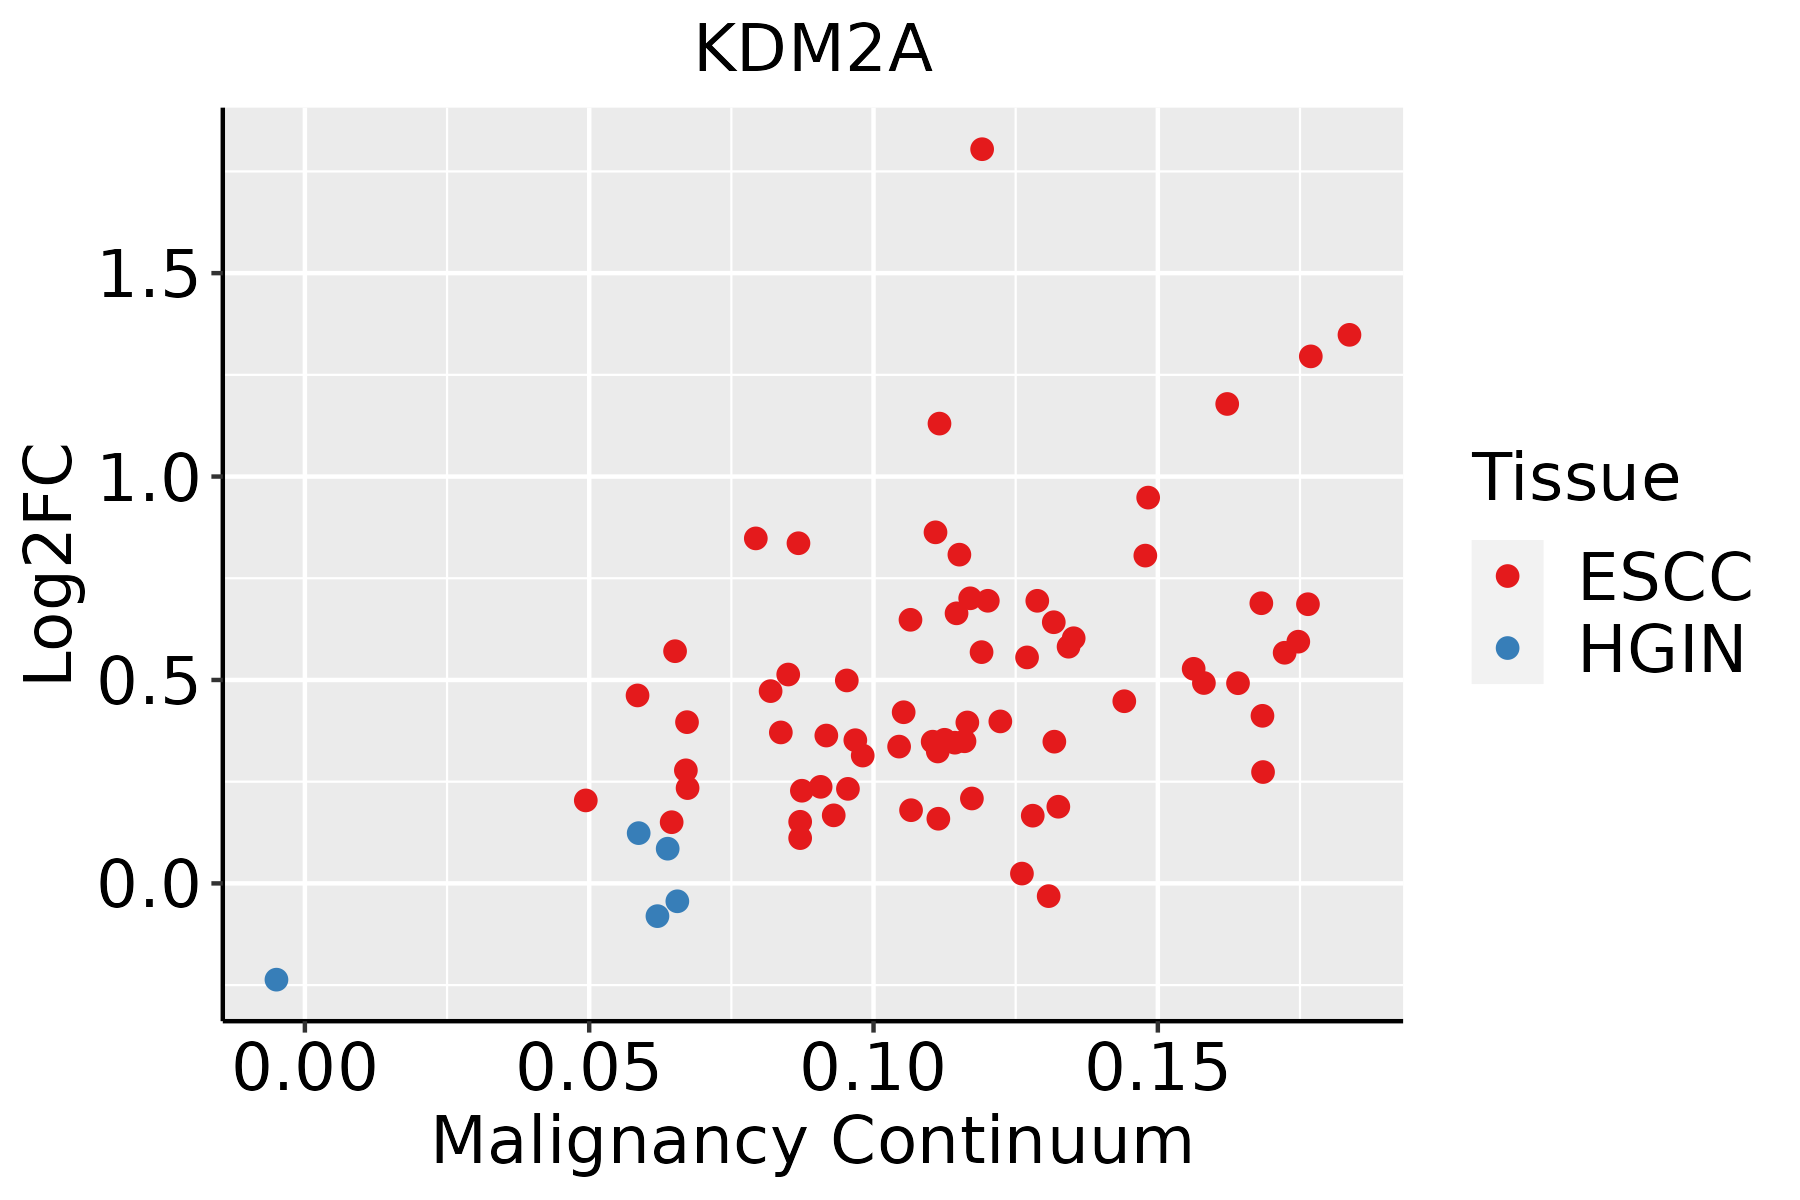 | ESCC: Esophageal squamous cell carcinoma |
| HGIN: High-grade intraepithelial neoplasias | ||
| LGIN: Low-grade intraepithelial neoplasias | ||
| Liver | 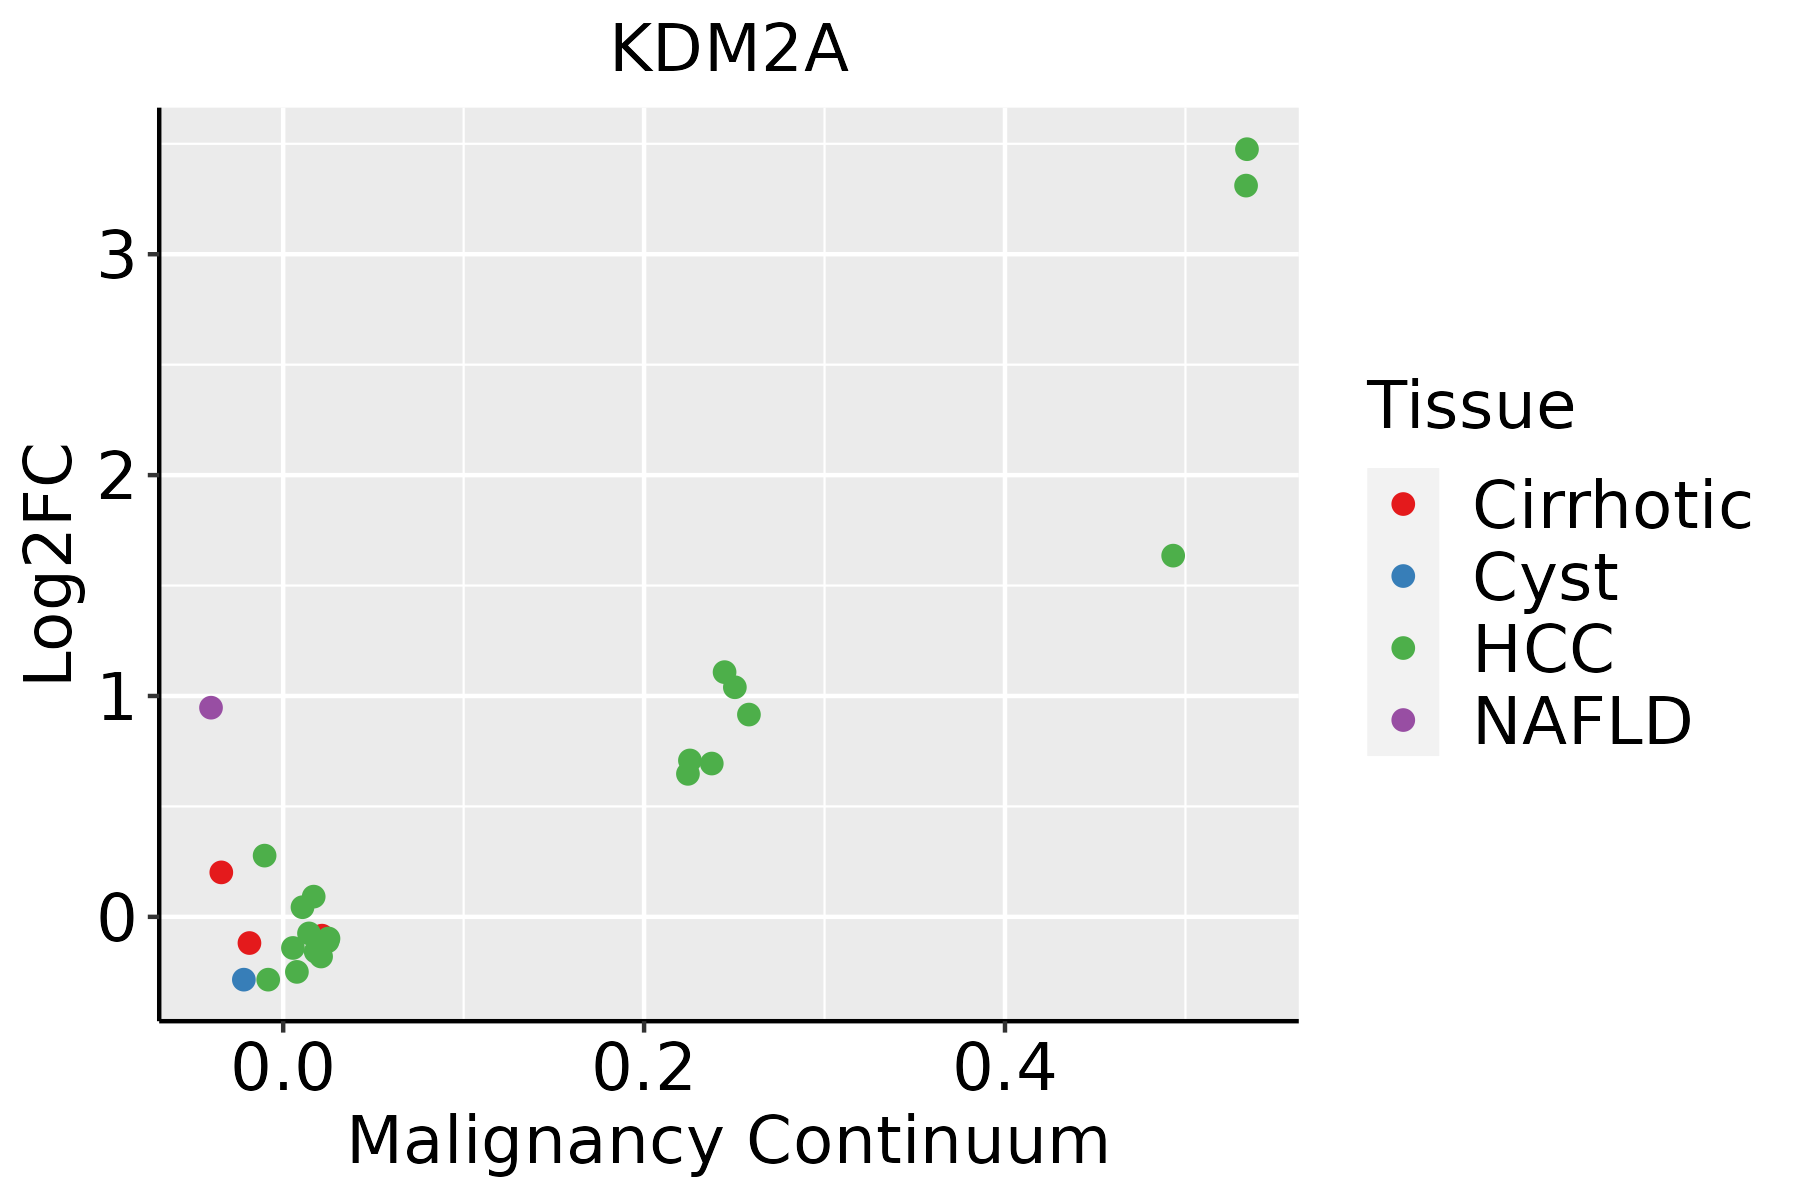 | HCC: Hepatocellular carcinoma |
| NAFLD: Non-alcoholic fatty liver disease | ||
| Lung |  | AAH: Atypical adenomatous hyperplasia |
| AIS: Adenocarcinoma in situ | ||
| IAC: Invasive lung adenocarcinoma | ||
| MIA: Minimally invasive adenocarcinoma | ||
| Oral Cavity | 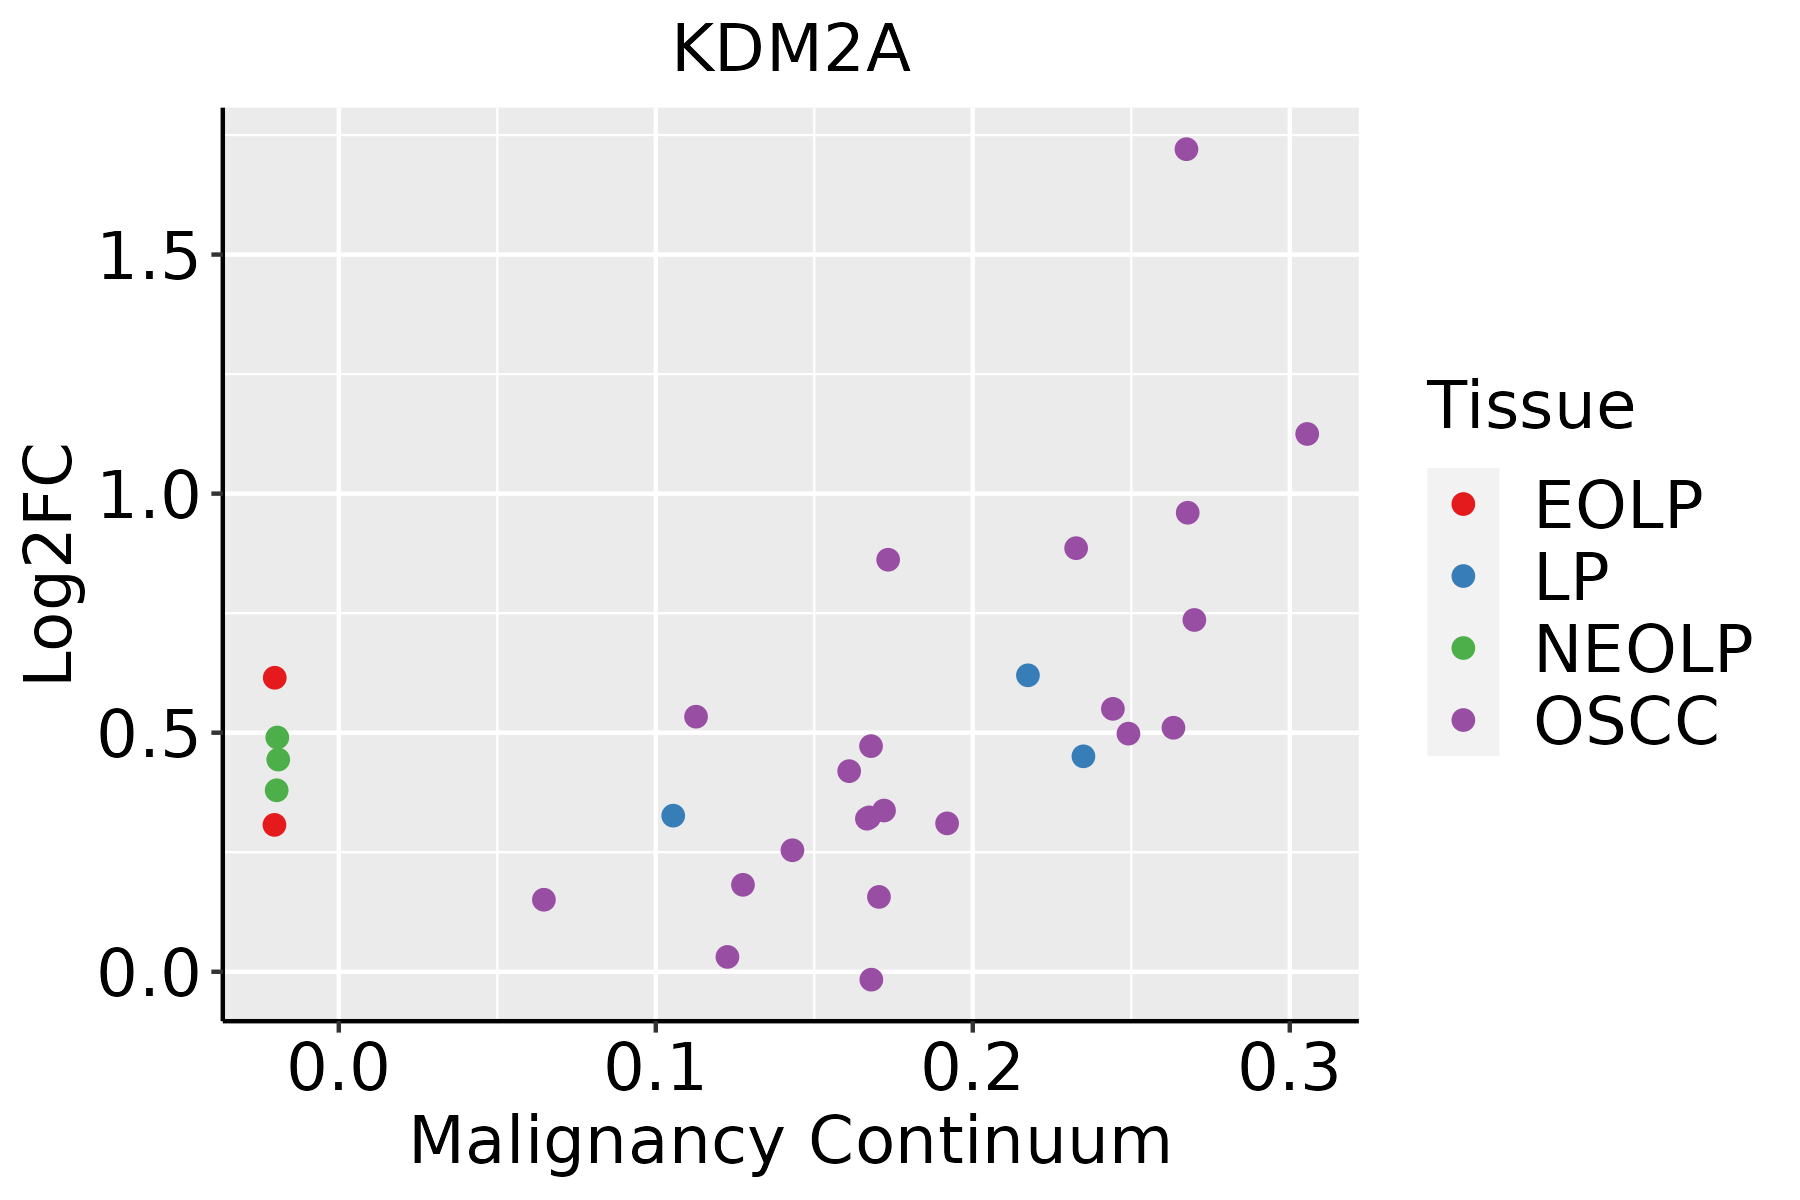 | EOLP: Erosive Oral lichen planus |
| LP: leukoplakia | ||
| NEOLP: Non-erosive oral lichen planus | ||
| OSCC: Oral squamous cell carcinoma | ||
| Prostate |  | BPH: Benign Prostatic Hyperplasia |
| Skin | 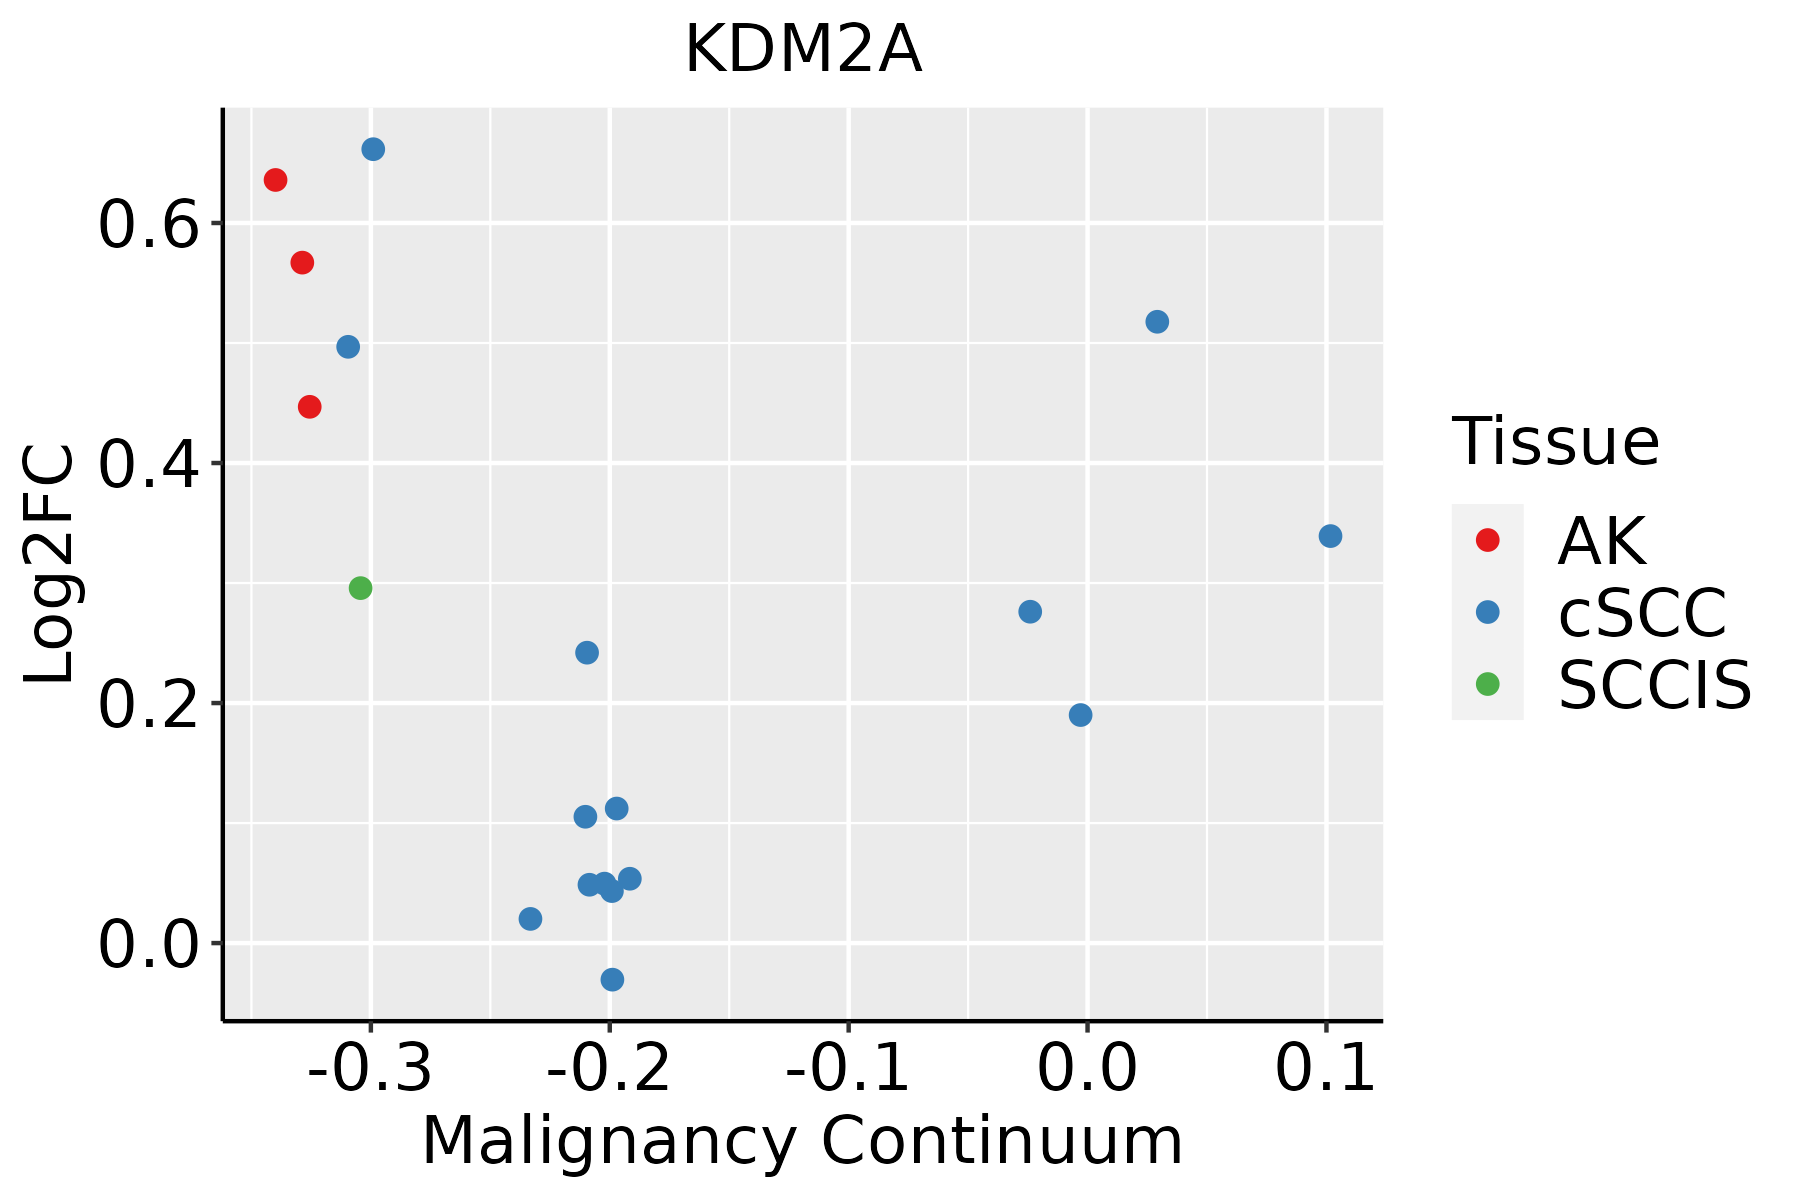 | AK: Actinic keratosis |
| cSCC: Cutaneous squamous cell carcinoma | ||
| SCCIS:squamous cell carcinoma in situ | ||
| Thyroid |  | ATC: Anaplastic thyroid cancer |
| HT: Hashimoto's thyroiditis | ||
| PTC: Papillary thyroid cancer |
| ∗log2FC in expression of this searched gene in stem-like cells from each diseased tissue sample relative to stem-like cells in normal samples in each tissue plotted against the malignancy continuum. Samples are colored based on if they are from different disease stage. |
Top |
Malignant transformation related pathway analysis |
| Find out the enriched GO biological processes and KEGG pathways involved in transition from healthy to precancer to cancer |
| Tissue | Disease Stage | Enriched GO biological Processes |
| Colorectum | AD |  |
| Colorectum | SER |  |
| Colorectum | MSS |  |
| Colorectum | MSI-H |  |
| Colorectum | FAP |  |
| ∗Top 15 enriched GO BP terms are showed in the bar plot of each disease state in each tissue. Each row represents a significant GO biological process which is colored according to the -log10(p.adjust). |
| Page: 1 2 3 4 5 6 7 8 9 |
| GO ID | Tissue | Disease Stage | Description | Gene Ratio | Bg Ratio | pvalue | p.adjust | Count |
| GO:004851118 | Esophagus | ESCC | rhythmic process | 164/8552 | 298/18723 | 6.80e-04 | 3.57e-03 | 164 |
| GO:000762319 | Esophagus | ESCC | circadian rhythm | 119/8552 | 210/18723 | 8.47e-04 | 4.36e-03 | 119 |
| GO:0006303 | Esophagus | ESCC | double-strand break repair via nonhomologous end joining | 43/8552 | 66/18723 | 1.10e-03 | 5.53e-03 | 43 |
| GO:00064824 | Esophagus | ESCC | protein demethylation | 24/8552 | 33/18723 | 1.50e-03 | 7.06e-03 | 24 |
| GO:00082144 | Esophagus | ESCC | protein dealkylation | 24/8552 | 33/18723 | 1.50e-03 | 7.06e-03 | 24 |
| GO:00165773 | Esophagus | ESCC | histone demethylation | 22/8552 | 31/18723 | 3.90e-03 | 1.58e-02 | 22 |
| GO:00700763 | Esophagus | ESCC | histone lysine demethylation | 20/8552 | 28/18723 | 5.23e-03 | 1.97e-02 | 20 |
| GO:00427529 | Esophagus | ESCC | regulation of circadian rhythm | 68/8552 | 121/18723 | 1.27e-02 | 4.21e-02 | 68 |
| GO:00165703 | Liver | NAFLD | histone modification | 90/1882 | 463/18723 | 5.74e-10 | 1.28e-07 | 90 |
| GO:00485115 | Liver | NAFLD | rhythmic process | 56/1882 | 298/18723 | 3.03e-06 | 1.23e-04 | 56 |
| GO:00076236 | Liver | NAFLD | circadian rhythm | 42/1882 | 210/18723 | 1.06e-05 | 3.34e-04 | 42 |
| GO:0070076 | Liver | NAFLD | histone lysine demethylation | 10/1882 | 28/18723 | 2.46e-04 | 4.09e-03 | 10 |
| GO:00329223 | Liver | NAFLD | circadian regulation of gene expression | 17/1882 | 68/18723 | 3.10e-04 | 4.85e-03 | 17 |
| GO:0016577 | Liver | NAFLD | histone demethylation | 10/1882 | 31/18723 | 6.28e-04 | 8.21e-03 | 10 |
| GO:0006482 | Liver | NAFLD | protein demethylation | 10/1882 | 33/18723 | 1.09e-03 | 1.27e-02 | 10 |
| GO:0008214 | Liver | NAFLD | protein dealkylation | 10/1882 | 33/18723 | 1.09e-03 | 1.27e-02 | 10 |
| GO:0070988 | Liver | NAFLD | demethylation | 16/1882 | 73/18723 | 2.09e-03 | 2.06e-02 | 16 |
| GO:001657021 | Liver | HCC | histone modification | 283/7958 | 463/18723 | 2.68e-16 | 2.33e-14 | 283 |
| GO:000762321 | Liver | HCC | circadian rhythm | 117/7958 | 210/18723 | 7.29e-05 | 6.54e-04 | 117 |
| GO:004851121 | Liver | HCC | rhythmic process | 156/7958 | 298/18723 | 3.54e-04 | 2.46e-03 | 156 |
| Page: 1 2 3 4 5 6 7 8 |
| Pathway ID | Tissue | Disease Stage | Description | Gene Ratio | Bg Ratio | pvalue | p.adjust | qvalue | Count |
| Page: 1 |
Top |
Cell-cell communication analysis |
| Identification of potential cell-cell interactions between two cell types and their ligand-receptor pairs for different disease states |
| Ligand | Receptor | LRpair | Pathway | Tissue | Disease Stage |
| Page: 1 |
Top |
Single-cell gene regulatory network inference analysis |
| Find out the significant the regulons (TFs) and the target genes of each regulon across cell types for different disease states |
| TF | Cell Type | Tissue | Disease Stage | Target Gene | RSS | Regulon Activity |
| KDM2A | CD8TEXP | Liver | Cirrhotic | HOPX,KLRD1,CLEC10A, etc. | 1.32e-01 |  |
| KDM2A | CD8TEREX | Liver | HCC | HOPX,KLRD1,CLEC10A, etc. | 2.06e-01 |  |
| ∗The dot plots of a searched regulon are shown for all cell subpopulations in each disease state of each tissue based on the regulon specific score inferred using pySCENIC and by calculating the average expression. |
| Page: 1 |
Top |
Somatic mutation of malignant transformation related genes |
| Annotation of somatic variants for genes involved in malignant transformation |
| Hugo Symbol | Variant Class | Variant Classification | dbSNP RS | HGVSc | HGVSp | HGVSp Short | SWISSPROT | BIOTYPE | SIFT | PolyPhen | Tumor Sample Barcode | Tissue | Histology | Sex | Age | Stage | Therapy Types | Drugs | Outcome |
| KDM2A | SNV | Missense_Mutation | rs746832356 | c.2384G>A | p.Arg795Gln | p.R795Q | Q9Y2K7 | protein_coding | tolerated(0.21) | benign(0.06) | TCGA-A2-A0ER-01 | Breast | breast invasive carcinoma | Female | <65 | I/II | Chemotherapy | cytoxan | SD |
| KDM2A | SNV | Missense_Mutation | c.1318G>A | p.Asp440Asn | p.D440N | Q9Y2K7 | protein_coding | tolerated(0.48) | benign(0.01) | TCGA-AC-A23H-01 | Breast | breast invasive carcinoma | Female | >=65 | I/II | Unknown | Unknown | PD | |
| KDM2A | SNV | Missense_Mutation | rs779790225 | c.59N>A | p.Arg20Gln | p.R20Q | Q9Y2K7 | protein_coding | tolerated(0.18) | possibly_damaging(0.449) | TCGA-AN-A046-01 | Breast | breast invasive carcinoma | Female | >=65 | I/II | Unknown | Unknown | SD |
| KDM2A | SNV | Missense_Mutation | c.1126N>A | p.Glu376Lys | p.E376K | Q9Y2K7 | protein_coding | tolerated(0.2) | benign(0.011) | TCGA-B6-A1KN-01 | Breast | breast invasive carcinoma | Female | <65 | III/IV | Unknown | Unknown | SD | |
| KDM2A | SNV | Missense_Mutation | c.2987N>A | p.Ser996Asn | p.S996N | Q9Y2K7 | protein_coding | deleterious(0) | benign(0.346) | TCGA-E2-A1B0-01 | Breast | breast invasive carcinoma | Female | <65 | III/IV | Chemotherapy | cytoxan | SD | |
| KDM2A | SNV | Missense_Mutation | novel | c.1228N>C | p.Thr410Pro | p.T410P | Q9Y2K7 | protein_coding | tolerated(0.28) | benign(0.013) | TCGA-E9-A1N5-01 | Breast | breast invasive carcinoma | Female | <65 | I/II | Chemotherapy | doxorubicin | SD |
| KDM2A | SNV | Missense_Mutation | novel | c.1603N>G | p.Ile535Val | p.I535V | Q9Y2K7 | protein_coding | tolerated(0.43) | benign(0.005) | TCGA-E9-A5UO-01 | Breast | breast invasive carcinoma | Female | <65 | I/II | Unknown | Unknown | SD |
| KDM2A | SNV | Missense_Mutation | c.1307G>A | p.Gly436Glu | p.G436E | Q9Y2K7 | protein_coding | tolerated(0.96) | benign(0.007) | TCGA-EW-A1PB-01 | Breast | breast invasive carcinoma | Female | >=65 | III/IV | Unknown | Unknown | SD | |
| KDM2A | SNV | Missense_Mutation | novel | c.2089N>A | p.Val697Met | p.V697M | Q9Y2K7 | protein_coding | tolerated(0.22) | benign(0.06) | TCGA-XX-A899-01 | Breast | breast invasive carcinoma | Female | <65 | III/IV | Chemotherapy | cytoxan | CR |
| KDM2A | insertion | In_Frame_Ins | novel | c.621_622insAAAATAAAAATAAACATTTTTATTATTTAT | p.Cys207_Tyr208insLysIleLysIleAsnIlePheIleIleTyr | p.C207_Y208insKIKINIFIIY | Q9Y2K7 | protein_coding | TCGA-A8-A0A7-01 | Breast | breast invasive carcinoma | Female | <65 | I/II | Unknown | Unknown | SD |
| Page: 1 2 3 4 5 6 7 8 9 10 11 12 |
Top |
Related drugs of malignant transformation related genes |
| Identification of chemicals and drugs interact with genes involved in malignant transfromation |
| (DGIdb 4.0) |
| Entrez ID | Symbol | Category | Interaction Types | Drug Claim Name | Drug Name | PMIDs |
| 22992 | KDM2A | DRUGGABLE GENOME, ENZYME | inhibitor | 178103604 | ||
| 22992 | KDM2A | DRUGGABLE GENOME, ENZYME | inhibitor | 249565909 |
| Page: 1 |

Copyright 2023-Present -The University of Texas Health Science Center at Houston |