Schematic overview of the cellular and molecular mechanisms involved in the cancer progression, including the proposed cellular and molecular mechanisms in cancer cells trajectory. AT1: alveolar type 1 cells; AT2: alveolar type 2 cells; AAH: atypical adenomatous hyperplasia; AIS: adenocarcinoma in situ; MIA: minimally invasive adenocarcinoma; IA: invasive adenocarcinoma; EMT: epithelial-mesenchymal transition

Home

Download

Statistics

Help

Contact

Center for Computational Systems Medicine
leaf

Gene summary

leaf

Malignant transformation analysis

leaf

Malignant transformation related pathway analysis

leaf

Cell-cell communication analysis

leaf

Single-cell gene regulatory network inference analysis

leaf

Somatic mutation of malignant transformation related genes

leaf

Related drugs of malignant transformation related genes

Gene: IP6K2

Gene summary for IP6K2

check button Gene summary.

Gene informationSpeciesHuman
Gene symbol

IP6K2

Gene ID

51447

Gene nameinositol hexakisphosphate kinase 2
Gene AliasIHPK2
Cytomap3p21.31
Gene Typeprotein-coding
GO ID

GO:0001558

UniProtAcc

B2RCP4


Top

Malignant transformation analysis

check button Identification of the aberrant gene expression in precancerous and cancerous lesions by comparing the gene expression of stem-like cells in diseased tissues with normal stem cells
check button Malignant transformation involving gene list.
Entrez IDSymbolReplicatesSpeciesOrganTissueAdj P-valueLog2FCMalignancy
51447IP6K2HTA11_1938_2000001011HumanColorectumAD4.76e-034.88e-01-0.0811
51447IP6K2HTA11_347_2000001011HumanColorectumAD4.01e-146.46e-01-0.1954
51447IP6K2HTA11_696_2000001011HumanColorectumAD9.63e-034.07e-01-0.1464
51447IP6K2HTA11_99999970781_79442HumanColorectumMSS5.09e-065.46e-010.294
51447IP6K2HTA11_99999965104_69814HumanColorectumMSS1.15e-035.42e-010.281
51447IP6K2A002-C-010HumanColorectumFAP3.11e-02-1.35e-010.242
51447IP6K2A015-C-203HumanColorectumFAP5.06e-24-7.95e-02-0.1294
51447IP6K2A015-C-204HumanColorectumFAP1.53e-03-4.43e-02-0.0228
51447IP6K2A002-C-201HumanColorectumFAP4.32e-09-5.00e-020.0324
51447IP6K2A002-C-203HumanColorectumFAP8.36e-05-1.14e-010.2786
51447IP6K2A001-C-119HumanColorectumFAP3.33e-02-1.91e-01-0.1557
51447IP6K2A001-C-108HumanColorectumFAP4.10e-16-1.82e-01-0.0272
51447IP6K2A002-C-205HumanColorectumFAP3.00e-17-2.62e-01-0.1236
51447IP6K2A001-C-104HumanColorectumFAP2.06e-04-1.07e-010.0184
51447IP6K2A015-C-006HumanColorectumFAP8.01e-13-1.88e-01-0.0994
51447IP6K2A015-C-106HumanColorectumFAP6.26e-13-1.10e-01-0.0511
51447IP6K2A002-C-114HumanColorectumFAP1.71e-13-2.26e-01-0.1561
51447IP6K2A015-C-104HumanColorectumFAP5.28e-27-1.49e-01-0.1899
51447IP6K2A001-C-014HumanColorectumFAP1.77e-15-1.89e-010.0135
51447IP6K2A002-C-016HumanColorectumFAP1.08e-19-2.58e-010.0521
Page: 1 2 3 4 5 6 7 8 9 

check button Transcriptomic changes along malignancy continuum.
TissueExpression DynamicsAbbreviation
Colorectum (GSE201348)The image shows the transcriptomic changes along malignancy continuum.log2FC in expression of this searched gene in stem-like cells from each diseased tissue sample relative to stem-like cells in normal samples in each tissue plotted against the malignancy continuum. Samples are colored based on if they are from different disease stage.FAP: Familial adenomatous polyposis
CRC: Colorectal cancer
Colorectum (HTA11)The image shows the transcriptomic changes along malignancy continuum.log2FC in expression of this searched gene in stem-like cells from each diseased tissue sample relative to stem-like cells in normal samples in each tissue plotted against the malignancy continuum. Samples are colored based on if they are from different disease stage.AD: Adenomas
SER: Sessile serrated lesions
MSI-H: Microsatellite-high colorectal cancer
MSS: Microsatellite stable colorectal cancer
EsophagusThe image shows the transcriptomic changes along malignancy continuum.log2FC in expression of this searched gene in stem-like cells from each diseased tissue sample relative to stem-like cells in normal samples in each tissue plotted against the malignancy continuum. Samples are colored based on if they are from different disease stage.
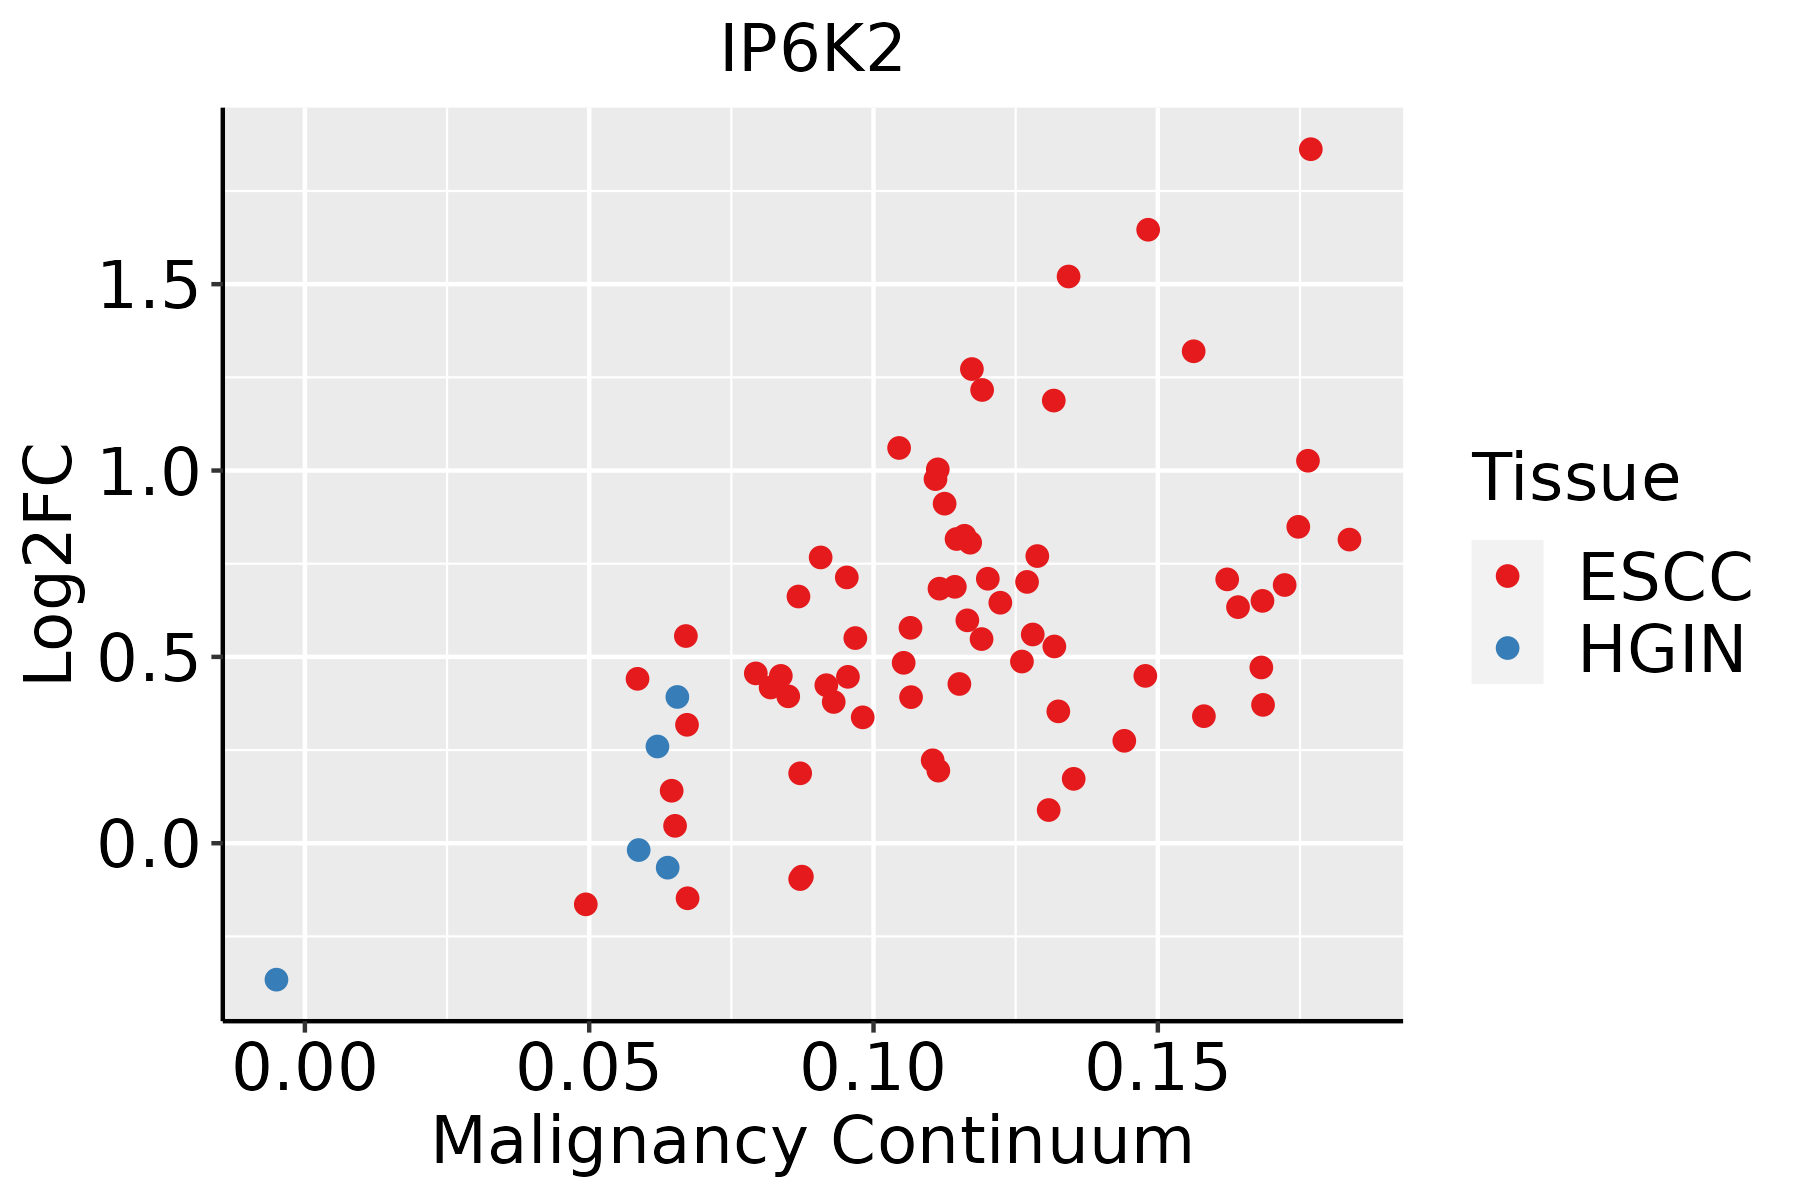
ESCC: Esophageal squamous cell carcinoma
HGIN: High-grade intraepithelial neoplasias
LGIN: Low-grade intraepithelial neoplasias
LiverThe image shows the transcriptomic changes along malignancy continuum.log2FC in expression of this searched gene in stem-like cells from each diseased tissue sample relative to stem-like cells in normal samples in each tissue plotted against the malignancy continuum. Samples are colored based on if they are from different disease stage.
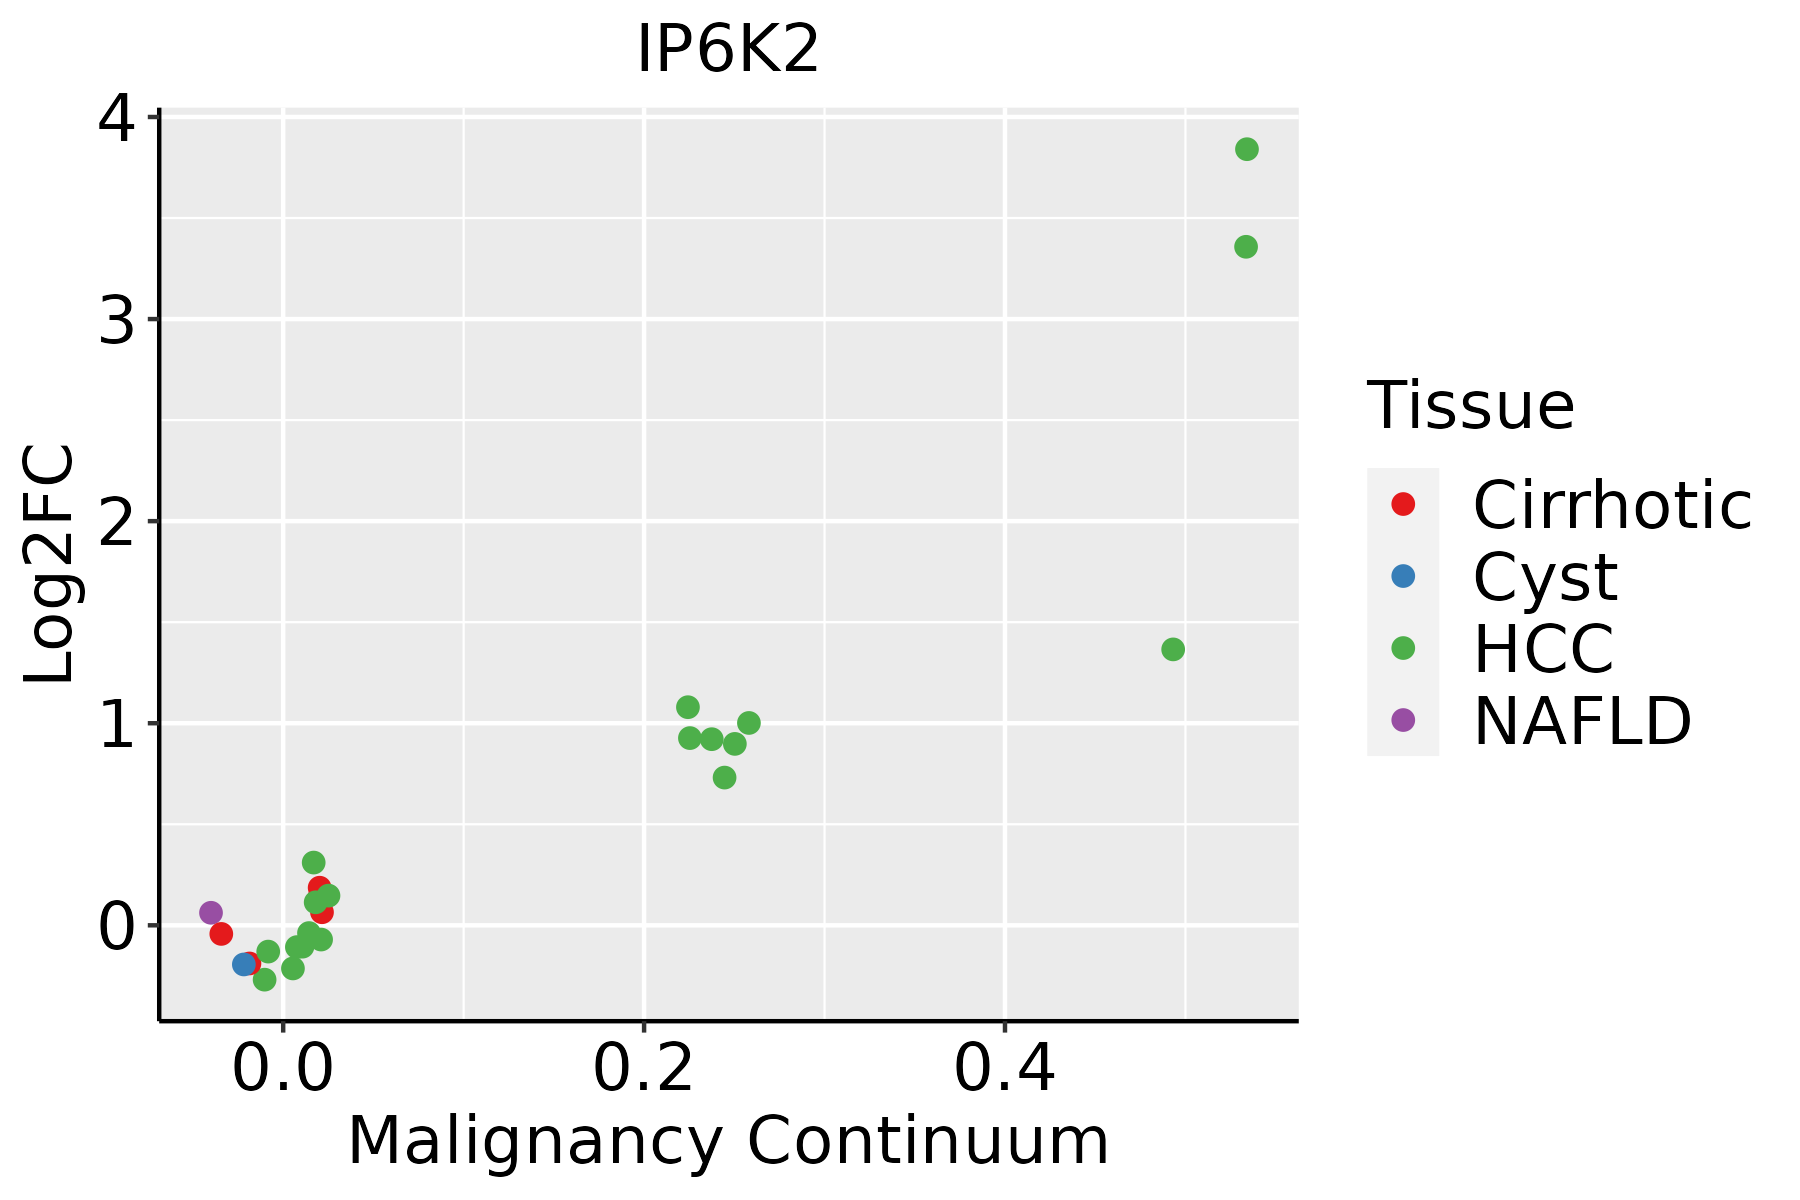
HCC: Hepatocellular carcinoma
NAFLD: Non-alcoholic fatty liver disease
LungThe image shows the transcriptomic changes along malignancy continuum.log2FC in expression of this searched gene in stem-like cells from each diseased tissue sample relative to stem-like cells in normal samples in each tissue plotted against the malignancy continuum. Samples are colored based on if they are from different disease stage.
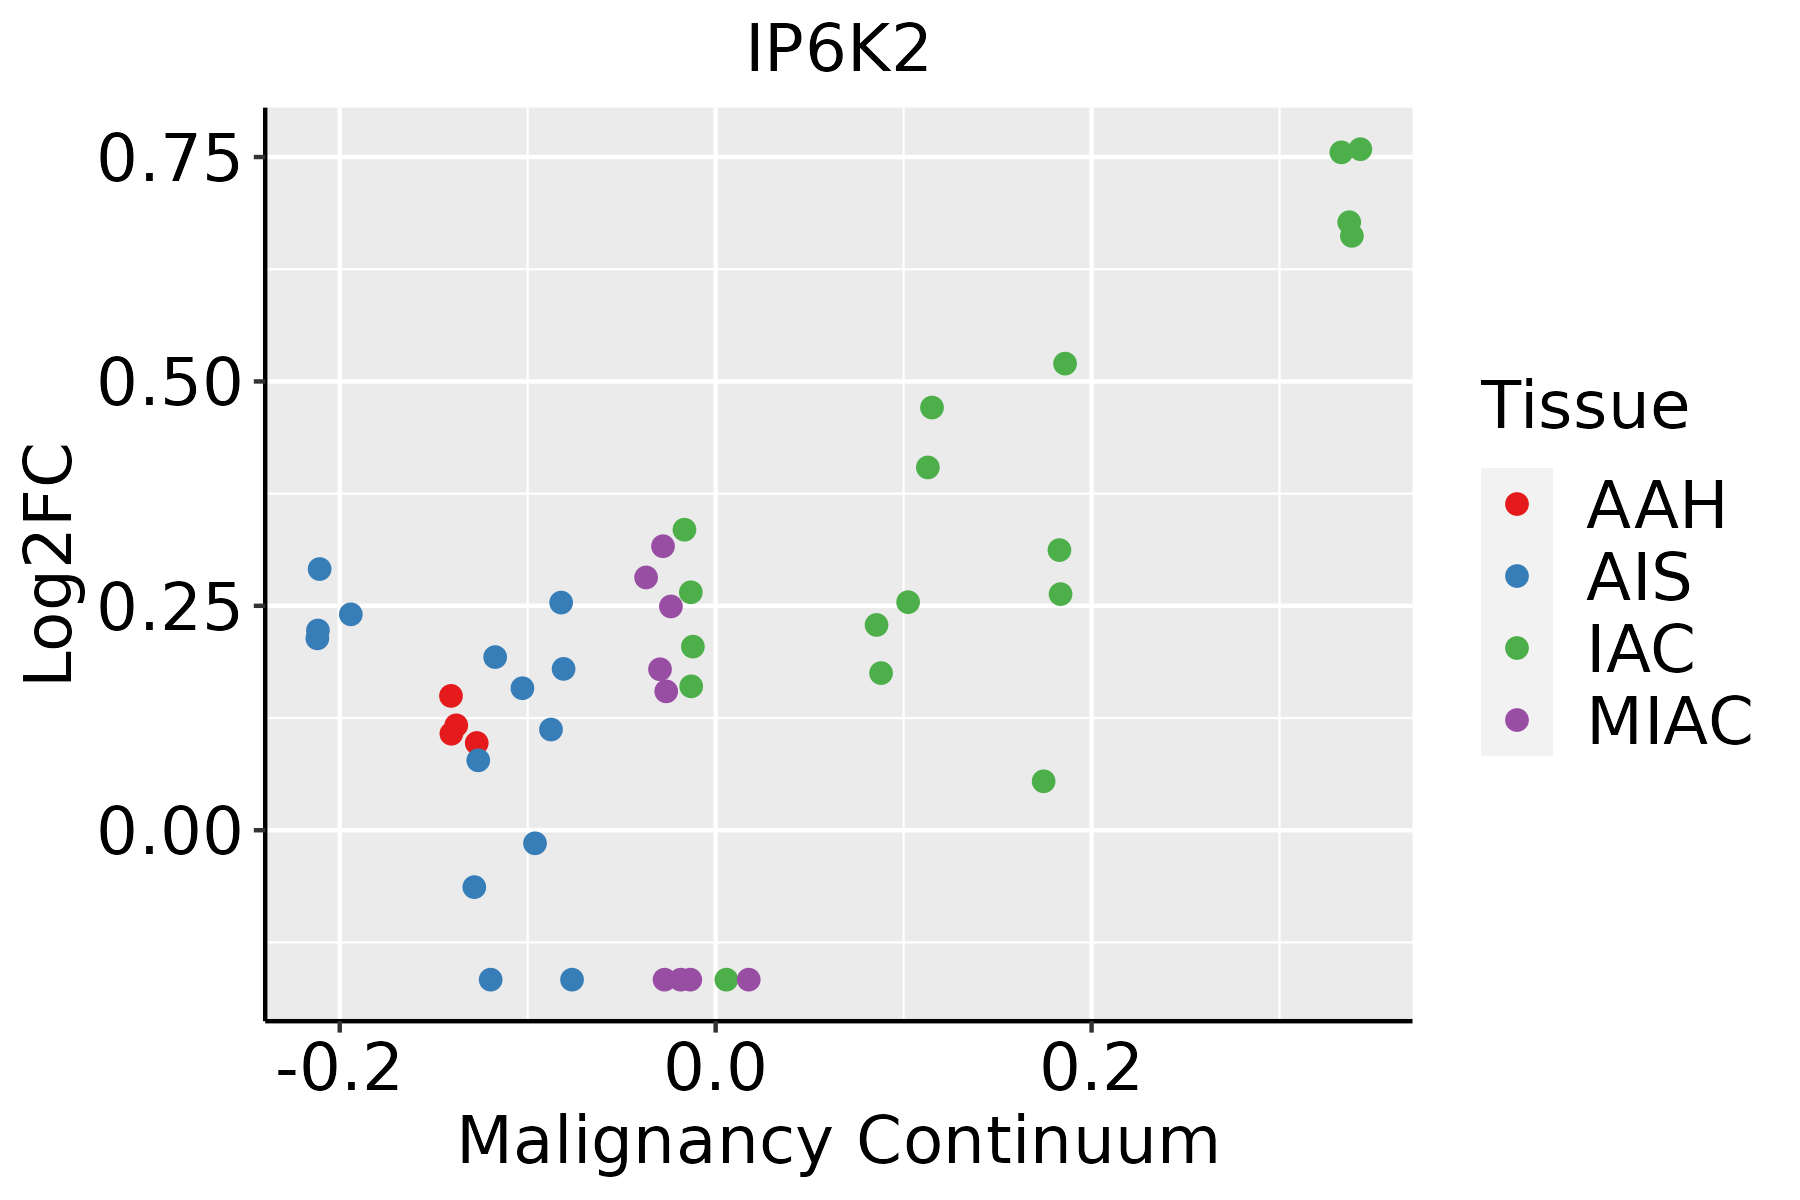
AAH: Atypical adenomatous hyperplasia
AIS: Adenocarcinoma in situ
IAC: Invasive lung adenocarcinoma
MIA: Minimally invasive adenocarcinoma
Oral CavityThe image shows the transcriptomic changes along malignancy continuum.log2FC in expression of this searched gene in stem-like cells from each diseased tissue sample relative to stem-like cells in normal samples in each tissue plotted against the malignancy continuum. Samples are colored based on if they are from different disease stage.
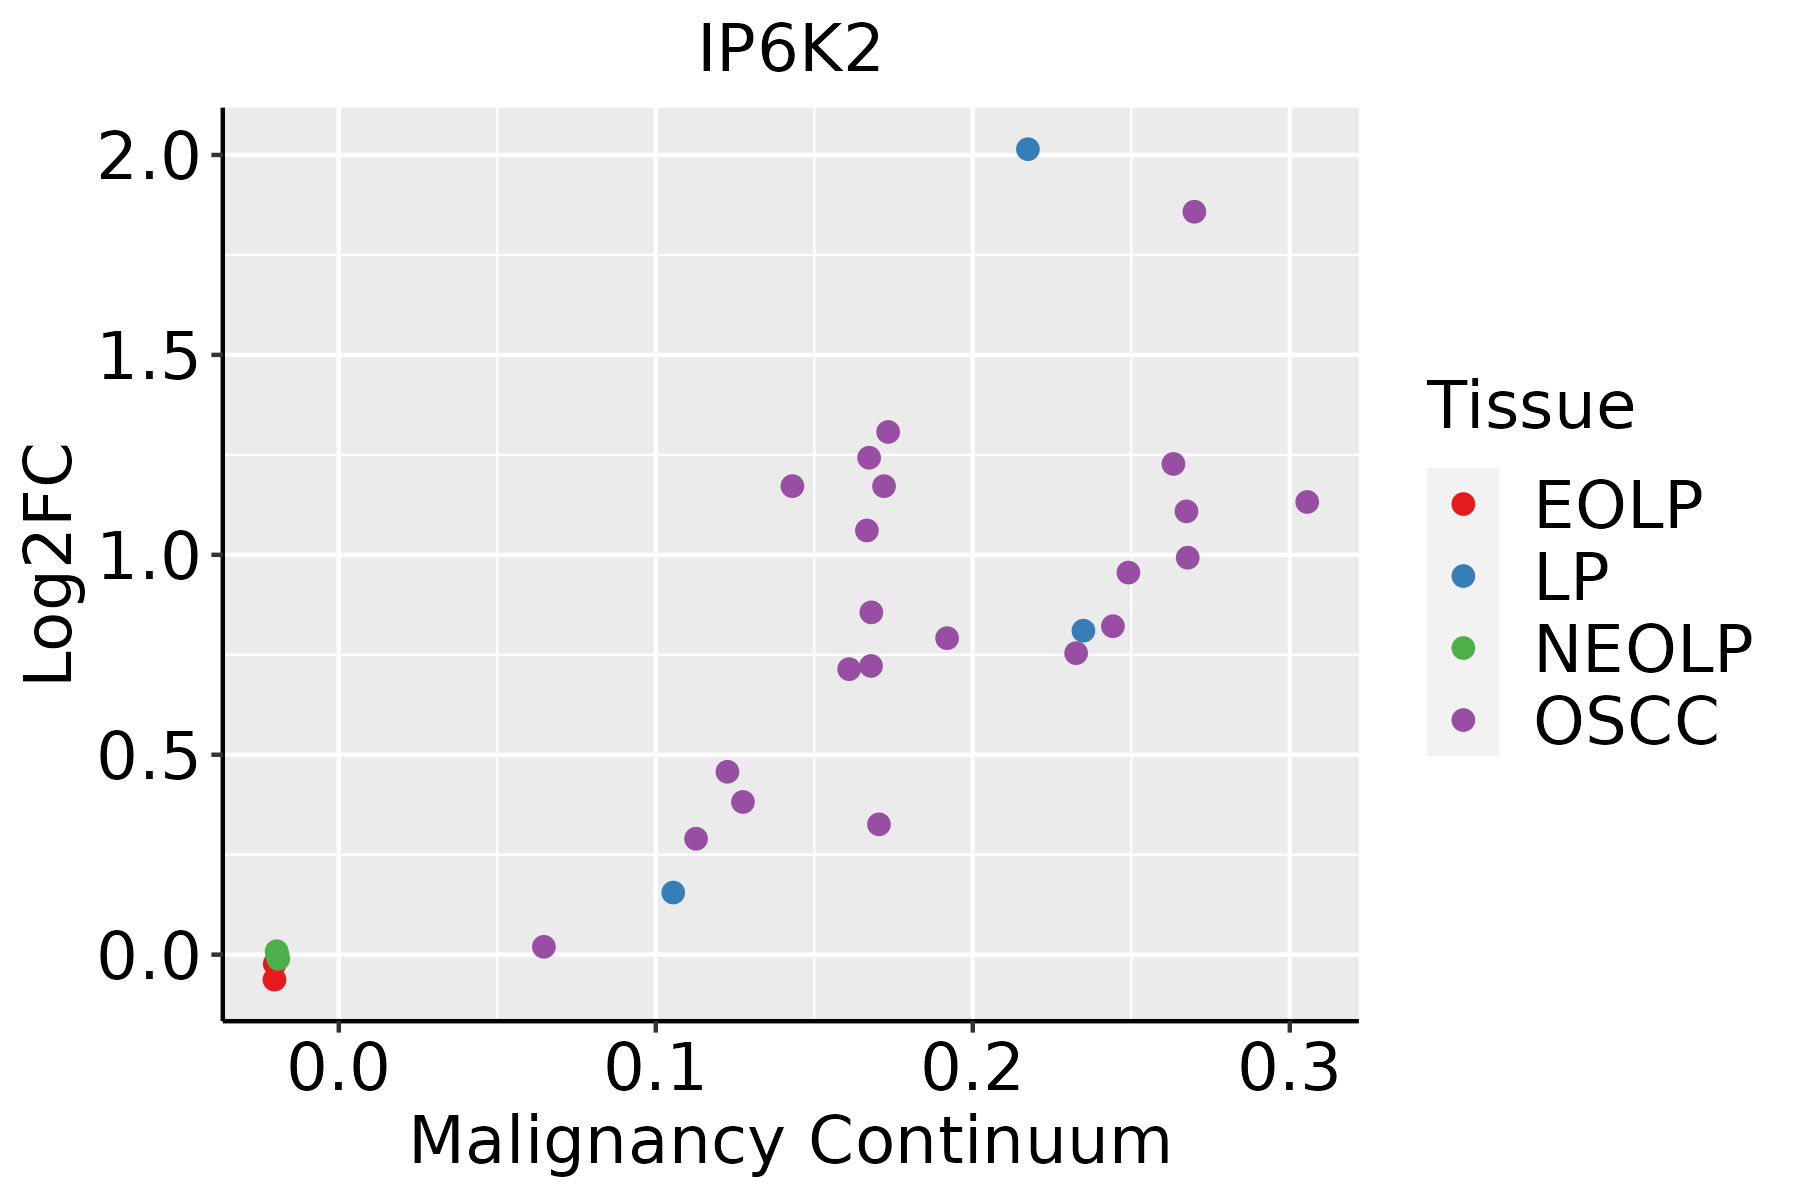
EOLP: Erosive Oral lichen planus
LP: leukoplakia
NEOLP: Non-erosive oral lichen planus
OSCC: Oral squamous cell carcinoma
ProstateThe image shows the transcriptomic changes along malignancy continuum.log2FC in expression of this searched gene in stem-like cells from each diseased tissue sample relative to stem-like cells in normal samples in each tissue plotted against the malignancy continuum. Samples are colored based on if they are from different disease stage.
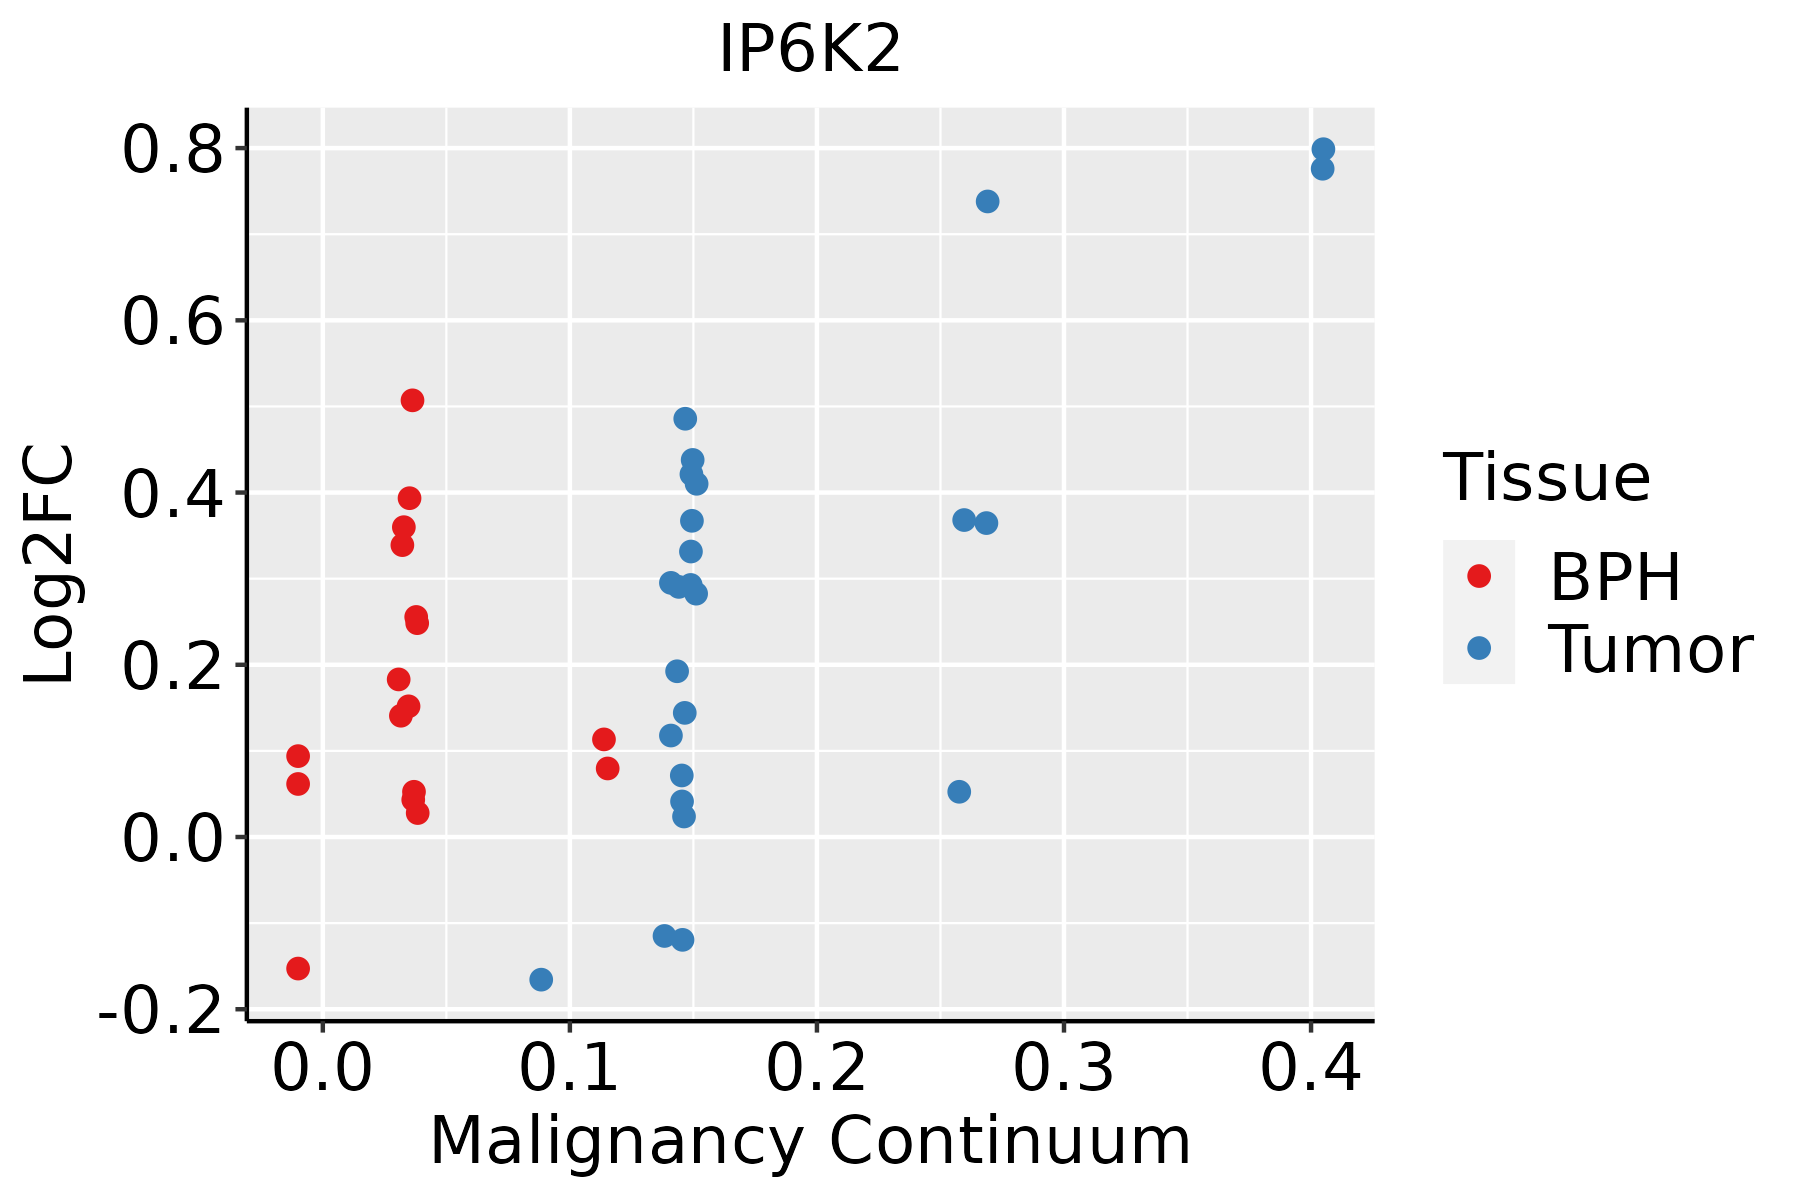
BPH: Benign Prostatic Hyperplasia
SkinThe image shows the transcriptomic changes along malignancy continuum.log2FC in expression of this searched gene in stem-like cells from each diseased tissue sample relative to stem-like cells in normal samples in each tissue plotted against the malignancy continuum. Samples are colored based on if they are from different disease stage.
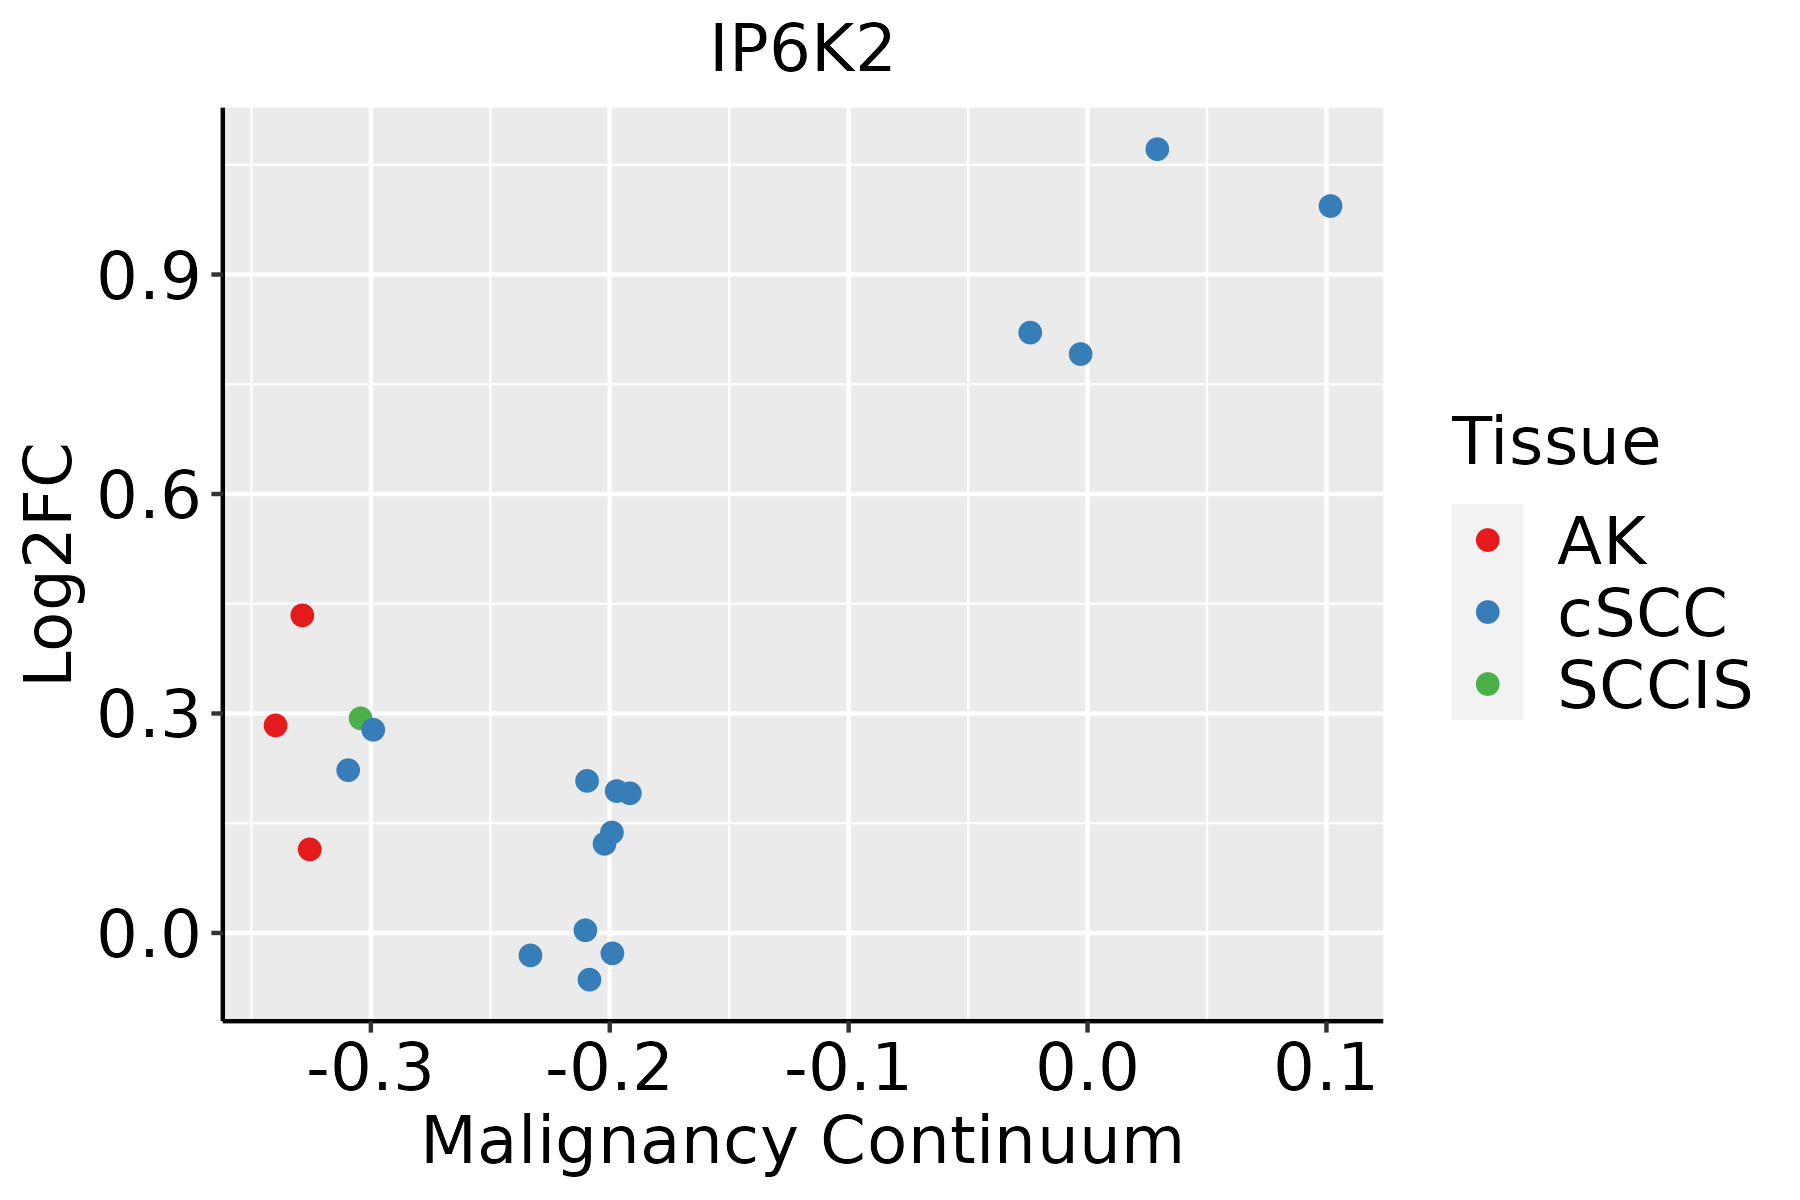
AK: Actinic keratosis
cSCC: Cutaneous squamous cell carcinoma
SCCIS:squamous cell carcinoma in situ
ThyroidThe image shows the transcriptomic changes along malignancy continuum.log2FC in expression of this searched gene in stem-like cells from each diseased tissue sample relative to stem-like cells in normal samples in each tissue plotted against the malignancy continuum. Samples are colored based on if they are from different disease stage.ATC: Anaplastic thyroid cancer
HT: Hashimoto's thyroiditis
PTC: Papillary thyroid cancer
∗log2FC in expression of this searched gene in stem-like cells from each diseased tissue sample relative to stem-like cells in normal samples in each tissue plotted against the malignancy continuum. Samples are colored based on if they are from different disease stage.

Top

Malignant transformation related pathway analysis

check buttonFind out the enriched GO biological processes and KEGG pathways involved in transition from healthy to precancer to cancer
check button Figure of enriched GO biological processes.
TissueDisease StageEnriched GO biological Processes
ColorectumADGO analysis - Figure of enriched GO biological processes: Top 15 enriched GO BP terms are showed in the bar plot of each disease state in each tissue. Each row represents a significant GO biological process which is colored according to the -log10(p.adjust).
ColorectumSERGO analysis - Figure of enriched GO biological processes: Top 15 enriched GO BP terms are showed in the bar plot of each disease state in each tissue. Each row represents a significant GO biological process which is colored according to the -log10(p.adjust).
ColorectumMSSGO analysis - Figure of enriched GO biological processes: Top 15 enriched GO BP terms are showed in the bar plot of each disease state in each tissue. Each row represents a significant GO biological process which is colored according to the -log10(p.adjust).
ColorectumMSI-HGO analysis - Figure of enriched GO biological processes: Top 15 enriched GO BP terms are showed in the bar plot of each disease state in each tissue. Each row represents a significant GO biological process which is colored according to the -log10(p.adjust).
ColorectumFAPGO analysis - Figure of enriched GO biological processes: Top 15 enriched GO BP terms are showed in the bar plot of each disease state in each tissue. Each row represents a significant GO biological process which is colored according to the -log10(p.adjust).
∗Top 15 enriched GO BP terms are showed in the bar plot of each disease state in each tissue. Each row represents a significant GO biological process which is colored according to the -log10(p.adjust).
Page: 1 2 3 4 5 6 7 8 9 

check button Enriched GO biological processes.
GO IDTissueDisease StageDescriptionGene RatioBg Ratiopvaluep.adjustCount
GO:00066505EsophagusESCCglycerophospholipid metabolic process174/8552306/187234.92e-053.85e-04174
GO:00464864EsophagusESCCglycerolipid metabolic process211/8552392/187236.51e-043.46e-03211
GO:00303085EsophagusESCCnegative regulation of cell growth108/8552188/187237.46e-043.87e-03108
GO:00461653EsophagusESCCalcohol biosynthetic process83/8552140/187238.04e-044.16e-0383
GO:19016174EsophagusESCCorganic hydroxy compound biosynthetic process128/8552237/187235.86e-032.16e-02128
GO:00066611EsophagusESCCphosphatidylinositol biosynthetic process73/8552131/187231.31e-024.28e-0273
GO:000606612LiverCirrhoticalcohol metabolic process141/4634353/187231.57e-108.03e-09141
GO:001604911LiverCirrhoticcell growth160/4634482/187231.50e-052.07e-04160
GO:0046165LiverCirrhoticalcohol biosynthetic process55/4634140/187239.74e-051.03e-0355
GO:000155811LiverCirrhoticregulation of cell growth132/4634414/187235.53e-044.36e-03132
GO:19016171LiverCirrhoticorganic hydroxy compound biosynthetic process81/4634237/187236.73e-045.06e-0381
GO:000606621LiverHCCalcohol metabolic process208/7958353/187232.80e-109.50e-09208
GO:001604921LiverHCCcell growth269/7958482/187231.84e-095.35e-08269
GO:00086542LiverHCCphospholipid biosynthetic process150/7958253/187234.77e-081.03e-06150
GO:00066444LiverHCCphospholipid metabolic process214/7958383/187237.25e-081.48e-06214
GO:000155821LiverHCCregulation of cell growth228/7958414/187231.34e-072.55e-06228
GO:004648611LiverHCCglycerolipid metabolic process215/7958392/187234.54e-077.49e-06215
GO:004501711LiverHCCglycerolipid biosynthetic process143/7958252/187233.27e-064.31e-05143
GO:00066504LiverHCCglycerophospholipid metabolic process168/7958306/187237.27e-068.62e-05168
GO:004647411LiverHCCglycerophospholipid biosynthetic process121/7958211/187239.12e-061.06e-04121
Page: 1 2 3 4 5 6 

check button Enriched KEGG pathways.
Pathway IDTissueDisease StageDescriptionGene RatioBg Ratiopvaluep.adjustqvalueCount
hsa04070ColorectumCRCPhosphatidylinositol signaling system25/109197/84654.27e-044.60e-033.12e-0325
hsa040701ColorectumCRCPhosphatidylinositol signaling system25/109197/84654.27e-044.60e-033.12e-0325
Page: 1 

Top

Cell-cell communication analysis

check buttonIdentification of potential cell-cell interactions between two cell types and their ligand-receptor pairs for different disease states
LigandReceptorLRpairPathwayTissueDisease Stage
Page: 1 

Top

Single-cell gene regulatory network inference analysis

check buttonFind out the significant the regulons (TFs) and the target genes of each regulon across cell types for different disease states
TFCell TypeTissueDisease StageTarget GeneRSSRegulon Activity
∗The dot plots of a searched regulon are shown for all cell subpopulations in each disease state of each tissue based on the regulon specific score inferred using pySCENIC and by calculating the average expression.
Page: 1 

Top

Somatic mutation of malignant transformation related genes

check buttonAnnotation of somatic variants for genes involved in malignant transformation
Hugo SymbolVariant ClassVariant ClassificationdbSNP RSHGVScHGVSpHGVSp ShortSWISSPROTBIOTYPESIFTPolyPhenTumor Sample BarcodeTissueHistologySexAgeStageTherapy TypesDrugsOutcome
IP6K2SNVMissense_Mutationc.634C>Ap.Arg212Serp.R212SQ9UHH9protein_codingtolerated(0.14)benign(0.283)TCGA-A8-A09C-01Breastbreast invasive carcinomaFemale>=65I/IIUnknownUnknownSD
IP6K2insertionIn_Frame_Insnovelc.824_825insTTTp.Tyr275_His276insPhep.Y275_H276insFQ9UHH9protein_codingTCGA-A8-A07Z-01Breastbreast invasive carcinomaFemale>=65I/IIUnspecificExemestaneSD
IP6K2insertionFrame_Shift_Insnovelc.823_824insCTTTATTTATTTTAACTATTTCTTCAACATTCCACp.Tyr275SerfsTer49p.Y275Sfs*49Q9UHH9protein_codingTCGA-A8-A07Z-01Breastbreast invasive carcinomaFemale>=65I/IIUnspecificExemestaneSD
IP6K2insertionNonsense_Mutationnovelc.635_636insAGGAATCAGCTGATGAGTCTGCTp.Tyr213GlyfsTer4p.Y213Gfs*4Q9UHH9protein_codingTCGA-A8-A09C-01Breastbreast invasive carcinomaFemale>=65I/IIUnknownUnknownSD
IP6K2insertionIn_Frame_Insnovelc.50_51insGGGGGAAGACTTTGGGAGGATTTTACCCAGAATACTTGCp.Val17_Leu18insGlyGluAspPheGlyArgIleLeuProArgIleLeuAlap.V17_L18insGEDFGRILPRILAQ9UHH9protein_codingTCGA-AN-A0FN-01Breastbreast invasive carcinomaFemale<65I/IIUnknownUnknownSD
IP6K2insertionFrame_Shift_Insnovelc.92_93insGp.Cys31TrpfsTer7p.C31Wfs*7Q9UHH9protein_codingTCGA-B6-A0RH-01Breastbreast invasive carcinomaFemale<65I/IIUnknownUnknownPD
IP6K2deletionFrame_Shift_Delnovelc.354delNp.Lys118AsnfsTer5p.K118Nfs*5Q9UHH9protein_codingTCGA-EW-A2FV-01Breastbreast invasive carcinomaFemale<65III/IVChemotherapydocetaxelSD
IP6K2SNVMissense_Mutationc.1006G>Ap.Asp336Asnp.D336NQ9UHH9protein_codingdeleterious(0.02)probably_damaging(0.995)TCGA-EA-A1QS-01Cervixcervical & endocervical cancerFemale<65I/IIUnknownUnknownSD
IP6K2SNVMissense_Mutationnovelc.703G>Ap.Glu235Lysp.E235KQ9UHH9protein_codingdeleterious(0)probably_damaging(0.996)TCGA-EK-A2RM-01Cervixcervical & endocervical cancerFemale<65I/IIUnknownUnknownSD
IP6K2SNVMissense_Mutationnovelc.177N>Ap.Met59Ilep.M59IQ9UHH9protein_codingtolerated(0.06)benign(0)TCGA-A6-5665-01Colorectumcolon adenocarcinomaFemale>=65I/IIUnknownUnknownPD
Page: 1 2 3 4 

Top

Related drugs of malignant transformation related genes

check buttonIdentification of chemicals and drugs interact with genes involved in malignant transfromation
(DGIdb 4.0)
Entrez IDSymbolCategoryInteraction TypesDrug Claim NameDrug NamePMIDs
Page: 1