
|
|||||
|
 | |
| |
| |
| |
| |
| |
|
Gene: IMPA1 |
Gene summary for IMPA1 |
| Gene information | Species | Human | Gene symbol | IMPA1 | Gene ID | 3612 |
| Gene name | inositol monophosphatase 1 | |
| Gene Alias | IMP | |
| Cytomap | 8q21.13 | |
| Gene Type | protein-coding | GO ID | GO:0005975 | UniProtAcc | A0A140VJL8 |
Top |
Malignant transformation analysis |
| Identification of the aberrant gene expression in precancerous and cancerous lesions by comparing the gene expression of stem-like cells in diseased tissues with normal stem cells |
| Entrez ID | Symbol | Replicates | Species | Organ | Tissue | Adj P-value | Log2FC | Malignancy |
| 3612 | IMPA1 | LZE4T | Human | Esophagus | ESCC | 1.86e-08 | 2.20e-01 | 0.0811 |
| 3612 | IMPA1 | LZE8T | Human | Esophagus | ESCC | 1.93e-09 | 2.57e-01 | 0.067 |
| 3612 | IMPA1 | LZE20T | Human | Esophagus | ESCC | 3.99e-14 | 4.12e-01 | 0.0662 |
| 3612 | IMPA1 | LZE24T | Human | Esophagus | ESCC | 8.73e-15 | 2.79e-01 | 0.0596 |
| 3612 | IMPA1 | LZE6T | Human | Esophagus | ESCC | 7.92e-04 | 2.99e-01 | 0.0845 |
| 3612 | IMPA1 | P2T-E | Human | Esophagus | ESCC | 1.00e-16 | 2.10e-01 | 0.1177 |
| 3612 | IMPA1 | P4T-E | Human | Esophagus | ESCC | 6.95e-22 | 4.33e-01 | 0.1323 |
| 3612 | IMPA1 | P5T-E | Human | Esophagus | ESCC | 1.22e-14 | 3.09e-01 | 0.1327 |
| 3612 | IMPA1 | P8T-E | Human | Esophagus | ESCC | 4.21e-20 | 2.41e-01 | 0.0889 |
| 3612 | IMPA1 | P9T-E | Human | Esophagus | ESCC | 4.94e-11 | 2.08e-01 | 0.1131 |
| 3612 | IMPA1 | P10T-E | Human | Esophagus | ESCC | 1.43e-21 | 1.70e-01 | 0.116 |
| 3612 | IMPA1 | P11T-E | Human | Esophagus | ESCC | 6.50e-13 | 3.96e-01 | 0.1426 |
| 3612 | IMPA1 | P12T-E | Human | Esophagus | ESCC | 1.30e-12 | 2.83e-01 | 0.1122 |
| 3612 | IMPA1 | P15T-E | Human | Esophagus | ESCC | 1.08e-17 | 3.31e-01 | 0.1149 |
| 3612 | IMPA1 | P16T-E | Human | Esophagus | ESCC | 4.33e-18 | 4.32e-01 | 0.1153 |
| 3612 | IMPA1 | P17T-E | Human | Esophagus | ESCC | 8.17e-04 | 2.74e-01 | 0.1278 |
| 3612 | IMPA1 | P19T-E | Human | Esophagus | ESCC | 2.31e-09 | 5.28e-01 | 0.1662 |
| 3612 | IMPA1 | P20T-E | Human | Esophagus | ESCC | 4.35e-16 | 3.78e-01 | 0.1124 |
| 3612 | IMPA1 | P21T-E | Human | Esophagus | ESCC | 7.09e-14 | 2.47e-01 | 0.1617 |
| 3612 | IMPA1 | P22T-E | Human | Esophagus | ESCC | 4.10e-10 | 1.12e-01 | 0.1236 |
| Page: 1 2 3 4 5 6 |
| Tissue | Expression Dynamics | Abbreviation |
| Esophagus |  | ESCC: Esophageal squamous cell carcinoma |
| HGIN: High-grade intraepithelial neoplasias | ||
| LGIN: Low-grade intraepithelial neoplasias | ||
| Liver | 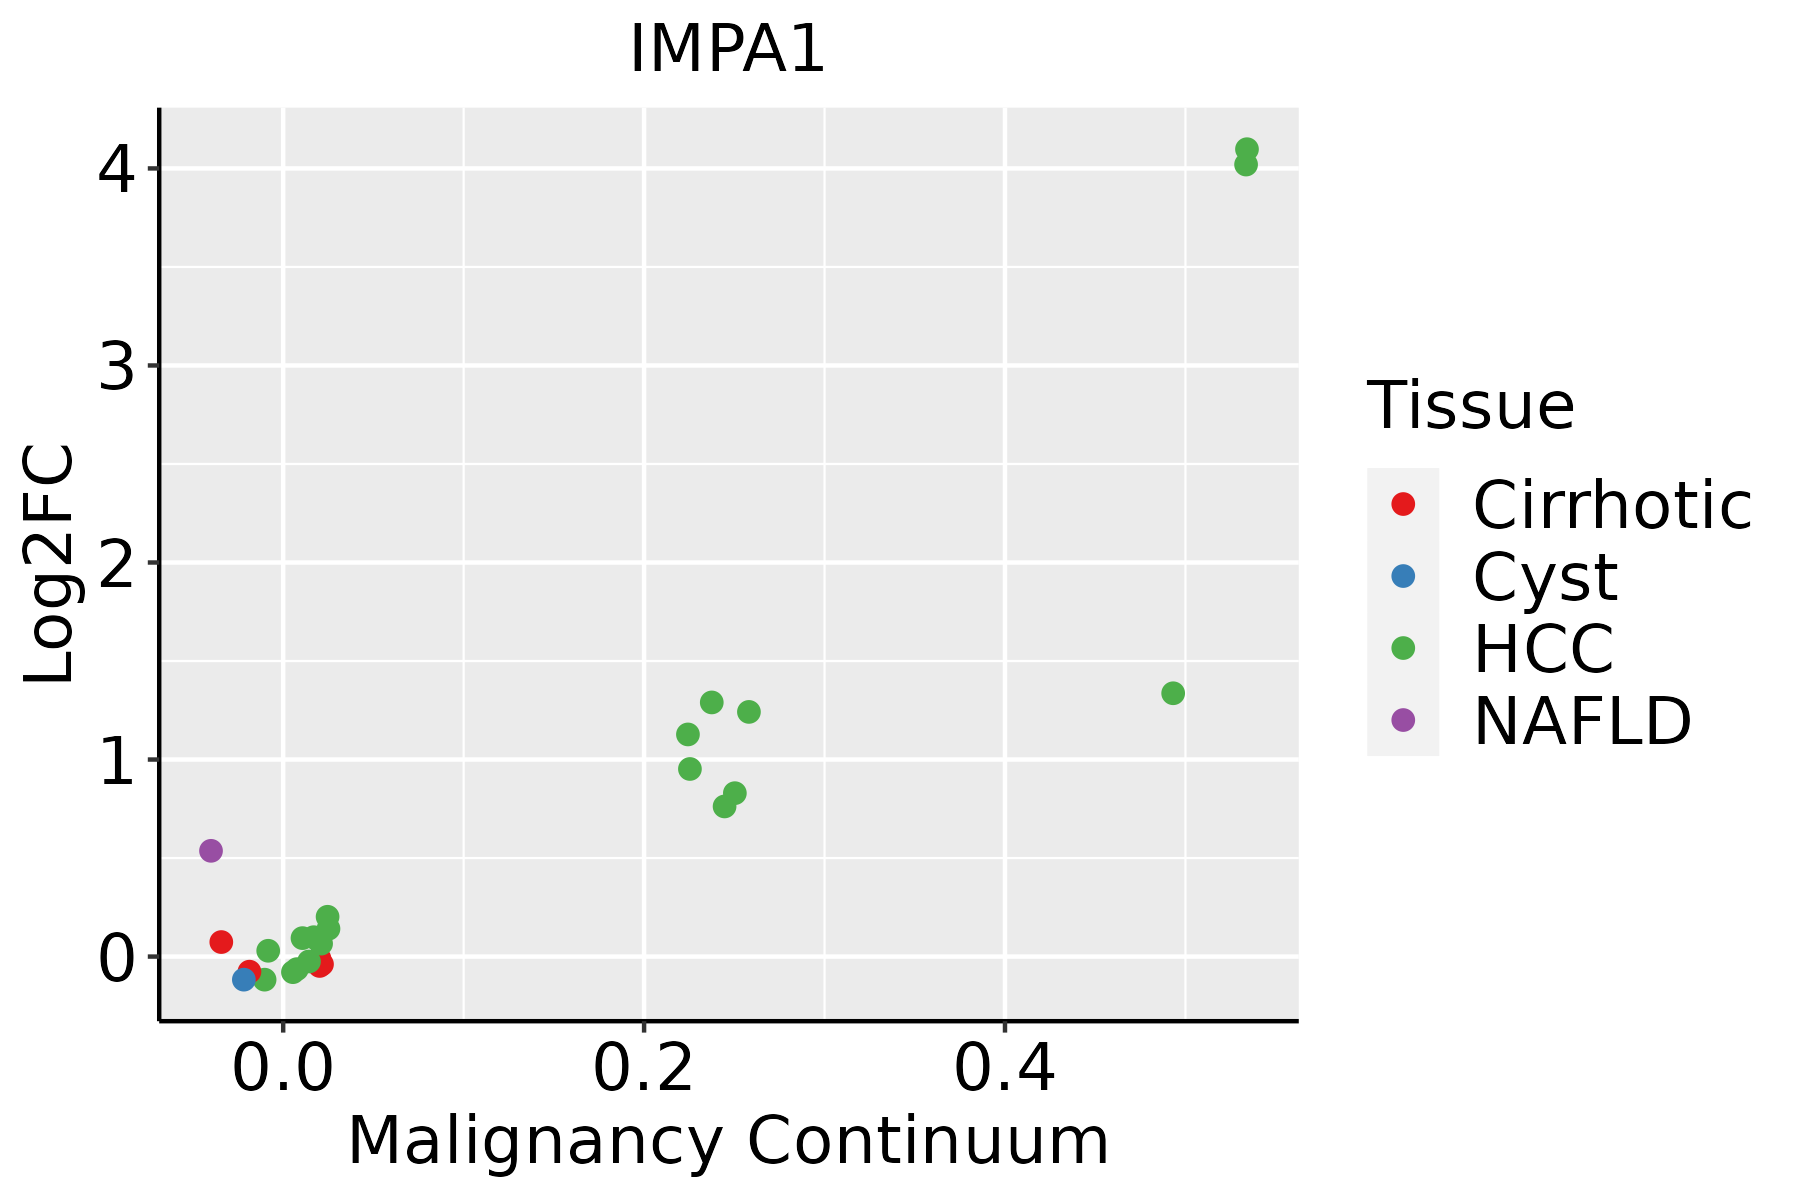 | HCC: Hepatocellular carcinoma |
| NAFLD: Non-alcoholic fatty liver disease | ||
| Oral Cavity | 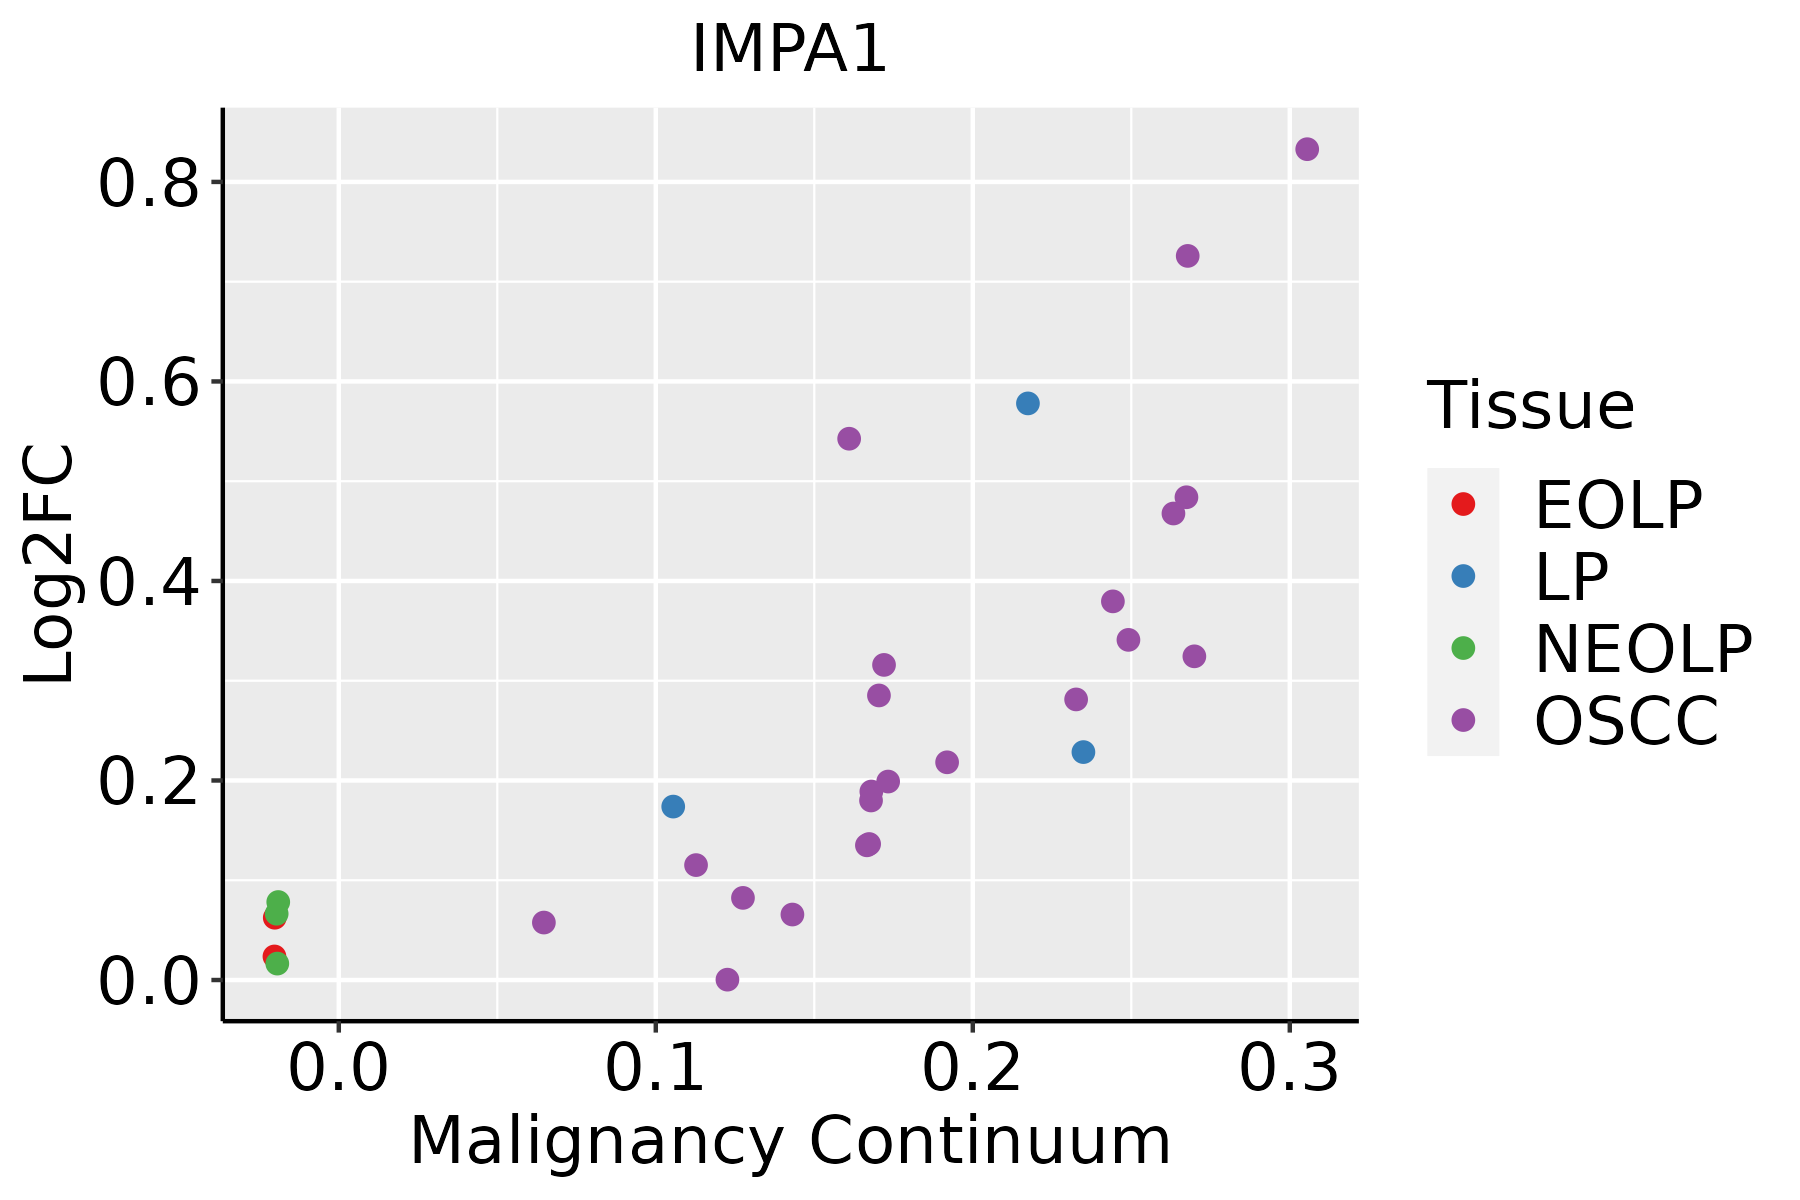 | EOLP: Erosive Oral lichen planus |
| LP: leukoplakia | ||
| NEOLP: Non-erosive oral lichen planus | ||
| OSCC: Oral squamous cell carcinoma | ||
| Skin | 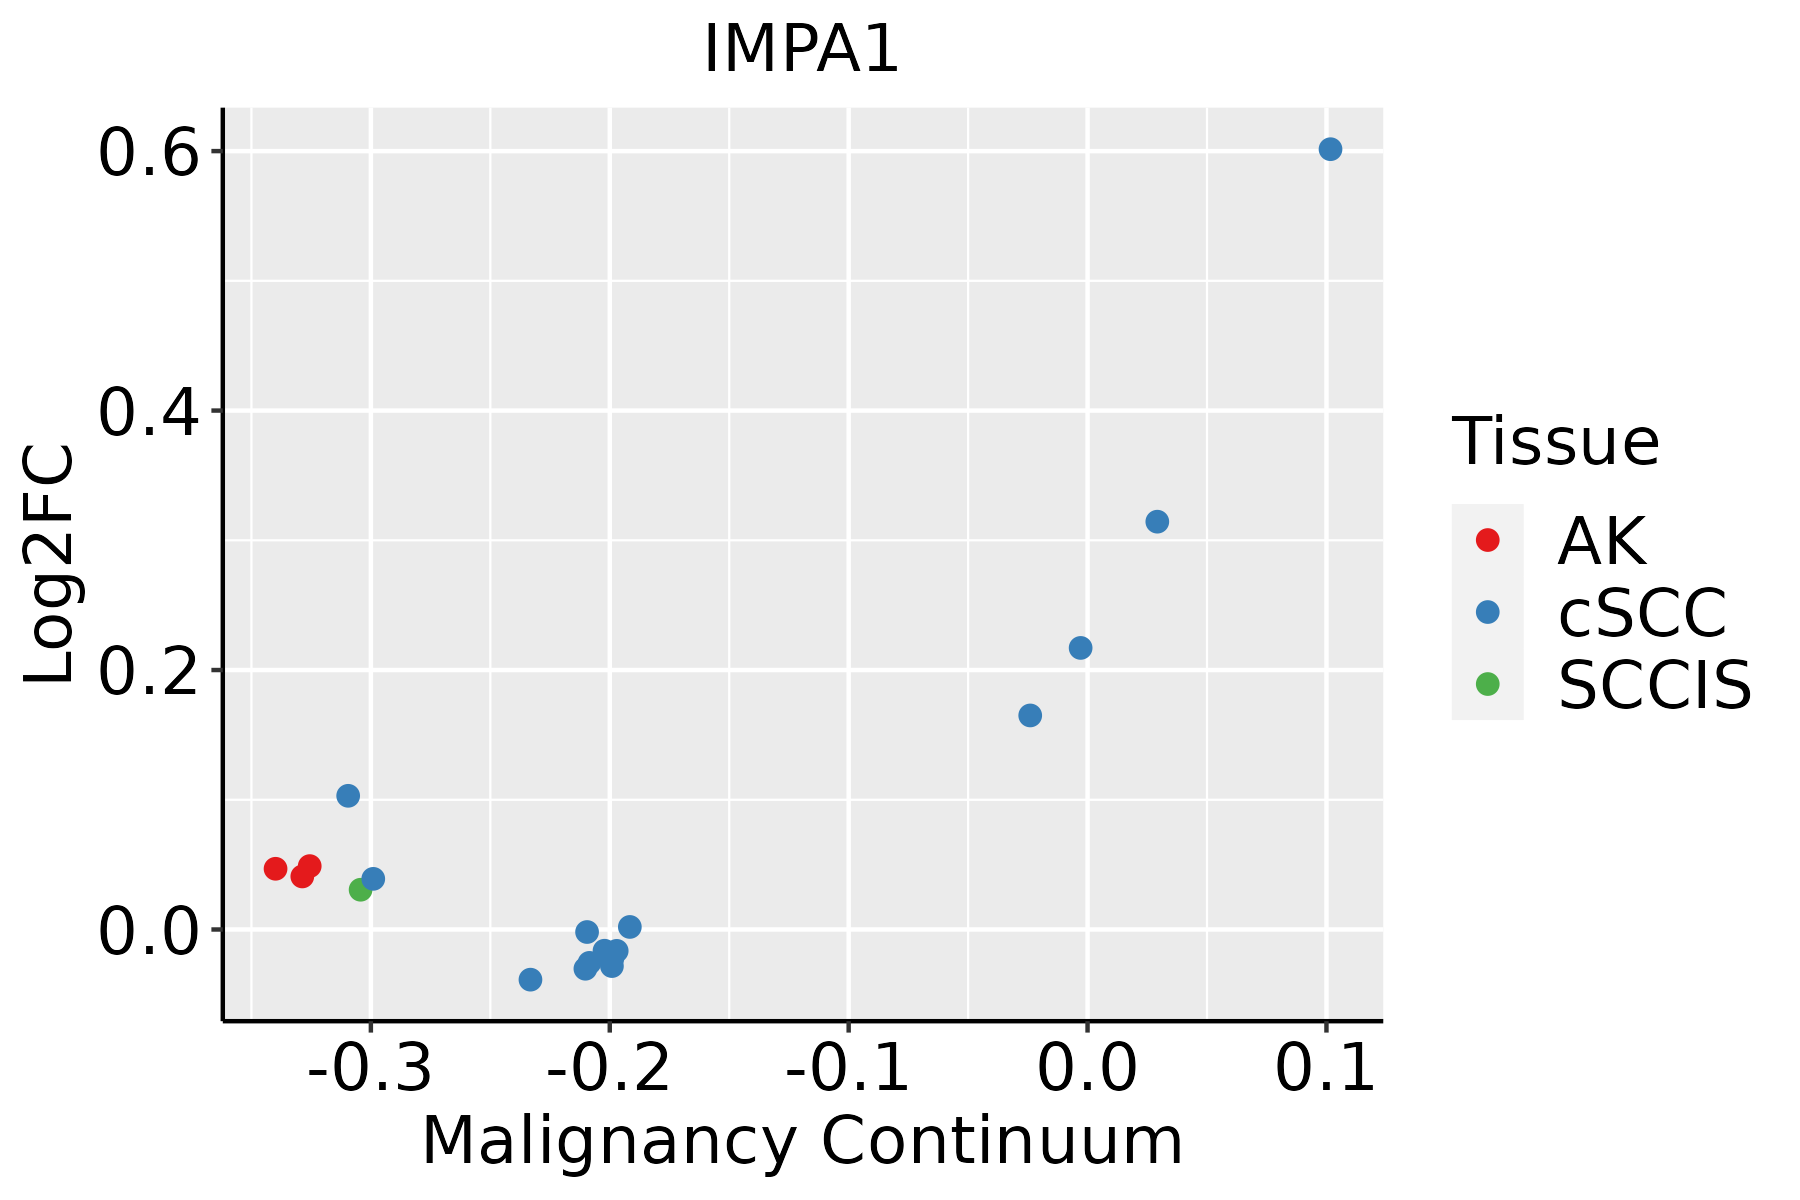 | AK: Actinic keratosis |
| cSCC: Cutaneous squamous cell carcinoma | ||
| SCCIS:squamous cell carcinoma in situ | ||
| Thyroid | 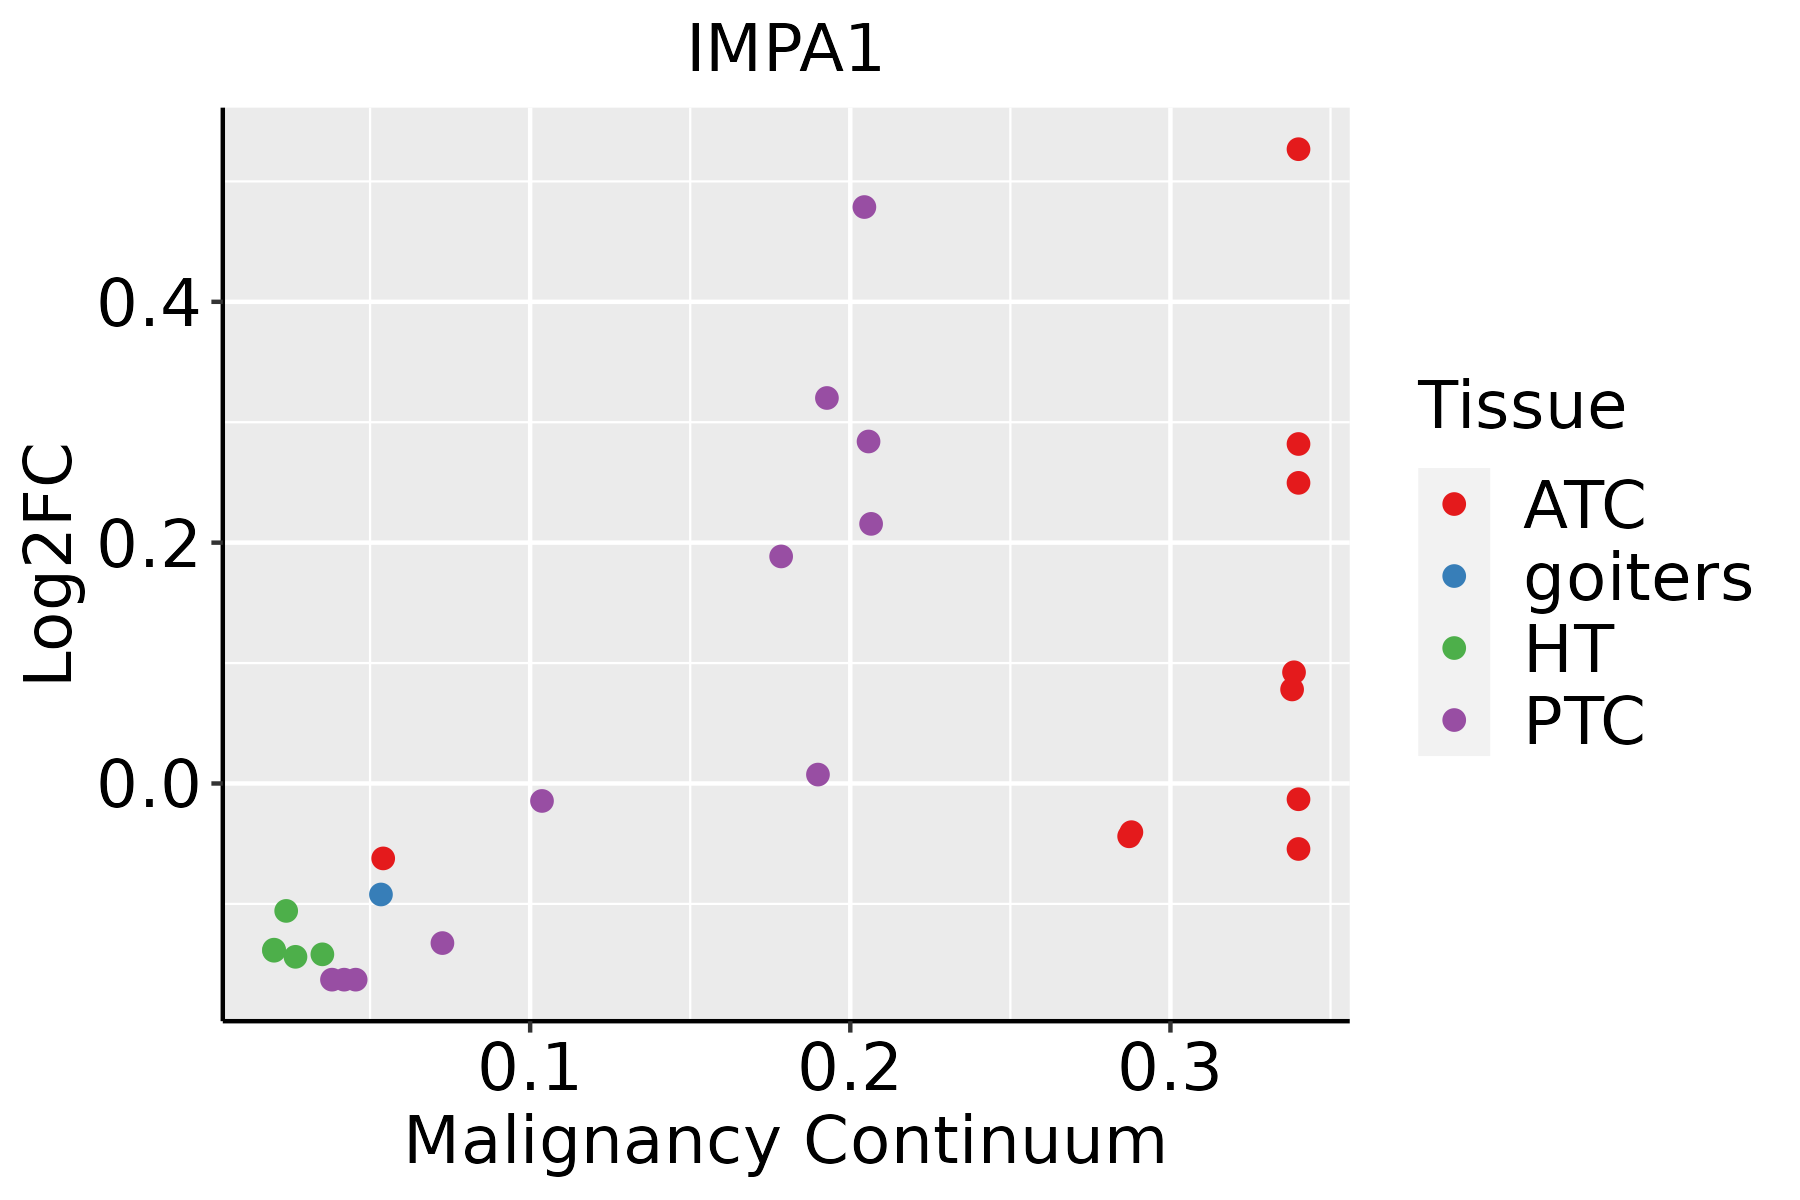 | ATC: Anaplastic thyroid cancer |
| HT: Hashimoto's thyroiditis | ||
| PTC: Papillary thyroid cancer |
| ∗log2FC in expression of this searched gene in stem-like cells from each diseased tissue sample relative to stem-like cells in normal samples in each tissue plotted against the malignancy continuum. Samples are colored based on if they are from different disease stage. |
Top |
Malignant transformation related pathway analysis |
| Find out the enriched GO biological processes and KEGG pathways involved in transition from healthy to precancer to cancer |
| Tissue | Disease Stage | Enriched GO biological Processes |
| Colorectum | AD |  |
| Colorectum | SER |  |
| Colorectum | MSS |  |
| Colorectum | MSI-H |  |
| Colorectum | FAP |  |
| ∗Top 15 enriched GO BP terms are showed in the bar plot of each disease state in each tissue. Each row represents a significant GO biological process which is colored according to the -log10(p.adjust). |
| Page: 1 2 3 4 5 6 7 8 9 |
| GO ID | Tissue | Disease Stage | Description | Gene Ratio | Bg Ratio | pvalue | p.adjust | Count |
| GO:004501711 | Liver | HCC | glycerolipid biosynthetic process | 143/7958 | 252/18723 | 3.27e-06 | 4.31e-05 | 143 |
| GO:00066504 | Liver | HCC | glycerophospholipid metabolic process | 168/7958 | 306/18723 | 7.27e-06 | 8.62e-05 | 168 |
| GO:004647411 | Liver | HCC | glycerophospholipid biosynthetic process | 121/7958 | 211/18723 | 9.12e-06 | 1.06e-04 | 121 |
| GO:004426221 | Liver | HCC | cellular carbohydrate metabolic process | 153/7958 | 283/18723 | 5.27e-05 | 5.00e-04 | 153 |
| GO:00160512 | Liver | HCC | carbohydrate biosynthetic process | 113/7958 | 202/18723 | 7.64e-05 | 6.83e-04 | 113 |
| GO:00464342 | Liver | HCC | organophosphate catabolic process | 89/7958 | 155/18723 | 1.24e-04 | 1.03e-03 | 89 |
| GO:19016172 | Liver | HCC | organic hydroxy compound biosynthetic process | 129/7958 | 237/18723 | 1.32e-04 | 1.08e-03 | 129 |
| GO:00461651 | Liver | HCC | alcohol biosynthetic process | 81/7958 | 140/18723 | 1.73e-04 | 1.36e-03 | 81 |
| GO:00461642 | Liver | HCC | alcohol catabolic process | 33/7958 | 55/18723 | 6.63e-03 | 2.69e-02 | 33 |
| GO:00346371 | Liver | HCC | cellular carbohydrate biosynthetic process | 44/7958 | 78/18723 | 9.13e-03 | 3.51e-02 | 44 |
| GO:0006661 | Liver | HCC | phosphatidylinositol biosynthetic process | 69/7958 | 131/18723 | 1.19e-02 | 4.35e-02 | 69 |
| GO:00163119 | Oral cavity | OSCC | dephosphorylation | 220/7305 | 417/18723 | 6.33e-09 | 1.34e-07 | 220 |
| GO:00060667 | Oral cavity | OSCC | alcohol metabolic process | 179/7305 | 353/18723 | 4.54e-06 | 5.21e-05 | 179 |
| GO:00086543 | Oral cavity | OSCC | phospholipid biosynthetic process | 130/7305 | 253/18723 | 3.96e-05 | 3.46e-04 | 130 |
| GO:00461652 | Oral cavity | OSCC | alcohol biosynthetic process | 77/7305 | 140/18723 | 8.77e-05 | 6.70e-04 | 77 |
| GO:19016173 | Oral cavity | OSCC | organic hydroxy compound biosynthetic process | 115/7305 | 237/18723 | 1.73e-03 | 8.18e-03 | 115 |
| GO:00442826 | Oral cavity | OSCC | small molecule catabolic process | 174/7305 | 376/18723 | 2.25e-03 | 1.00e-02 | 174 |
| GO:00464743 | Oral cavity | OSCC | glycerophospholipid biosynthetic process | 102/7305 | 211/18723 | 3.50e-03 | 1.48e-02 | 102 |
| GO:00066445 | Oral cavity | OSCC | phospholipid metabolic process | 175/7305 | 383/18723 | 4.21e-03 | 1.71e-02 | 175 |
| GO:00160513 | Oral cavity | OSCC | carbohydrate biosynthetic process | 97/7305 | 202/18723 | 5.50e-03 | 2.13e-02 | 97 |
| Page: 1 2 3 4 |
| Pathway ID | Tissue | Disease Stage | Description | Gene Ratio | Bg Ratio | pvalue | p.adjust | qvalue | Count |
| Page: 1 |
Top |
Cell-cell communication analysis |
| Identification of potential cell-cell interactions between two cell types and their ligand-receptor pairs for different disease states |
| Ligand | Receptor | LRpair | Pathway | Tissue | Disease Stage |
| Page: 1 |
Top |
Single-cell gene regulatory network inference analysis |
| Find out the significant the regulons (TFs) and the target genes of each regulon across cell types for different disease states |
| TF | Cell Type | Tissue | Disease Stage | Target Gene | RSS | Regulon Activity |
| ∗The dot plots of a searched regulon are shown for all cell subpopulations in each disease state of each tissue based on the regulon specific score inferred using pySCENIC and by calculating the average expression. |
| Page: 1 |
Top |
Somatic mutation of malignant transformation related genes |
| Annotation of somatic variants for genes involved in malignant transformation |
| Hugo Symbol | Variant Class | Variant Classification | dbSNP RS | HGVSc | HGVSp | HGVSp Short | SWISSPROT | BIOTYPE | SIFT | PolyPhen | Tumor Sample Barcode | Tissue | Histology | Sex | Age | Stage | Therapy Types | Drugs | Outcome |
| IMPA1 | SNV | Missense_Mutation | c.122N>C | p.Ser41Thr | p.S41T | P29218 | protein_coding | tolerated_low_confidence(0.42) | benign(0.001) | TCGA-A7-A0DA-01 | Breast | breast invasive carcinoma | Female | <65 | I/II | Chemotherapy | adriamycin | SD | |
| IMPA1 | SNV | Missense_Mutation | c.116N>C | p.Gly39Ala | p.G39A | P29218 | protein_coding | deleterious_low_confidence(0.04) | benign(0.081) | TCGA-AC-A23H-01 | Breast | breast invasive carcinoma | Female | >=65 | I/II | Unknown | Unknown | PD | |
| IMPA1 | deletion | Frame_Shift_Del | c.970delG | p.Glu324LysfsTer15 | p.E324Kfs*15 | P29218 | protein_coding | TCGA-A7-A4SA-01 | Breast | breast invasive carcinoma | Female | <65 | I/II | Chemotherapy | doxorubicin | CR | |||
| IMPA1 | deletion | In_Frame_Del | novel | c.746_748delNNN | p.Ile249del | p.I249del | P29218 | protein_coding | TCGA-AN-A0FN-01 | Breast | breast invasive carcinoma | Female | <65 | I/II | Unknown | Unknown | SD | ||
| IMPA1 | SNV | Missense_Mutation | novel | c.788C>G | p.Ala263Gly | p.A263G | P29218 | protein_coding | deleterious(0) | probably_damaging(0.914) | TCGA-EA-A97N-01 | Cervix | cervical & endocervical cancer | Female | <65 | I/II | Unknown | Unknown | SD |
| IMPA1 | SNV | Missense_Mutation | c.959N>T | p.Arg320Met | p.R320M | P29218 | protein_coding | tolerated(0.06) | benign(0.061) | TCGA-A6-3809-01 | Colorectum | colon adenocarcinoma | Female | >=65 | I/II | Unknown | Unknown | SD | |
| IMPA1 | SNV | Missense_Mutation | c.703N>A | p.Leu235Ile | p.L235I | P29218 | protein_coding | tolerated(0.13) | benign(0.184) | TCGA-AA-3510-01 | Colorectum | colon adenocarcinoma | Male | >=65 | I/II | Unknown | Unknown | SD | |
| IMPA1 | SNV | Missense_Mutation | novel | c.689N>A | p.Thr230Asn | p.T230N | P29218 | protein_coding | tolerated(0.16) | benign(0.011) | TCGA-AA-3984-01 | Colorectum | colon adenocarcinoma | Female | <65 | I/II | Unknown | Unknown | SD |
| IMPA1 | SNV | Missense_Mutation | novel | c.259N>C | p.Lys87Gln | p.K87Q | P29218 | protein_coding | tolerated(0.34) | benign(0.001) | TCGA-F5-6814-01 | Colorectum | rectum adenocarcinoma | Male | <65 | I/II | Unknown | Unknown | SD |
| IMPA1 | SNV | Missense_Mutation | rs767783535 | c.1000G>A | p.Asp334Asn | p.D334N | P29218 | protein_coding | deleterious(0) | probably_damaging(0.946) | TCGA-A5-A0GP-01 | Endometrium | uterine corpus endometrioid carcinoma | Female | <65 | I/II | Unknown | Unknown | SD |
| Page: 1 2 3 4 |
Top |
Related drugs of malignant transformation related genes |
| Identification of chemicals and drugs interact with genes involved in malignant transfromation |
| (DGIdb 4.0) |
| Entrez ID | Symbol | Category | Interaction Types | Drug Claim Name | Drug Name | PMIDs |
| 3612 | IMPA1 | ENZYME, DRUGGABLE GENOME | inhibitor | CHEMBL2103738 | LITHIUM CITRATE | |
| 3612 | IMPA1 | ENZYME, DRUGGABLE GENOME | inhibitor | 178101897 | ||
| 3612 | IMPA1 | ENZYME, DRUGGABLE GENOME | inhibitor | CHEMBL1200826 | LITHIUM CARBONATE |
| Page: 1 |

Copyright 2023-Present -The University of Texas Health Science Center at Houston |