
|
|||||
|
 | |
| |
| |
| |
| |
| |
|
Gene: IGF2 |
Gene summary for IGF2 |
| Gene information | Species | Human | Gene symbol | IGF2 | Gene ID | 3481 |
| Gene name | insulin like growth factor 2 | |
| Gene Alias | C11orf43 | |
| Cytomap | 11p15.5 | |
| Gene Type | protein-coding | GO ID | GO:0000003 | UniProtAcc | P01344 |
Top |
Malignant transformation analysis |
| Identification of the aberrant gene expression in precancerous and cancerous lesions by comparing the gene expression of stem-like cells in diseased tissues with normal stem cells |
| Entrez ID | Symbol | Replicates | Species | Organ | Tissue | Adj P-value | Log2FC | Malignancy |
| 3481 | IGF2 | AEH-subject1 | Human | Endometrium | AEH | 1.02e-48 | -8.01e-01 | -0.3059 |
| 3481 | IGF2 | AEH-subject2 | Human | Endometrium | AEH | 1.16e-48 | -8.12e-01 | -0.2525 |
| 3481 | IGF2 | AEH-subject3 | Human | Endometrium | AEH | 9.30e-53 | -8.12e-01 | -0.2576 |
| 3481 | IGF2 | AEH-subject4 | Human | Endometrium | AEH | 2.00e-35 | -8.06e-01 | -0.2657 |
| 3481 | IGF2 | AEH-subject5 | Human | Endometrium | AEH | 9.30e-53 | -8.12e-01 | -0.2953 |
| 3481 | IGF2 | EEC-subject1 | Human | Endometrium | EEC | 7.22e-51 | -8.10e-01 | -0.2682 |
| 3481 | IGF2 | EEC-subject2 | Human | Endometrium | EEC | 2.12e-50 | -8.12e-01 | -0.2607 |
| 3481 | IGF2 | EEC-subject3 | Human | Endometrium | EEC | 3.04e-51 | -8.06e-01 | -0.2525 |
| 3481 | IGF2 | EEC-subject4 | Human | Endometrium | EEC | 2.12e-50 | -8.07e-01 | -0.2571 |
| 3481 | IGF2 | EEC-subject5 | Human | Endometrium | EEC | 6.20e-50 | -8.12e-01 | -0.249 |
| 3481 | IGF2 | GSM5276934 | Human | Endometrium | EEC | 2.45e-51 | -8.12e-01 | -0.0913 |
| 3481 | IGF2 | GSM5276935 | Human | Endometrium | EEC | 3.66e-55 | -8.12e-01 | -0.123 |
| 3481 | IGF2 | GSM5276937 | Human | Endometrium | EEC | 5.68e-46 | -8.12e-01 | -0.0897 |
| 3481 | IGF2 | GSM6177620_NYU_UCEC1_lib1_lib1 | Human | Endometrium | EEC | 2.07e-40 | -8.12e-01 | -0.1869 |
| 3481 | IGF2 | GSM6177620_NYU_UCEC1_lib2_lib2 | Human | Endometrium | EEC | 4.42e-33 | -7.96e-01 | -0.1875 |
| 3481 | IGF2 | GSM6177620_NYU_UCEC1_lib3_lib3 | Human | Endometrium | EEC | 1.38e-39 | -7.91e-01 | -0.1883 |
| 3481 | IGF2 | GSM6177621_NYU_UCEC2_lib1_lib1 | Human | Endometrium | EEC | 2.98e-48 | -7.53e-01 | -0.1934 |
| 3481 | IGF2 | GSM6177622_NYU_UCEC3_lib1_lib1 | Human | Endometrium | EEC | 3.50e-46 | -7.85e-01 | -0.1917 |
| 3481 | IGF2 | GSM6177622_NYU_UCEC3_lib2_lib2 | Human | Endometrium | EEC | 1.11e-47 | -7.96e-01 | -0.1916 |
| 3481 | IGF2 | GSM6177623_NYU_UCEC3_Vis | Human | Endometrium | EEC | 1.81e-49 | -8.12e-01 | -0.1269 |
| Page: 1 2 3 |
| Tissue | Expression Dynamics | Abbreviation |
| Endometrium |  | AEH: Atypical endometrial hyperplasia |
| EEC: Endometrioid Cancer | ||
| Esophagus | 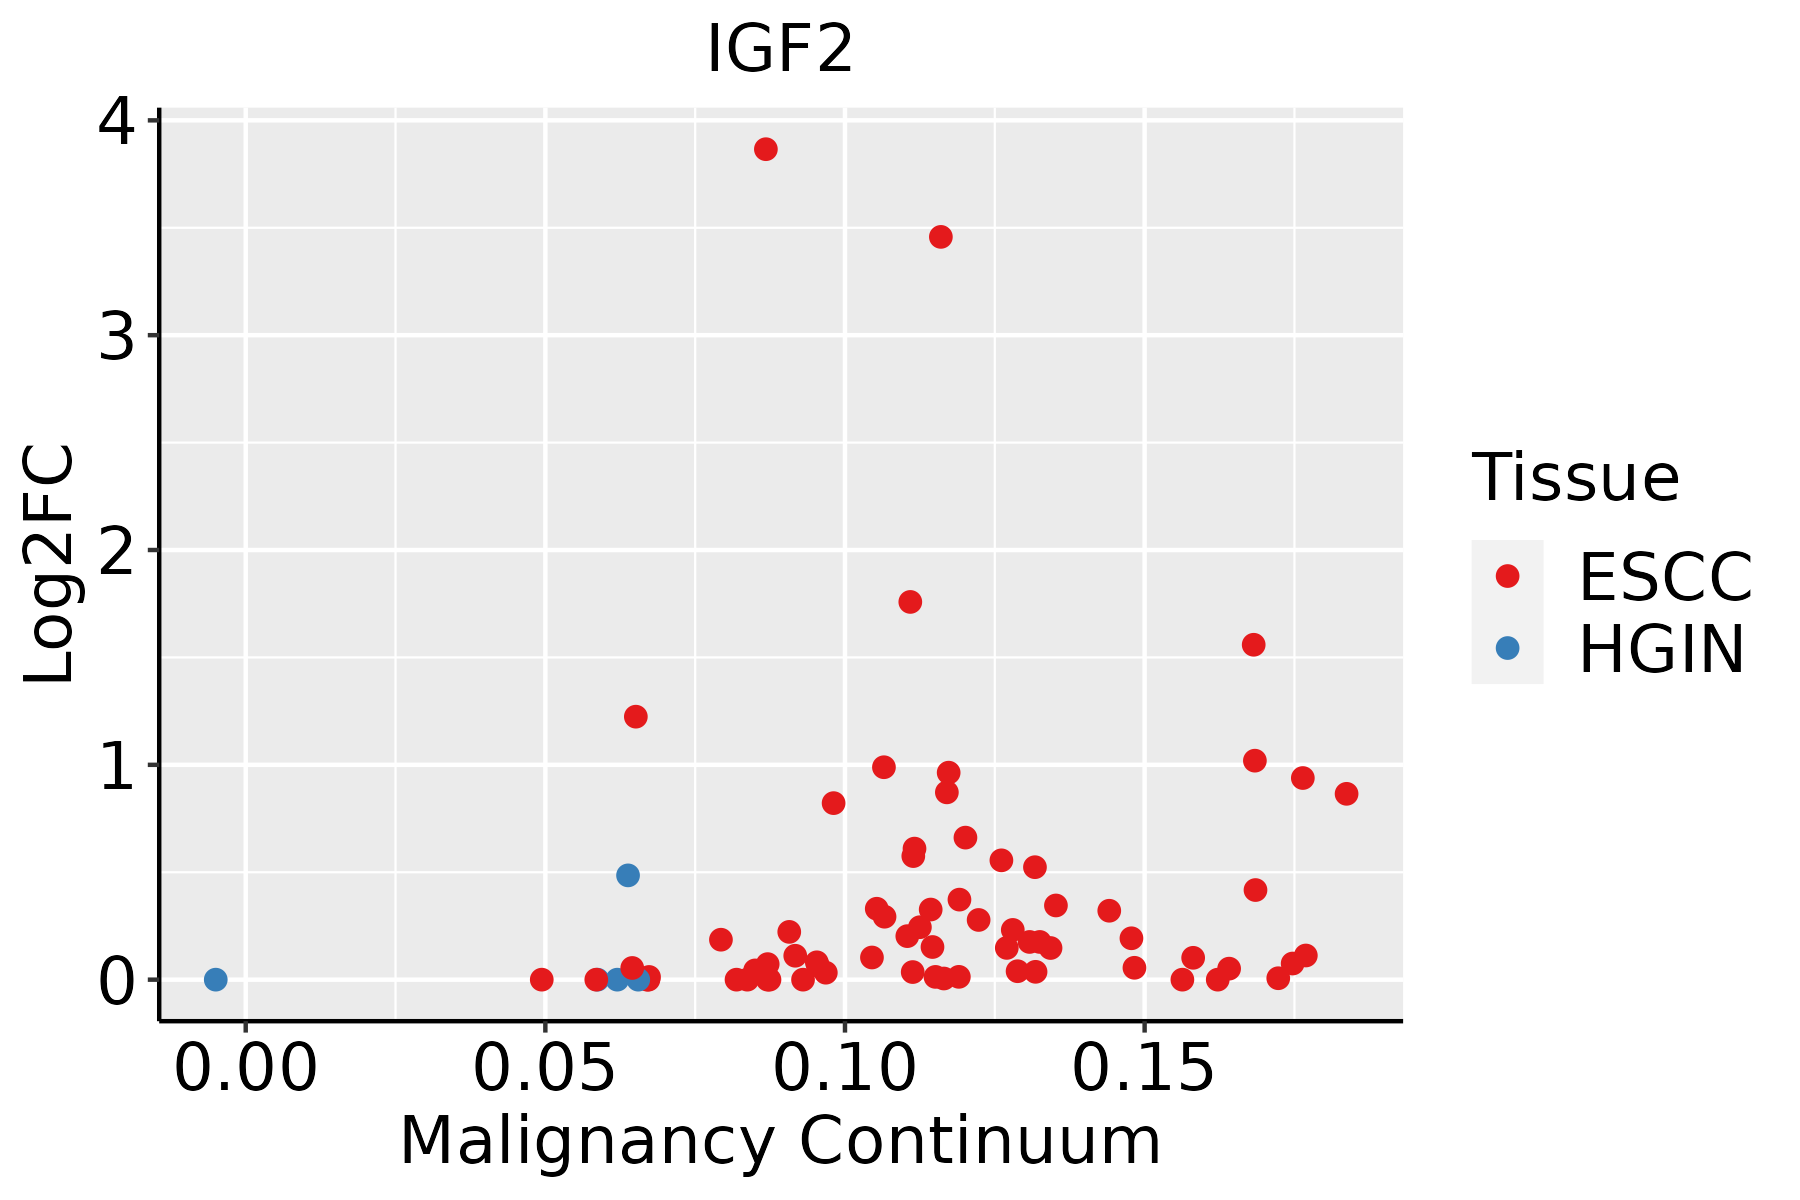 | ESCC: Esophageal squamous cell carcinoma |
| HGIN: High-grade intraepithelial neoplasias | ||
| LGIN: Low-grade intraepithelial neoplasias | ||
| Liver | 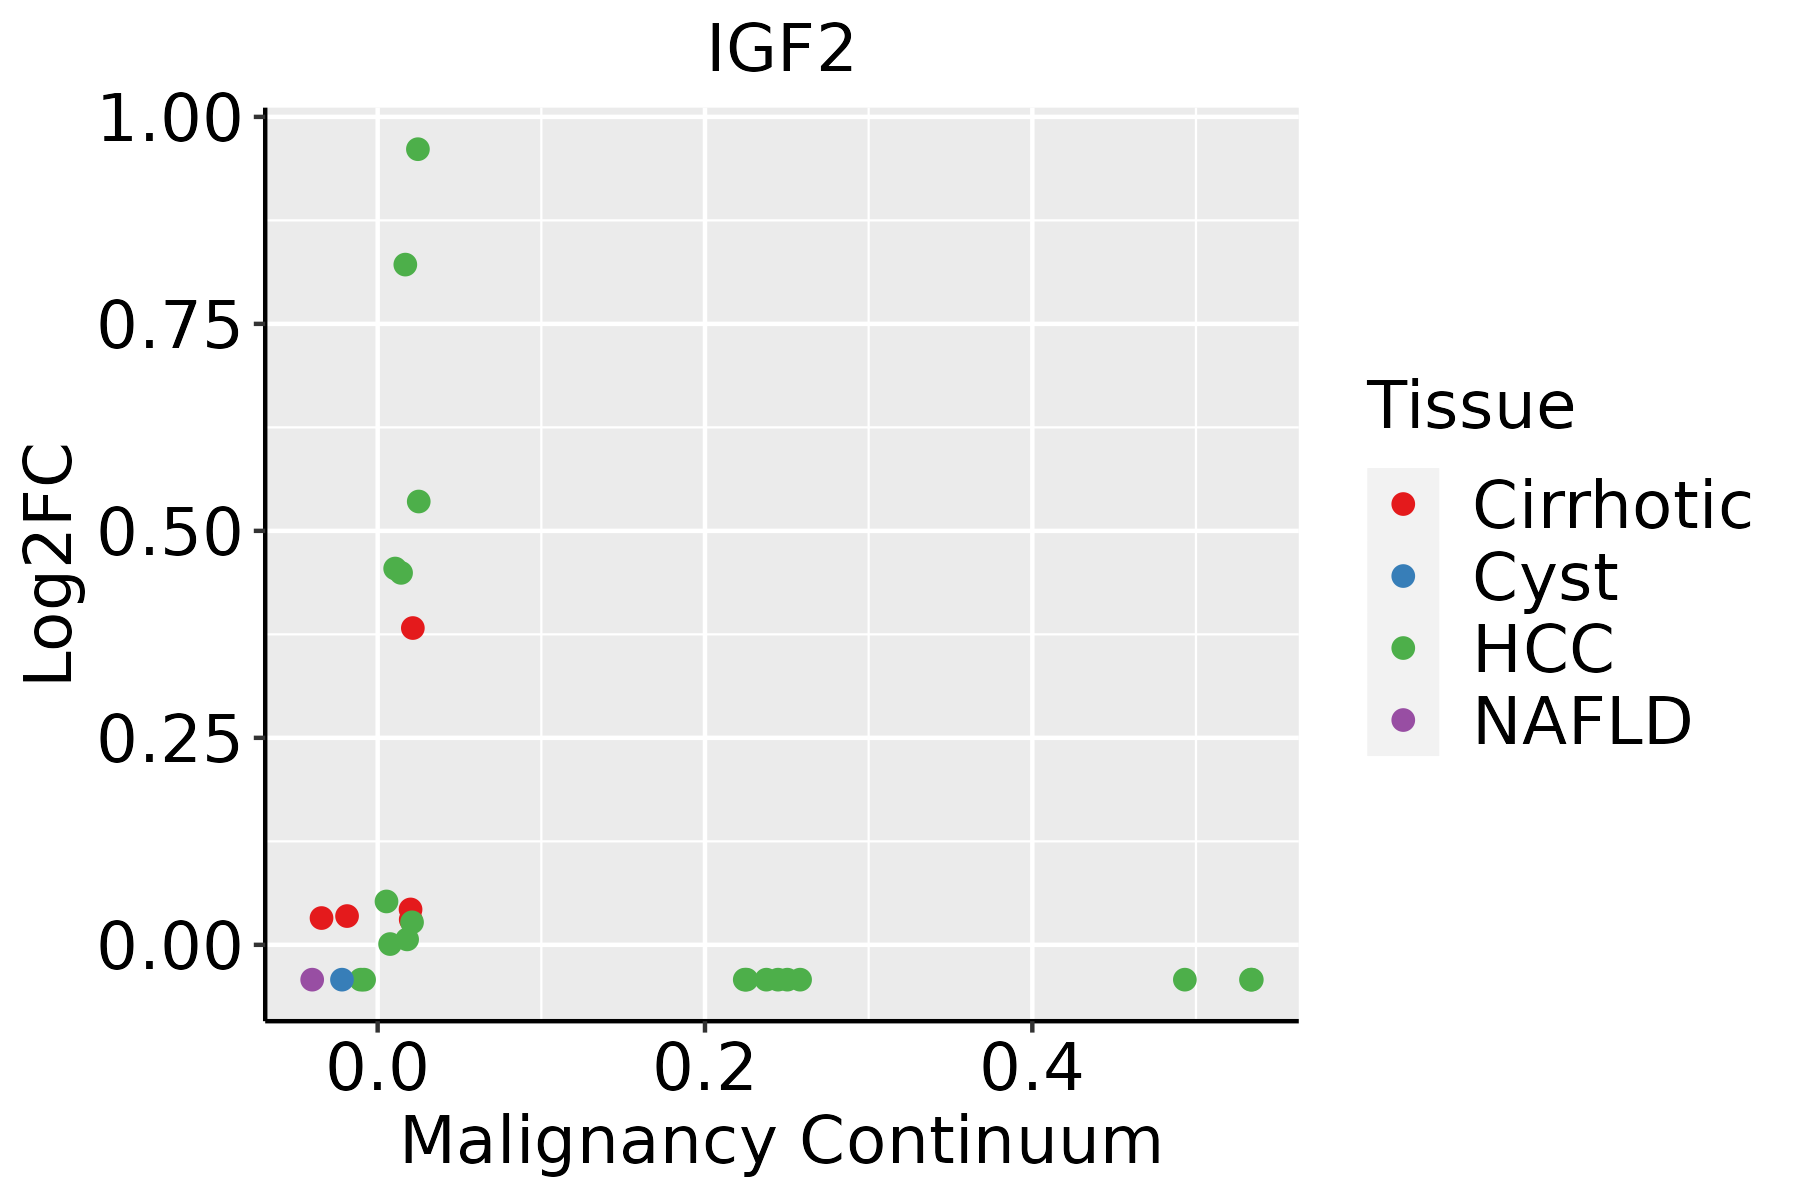 | HCC: Hepatocellular carcinoma |
| NAFLD: Non-alcoholic fatty liver disease |
| ∗log2FC in expression of this searched gene in stem-like cells from each diseased tissue sample relative to stem-like cells in normal samples in each tissue plotted against the malignancy continuum. Samples are colored based on if they are from different disease stage. |
Top |
Malignant transformation related pathway analysis |
| Find out the enriched GO biological processes and KEGG pathways involved in transition from healthy to precancer to cancer |
| Tissue | Disease Stage | Enriched GO biological Processes |
| Colorectum | AD |  |
| Colorectum | SER |  |
| Colorectum | MSS |  |
| Colorectum | MSI-H |  |
| Colorectum | FAP |  |
| ∗Top 15 enriched GO BP terms are showed in the bar plot of each disease state in each tissue. Each row represents a significant GO biological process which is colored according to the -log10(p.adjust). |
| Page: 1 2 3 4 5 6 7 8 9 |
| GO ID | Tissue | Disease Stage | Description | Gene Ratio | Bg Ratio | pvalue | p.adjust | Count |
| GO:00160322 | Colorectum | MSS | viral process | 157/3467 | 415/18723 | 7.94e-21 | 6.19e-18 | 157 |
| GO:00487322 | Colorectum | MSS | gland development | 143/3467 | 436/18723 | 3.85e-13 | 8.01e-11 | 143 |
| GO:00444032 | Colorectum | MSS | biological process involved in symbiotic interaction | 93/3467 | 290/18723 | 1.72e-08 | 9.85e-07 | 93 |
| GO:00064172 | Colorectum | MSS | regulation of translation | 134/3467 | 468/18723 | 4.43e-08 | 2.38e-06 | 134 |
| GO:00064032 | Colorectum | MSS | RNA localization | 69/3467 | 201/18723 | 6.33e-08 | 3.26e-06 | 69 |
| GO:00159312 | Colorectum | MSS | nucleobase-containing compound transport | 70/3467 | 222/18723 | 1.92e-06 | 6.01e-05 | 70 |
| GO:00610082 | Colorectum | MSS | hepaticobiliary system development | 51/3467 | 150/18723 | 4.33e-06 | 1.23e-04 | 51 |
| GO:00512362 | Colorectum | MSS | establishment of RNA localization | 55/3467 | 166/18723 | 4.54e-06 | 1.27e-04 | 55 |
| GO:00018892 | Colorectum | MSS | liver development | 50/3467 | 147/18723 | 5.28e-06 | 1.44e-04 | 50 |
| GO:00506572 | Colorectum | MSS | nucleic acid transport | 54/3467 | 163/18723 | 5.54e-06 | 1.49e-04 | 54 |
| GO:00506582 | Colorectum | MSS | RNA transport | 54/3467 | 163/18723 | 5.54e-06 | 1.49e-04 | 54 |
| GO:00070342 | Colorectum | MSS | vacuolar transport | 52/3467 | 157/18723 | 8.25e-06 | 2.07e-04 | 52 |
| GO:00068981 | Colorectum | MSS | receptor-mediated endocytosis | 69/3467 | 244/18723 | 1.18e-04 | 1.82e-03 | 69 |
| GO:00510281 | Colorectum | MSS | mRNA transport | 40/3467 | 130/18723 | 4.94e-04 | 5.75e-03 | 40 |
| GO:00070411 | Colorectum | MSS | lysosomal transport | 36/3467 | 114/18723 | 5.38e-04 | 6.04e-03 | 36 |
| GO:00358211 | Colorectum | MSS | modulation of process of other organism | 33/3467 | 106/18723 | 1.18e-03 | 1.14e-02 | 33 |
| GO:00097912 | Colorectum | MSS | post-embryonic development | 26/3467 | 80/18723 | 1.91e-03 | 1.66e-02 | 26 |
| GO:00311001 | Colorectum | MSS | animal organ regeneration | 25/3467 | 76/18723 | 1.91e-03 | 1.66e-02 | 25 |
| GO:0017148 | Colorectum | MSS | negative regulation of translation | 64/3467 | 245/18723 | 1.94e-03 | 1.67e-02 | 64 |
| GO:0034249 | Colorectum | MSS | negative regulation of cellular amide metabolic process | 70/3467 | 273/18723 | 2.07e-03 | 1.76e-02 | 70 |
| Page: 1 2 3 4 5 6 7 8 9 10 11 12 13 14 15 16 17 18 19 20 21 22 23 24 25 26 27 28 29 30 31 32 33 34 35 36 37 38 39 40 |
| Pathway ID | Tissue | Disease Stage | Description | Gene Ratio | Bg Ratio | pvalue | p.adjust | qvalue | Count |
| hsa0520518 | Endometrium | AEH | Proteoglycans in cancer | 53/1197 | 205/8465 | 5.43e-06 | 6.53e-05 | 4.78e-05 | 53 |
| hsa0520519 | Endometrium | AEH | Proteoglycans in cancer | 53/1197 | 205/8465 | 5.43e-06 | 6.53e-05 | 4.78e-05 | 53 |
| hsa0520524 | Endometrium | EEC | Proteoglycans in cancer | 52/1237 | 205/8465 | 3.01e-05 | 3.19e-04 | 2.38e-04 | 52 |
| hsa0520534 | Endometrium | EEC | Proteoglycans in cancer | 52/1237 | 205/8465 | 3.01e-05 | 3.19e-04 | 2.38e-04 | 52 |
| hsa0520528 | Esophagus | HGIN | Proteoglycans in cancer | 47/1383 | 205/8465 | 8.23e-03 | 4.71e-02 | 3.74e-02 | 47 |
| hsa05205112 | Esophagus | HGIN | Proteoglycans in cancer | 47/1383 | 205/8465 | 8.23e-03 | 4.71e-02 | 3.74e-02 | 47 |
| hsa0520529 | Esophagus | ESCC | Proteoglycans in cancer | 138/4205 | 205/8465 | 1.79e-07 | 1.40e-06 | 7.15e-07 | 138 |
| hsa0522518 | Esophagus | ESCC | Hepatocellular carcinoma | 109/4205 | 168/8465 | 4.27e-05 | 1.88e-04 | 9.64e-05 | 109 |
| hsa041517 | Esophagus | ESCC | PI3K-Akt signaling pathway | 197/4205 | 354/8465 | 1.24e-02 | 2.83e-02 | 1.45e-02 | 197 |
| hsa0520537 | Esophagus | ESCC | Proteoglycans in cancer | 138/4205 | 205/8465 | 1.79e-07 | 1.40e-06 | 7.15e-07 | 138 |
| hsa0522519 | Esophagus | ESCC | Hepatocellular carcinoma | 109/4205 | 168/8465 | 4.27e-05 | 1.88e-04 | 9.64e-05 | 109 |
| hsa0415114 | Esophagus | ESCC | PI3K-Akt signaling pathway | 197/4205 | 354/8465 | 1.24e-02 | 2.83e-02 | 1.45e-02 | 197 |
| hsa0520510 | Liver | Cirrhotic | Proteoglycans in cancer | 85/2530 | 205/8465 | 2.37e-04 | 1.58e-03 | 9.75e-04 | 85 |
| hsa0520511 | Liver | Cirrhotic | Proteoglycans in cancer | 85/2530 | 205/8465 | 2.37e-04 | 1.58e-03 | 9.75e-04 | 85 |
| hsa052258 | Liver | HCC | Hepatocellular carcinoma | 106/4020 | 168/8465 | 2.87e-05 | 1.85e-04 | 1.03e-04 | 106 |
| hsa0520521 | Liver | HCC | Proteoglycans in cancer | 121/4020 | 205/8465 | 5.22e-04 | 2.18e-03 | 1.21e-03 | 121 |
| hsa0522511 | Liver | HCC | Hepatocellular carcinoma | 106/4020 | 168/8465 | 2.87e-05 | 1.85e-04 | 1.03e-04 | 106 |
| hsa0520531 | Liver | HCC | Proteoglycans in cancer | 121/4020 | 205/8465 | 5.22e-04 | 2.18e-03 | 1.21e-03 | 121 |
| Page: 1 |
Top |
Cell-cell communication analysis |
| Identification of potential cell-cell interactions between two cell types and their ligand-receptor pairs for different disease states |
| Ligand | Receptor | LRpair | Pathway | Tissue | Disease Stage |
| IGF2 | IGF1R | IGF2_IGF1R | IGF | CRC | MSS |
| IGF2 | IGF2R | IGF2_IGF2R | IGF | CRC | MSS |
| IGF2 | ITGA6_ITGB4 | IGF2_ITGA6_ITGB4 | IGF | CRC | MSS |
| IGF2 | IGF1R | IGF2_IGF1R | IGF | Endometrium | Healthy |
| IGF2 | IGF2R | IGF2_IGF2R | IGF | Endometrium | Healthy |
| IGF2 | ITGA6_ITGB4 | IGF2_ITGA6_ITGB4 | IGF | Endometrium | Healthy |
| IGF2 | IGF1R | IGF2_IGF1R | IGF | Esophagus | ESCC |
| IGF2 | IGF2R | IGF2_IGF2R | IGF | Esophagus | ESCC |
| IGF2 | ITGA6_ITGB4 | IGF2_ITGA6_ITGB4 | IGF | Esophagus | ESCC |
| IGF2 | IGF2R | IGF2_IGF2R | IGF | HNSCC | ADJ |
| IGF2 | ITGA6_ITGB4 | IGF2_ITGA6_ITGB4 | IGF | HNSCC | ADJ |
| IGF2 | ITGA6_ITGB4 | IGF2_ITGA6_ITGB4 | IGF | HNSCC | Healthy |
| IGF2 | IGF1R | IGF2_IGF1R | IGF | HNSCC | OSCC |
| IGF2 | IGF2R | IGF2_IGF2R | IGF | HNSCC | OSCC |
| IGF2 | ITGA6_ITGB4 | IGF2_ITGA6_ITGB4 | IGF | HNSCC | OSCC |
| IGF2 | IGF1R | IGF2_IGF1R | IGF | HNSCC | Precancer |
| IGF2 | IGF2R | IGF2_IGF2R | IGF | HNSCC | Precancer |
| IGF2 | ITGA6_ITGB4 | IGF2_ITGA6_ITGB4 | IGF | HNSCC | Precancer |
| IGF2 | IGF1R | IGF2_IGF1R | IGF | Liver | Healthy |
| IGF2 | IGF2R | IGF2_IGF2R | IGF | Liver | Healthy |
| Page: 1 2 |
Top |
Single-cell gene regulatory network inference analysis |
| Find out the significant the regulons (TFs) and the target genes of each regulon across cell types for different disease states |
| TF | Cell Type | Tissue | Disease Stage | Target Gene | RSS | Regulon Activity |
| ∗The dot plots of a searched regulon are shown for all cell subpopulations in each disease state of each tissue based on the regulon specific score inferred using pySCENIC and by calculating the average expression. |
| Page: 1 |
Top |
Somatic mutation of malignant transformation related genes |
| Annotation of somatic variants for genes involved in malignant transformation |
| Hugo Symbol | Variant Class | Variant Classification | dbSNP RS | HGVSc | HGVSp | HGVSp Short | SWISSPROT | BIOTYPE | SIFT | PolyPhen | Tumor Sample Barcode | Tissue | Histology | Sex | Age | Stage | Therapy Types | Drugs | Outcome |
| IGF2 | SNV | Missense_Mutation | c.113G>A | p.Gly38Asp | p.G38D | P01344 | protein_coding | deleterious_low_confidence(0.01) | benign(0.099) | TCGA-GM-A2DB-01 | Breast | breast invasive carcinoma | Female | <65 | I/II | Chemotherapy | taxol | CR | |
| IGF2 | insertion | Frame_Shift_Ins | rs755455183 | c.686_687insC | p.Glu230ArgfsTer50 | p.E230Rfs*50 | P01344 | protein_coding | TCGA-MA-AA42-01 | Cervix | cervical & endocervical cancer | Female | >=65 | I/II | Unknown | Unknown | SD | ||
| IGF2 | SNV | Missense_Mutation | c.311N>A | p.Arg104His | p.R104H | P01344 | protein_coding | deleterious(0) | probably_damaging(0.998) | TCGA-AA-3663-01 | Colorectum | colon adenocarcinoma | Male | <65 | I/II | Unknown | Unknown | SD | |
| IGF2 | SNV | Missense_Mutation | novel | c.101N>G | p.Ile34Arg | p.I34R | P01344 | protein_coding | deleterious_low_confidence(0) | benign(0.014) | TCGA-CA-6717-01 | Colorectum | colon adenocarcinoma | Male | <65 | I/II | Chemotherapy | oxaliplatin | CR |
| IGF2 | SNV | Missense_Mutation | rs762200142 | c.358C>T | p.Arg120Cys | p.R120C | P01344 | protein_coding | deleterious(0) | probably_damaging(0.996) | TCGA-CK-4951-01 | Colorectum | colon adenocarcinoma | Female | >=65 | I/II | Unknown | Unknown | PD |
| IGF2 | SNV | Missense_Mutation | rs369122420 | c.473N>T | p.Pro158Leu | p.P158L | P01344 | protein_coding | deleterious(0) | benign(0.176) | TCGA-CK-6746-01 | Colorectum | colon adenocarcinoma | Female | >=65 | I/II | Unknown | Unknown | SD |
| IGF2 | SNV | Missense_Mutation | c.124N>A | p.Glu42Lys | p.E42K | P01344 | protein_coding | deleterious_low_confidence(0.02) | benign(0.001) | TCGA-F4-6704-01 | Colorectum | colon adenocarcinoma | Male | <65 | III/IV | Unknown | Unknown | SD | |
| IGF2 | SNV | Missense_Mutation | c.248N>A | p.Arg83His | p.R83H | P01344 | protein_coding | deleterious(0.03) | benign(0.019) | TCGA-F4-6856-01 | Colorectum | colon adenocarcinoma | Male | <65 | I/II | Ancillary | leucovorin | CR | |
| IGF2 | insertion | Frame_Shift_Ins | rs755455183 | c.686_687insC | p.Glu230ArgfsTer50 | p.E230Rfs*50 | P01344 | protein_coding | TCGA-AZ-6601-01 | Colorectum | colon adenocarcinoma | Male | >=65 | I/II | Unknown | Unknown | PD | ||
| IGF2 | insertion | Frame_Shift_Ins | rs755455183 | c.686dupC | p.Glu230ArgfsTer50 | p.E230Rfs*50 | P01344 | protein_coding | TCGA-G4-6628-01 | Colorectum | colon adenocarcinoma | Male | >=65 | I/II | Unknown | Unknown | SD |
| Page: 1 2 3 4 |
Top |
Related drugs of malignant transformation related genes |
| Identification of chemicals and drugs interact with genes involved in malignant transfromation |
| (DGIdb 4.0) |
| Entrez ID | Symbol | Category | Interaction Types | Drug Claim Name | Drug Name | PMIDs |
| 3481 | IGF2 | CLINICALLY ACTIONABLE, TRANSCRIPTION FACTOR, HORMONE ACTIVITY, GROWTH FACTOR, DRUGGABLE GENOME | Xentuzumab | XENTUZUMAB | ||
| 3481 | IGF2 | CLINICALLY ACTIONABLE, TRANSCRIPTION FACTOR, HORMONE ACTIVITY, GROWTH FACTOR, DRUGGABLE GENOME | ANASTROZOLE | ANASTROZOLE | 11983488 | |
| 3481 | IGF2 | CLINICALLY ACTIONABLE, TRANSCRIPTION FACTOR, HORMONE ACTIVITY, GROWTH FACTOR, DRUGGABLE GENOME | GEFITINIB | GEFITINIB | 16988945 | |
| 3481 | IGF2 | CLINICALLY ACTIONABLE, TRANSCRIPTION FACTOR, HORMONE ACTIVITY, GROWTH FACTOR, DRUGGABLE GENOME | ANDROGENS | 2229290 | ||
| 3481 | IGF2 | CLINICALLY ACTIONABLE, TRANSCRIPTION FACTOR, HORMONE ACTIVITY, GROWTH FACTOR, DRUGGABLE GENOME | GANITUMAB | GANITUMAB | 23741071,24727326 | |
| 3481 | IGF2 | CLINICALLY ACTIONABLE, TRANSCRIPTION FACTOR, HORMONE ACTIVITY, GROWTH FACTOR, DRUGGABLE GENOME | ETOPOSIDE | ETOPOSIDE | 15019164 | |
| 3481 | IGF2 | CLINICALLY ACTIONABLE, TRANSCRIPTION FACTOR, HORMONE ACTIVITY, GROWTH FACTOR, DRUGGABLE GENOME | Platinum compounds | 30672383 | ||
| 3481 | IGF2 | CLINICALLY ACTIONABLE, TRANSCRIPTION FACTOR, HORMONE ACTIVITY, GROWTH FACTOR, DRUGGABLE GENOME | HGF | 9348194 | ||
| 3481 | IGF2 | CLINICALLY ACTIONABLE, TRANSCRIPTION FACTOR, HORMONE ACTIVITY, GROWTH FACTOR, DRUGGABLE GENOME | SOMATOTROPIN | HUMAN GROWTH HORMONE | 9834461 | |
| 3481 | IGF2 | CLINICALLY ACTIONABLE, TRANSCRIPTION FACTOR, HORMONE ACTIVITY, GROWTH FACTOR, DRUGGABLE GENOME | IFN | 15342387 |
| Page: 1 2 3 |

Copyright 2023-Present -The University of Texas Health Science Center at Houston |