
|
|||||
|
 | |
| |
| |
| |
| |
| |
|
Gene: ICA1 |
Gene summary for ICA1 |
| Gene information | Species | Human | Gene symbol | ICA1 | Gene ID | 3382 |
| Gene name | islet cell autoantigen 1 | |
| Gene Alias | ICA69 | |
| Cytomap | 7p21.3 | |
| Gene Type | protein-coding | GO ID | GO:0002790 | UniProtAcc | A0A024RA29 |
Top |
Malignant transformation analysis |
| Identification of the aberrant gene expression in precancerous and cancerous lesions by comparing the gene expression of stem-like cells in diseased tissues with normal stem cells |
| Entrez ID | Symbol | Replicates | Species | Organ | Tissue | Adj P-value | Log2FC | Malignancy |
| 3382 | ICA1 | HTA11_1938_2000001011 | Human | Colorectum | AD | 4.74e-02 | 3.85e-01 | -0.0811 |
| 3382 | ICA1 | HTA11_99999965104_69814 | Human | Colorectum | MSS | 3.31e-11 | 8.39e-01 | 0.281 |
| 3382 | ICA1 | HTA11_99999974143_84620 | Human | Colorectum | MSS | 3.47e-04 | -3.22e-01 | 0.3005 |
| 3382 | ICA1 | A001-C-207 | Human | Colorectum | FAP | 7.57e-05 | 1.84e-01 | 0.1278 |
| 3382 | ICA1 | A015-C-203 | Human | Colorectum | FAP | 1.77e-20 | -1.79e-01 | -0.1294 |
| 3382 | ICA1 | A015-C-204 | Human | Colorectum | FAP | 3.46e-04 | -6.83e-02 | -0.0228 |
| 3382 | ICA1 | A014-C-040 | Human | Colorectum | FAP | 1.63e-04 | 1.85e-01 | -0.1184 |
| 3382 | ICA1 | A002-C-201 | Human | Colorectum | FAP | 4.69e-13 | -2.96e-01 | 0.0324 |
| 3382 | ICA1 | A002-C-203 | Human | Colorectum | FAP | 1.67e-05 | 3.29e-01 | 0.2786 |
| 3382 | ICA1 | A001-C-119 | Human | Colorectum | FAP | 1.51e-06 | 8.93e-02 | -0.1557 |
| 3382 | ICA1 | A001-C-108 | Human | Colorectum | FAP | 2.80e-10 | 2.19e-01 | -0.0272 |
| 3382 | ICA1 | A002-C-205 | Human | Colorectum | FAP | 3.48e-23 | -1.94e-01 | -0.1236 |
| 3382 | ICA1 | A001-C-104 | Human | Colorectum | FAP | 7.99e-04 | 3.03e-01 | 0.0184 |
| 3382 | ICA1 | A015-C-005 | Human | Colorectum | FAP | 5.29e-03 | 3.87e-02 | -0.0336 |
| 3382 | ICA1 | A015-C-006 | Human | Colorectum | FAP | 4.87e-15 | -1.16e-02 | -0.0994 |
| 3382 | ICA1 | A015-C-106 | Human | Colorectum | FAP | 4.24e-06 | 3.93e-02 | -0.0511 |
| 3382 | ICA1 | A002-C-114 | Human | Colorectum | FAP | 1.14e-16 | -1.47e-01 | -0.1561 |
| 3382 | ICA1 | A015-C-104 | Human | Colorectum | FAP | 2.14e-22 | -5.20e-02 | -0.1899 |
| 3382 | ICA1 | A001-C-014 | Human | Colorectum | FAP | 7.05e-11 | 2.45e-01 | 0.0135 |
| 3382 | ICA1 | A002-C-016 | Human | Colorectum | FAP | 2.63e-17 | -1.37e-01 | 0.0521 |
| Page: 1 2 3 4 5 |
| Tissue | Expression Dynamics | Abbreviation |
| Colorectum (GSE201348) |  | FAP: Familial adenomatous polyposis |
| CRC: Colorectal cancer | ||
| Colorectum (HTA11) |  | AD: Adenomas |
| SER: Sessile serrated lesions | ||
| MSI-H: Microsatellite-high colorectal cancer | ||
| MSS: Microsatellite stable colorectal cancer | ||
| Esophagus | 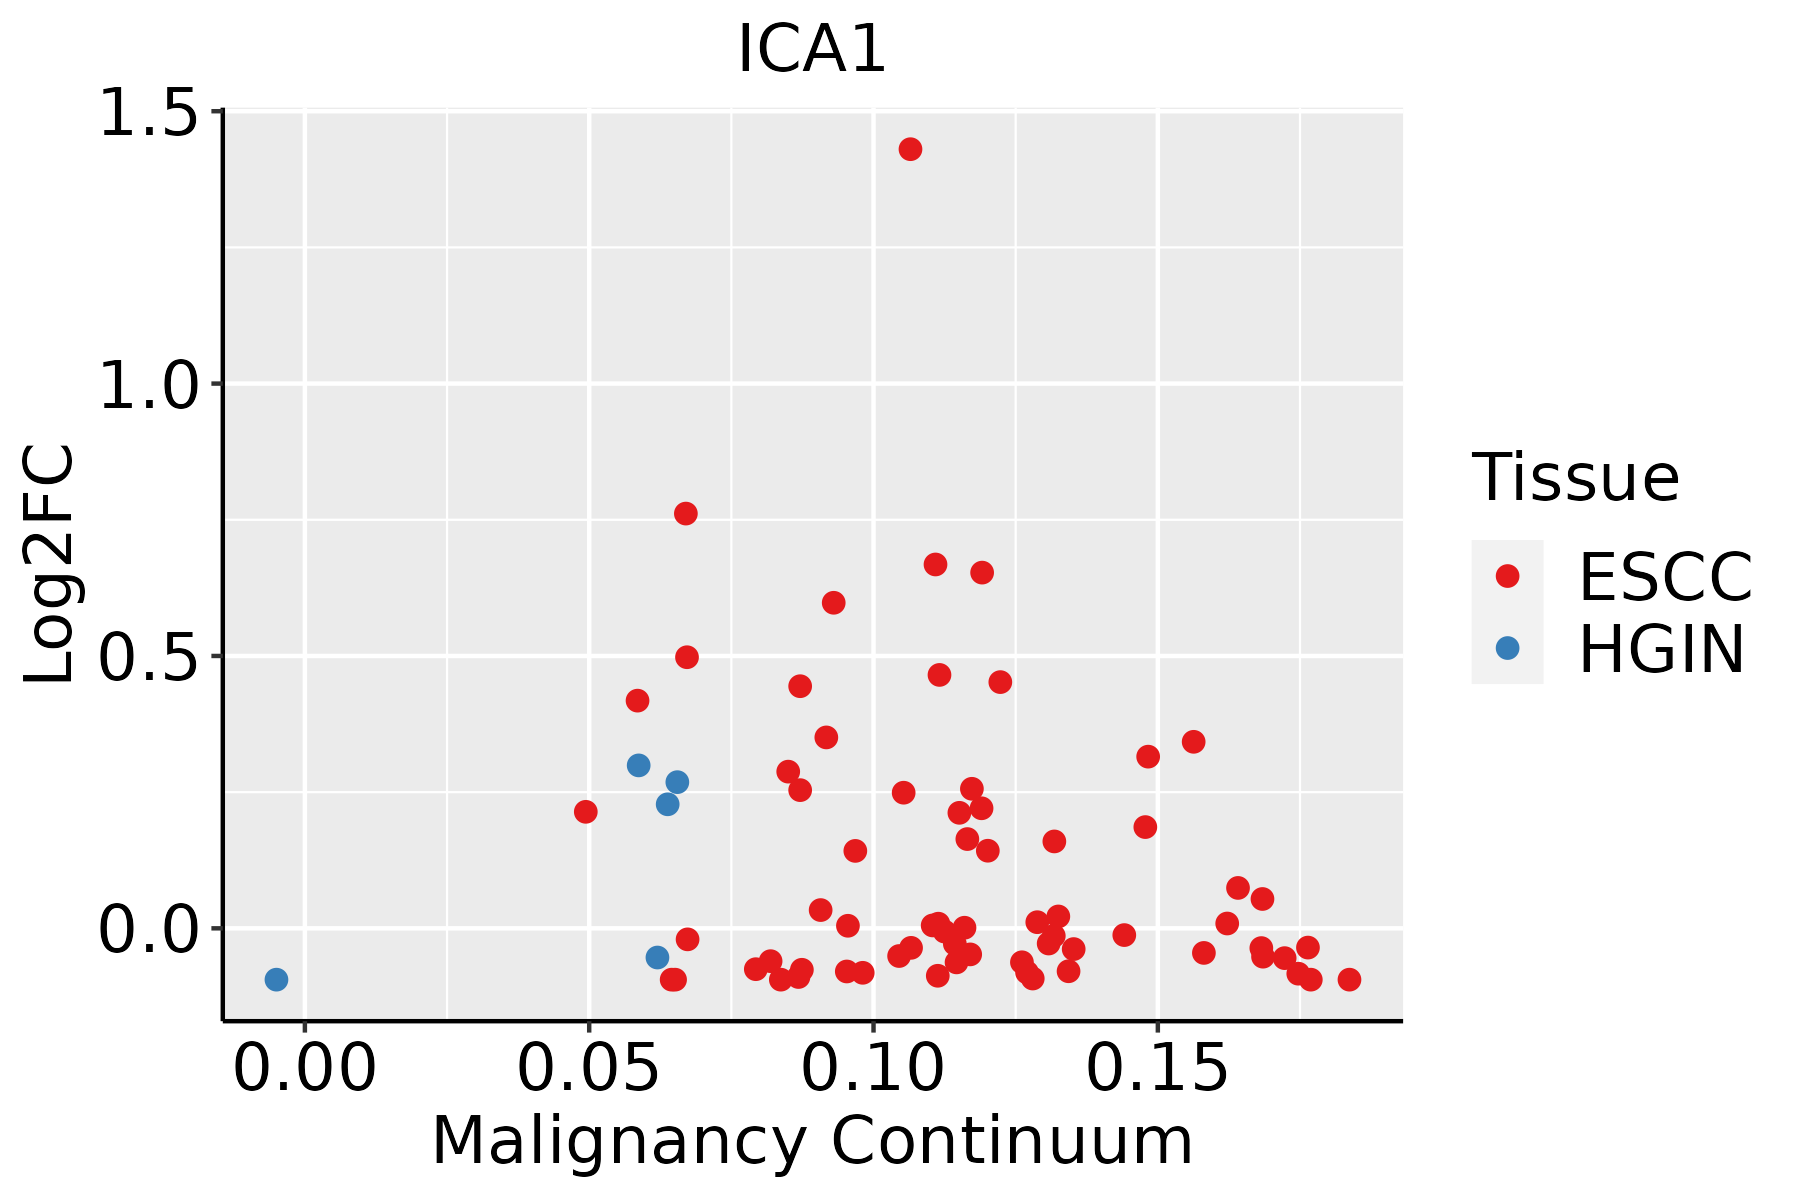 | ESCC: Esophageal squamous cell carcinoma |
| HGIN: High-grade intraepithelial neoplasias | ||
| LGIN: Low-grade intraepithelial neoplasias | ||
| Liver | 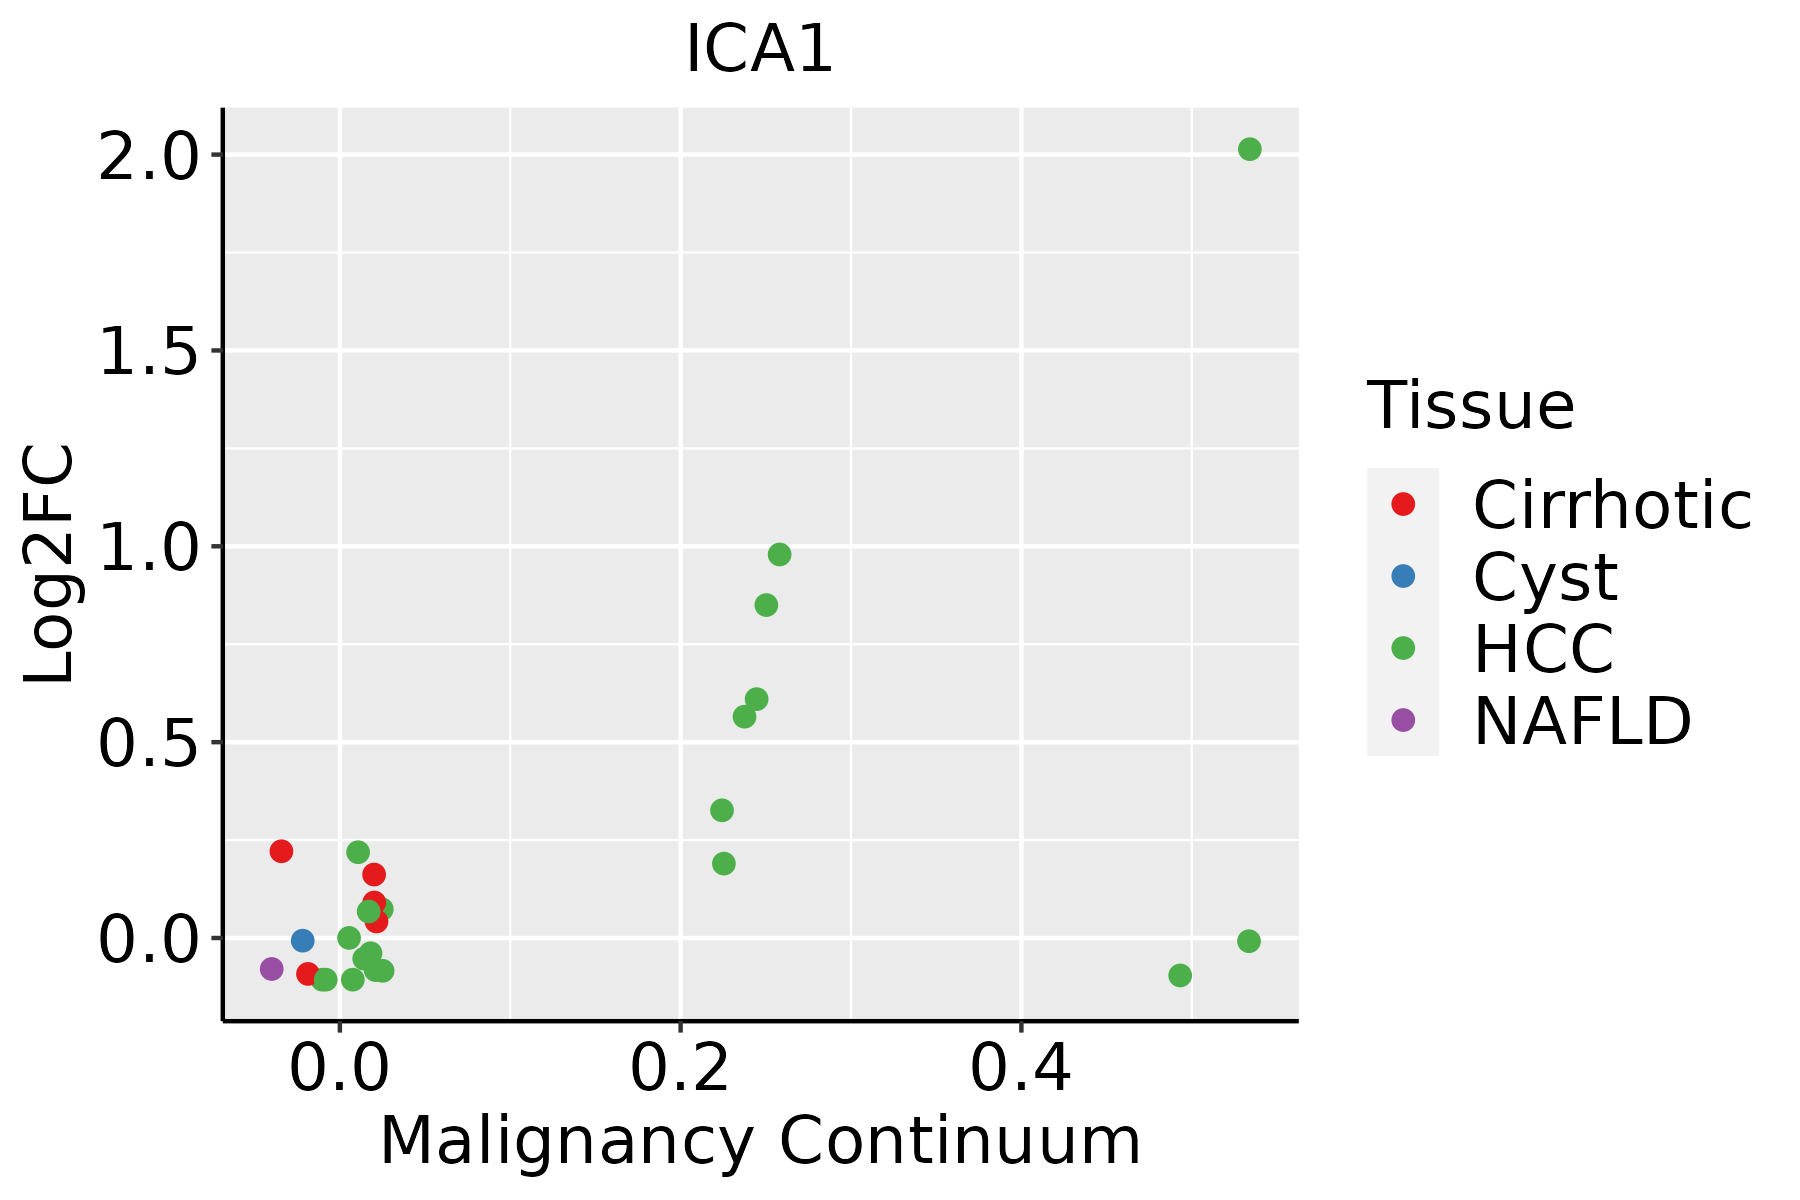 | HCC: Hepatocellular carcinoma |
| NAFLD: Non-alcoholic fatty liver disease | ||
| Lung |  | AAH: Atypical adenomatous hyperplasia |
| AIS: Adenocarcinoma in situ | ||
| IAC: Invasive lung adenocarcinoma | ||
| MIA: Minimally invasive adenocarcinoma | ||
| Oral Cavity | 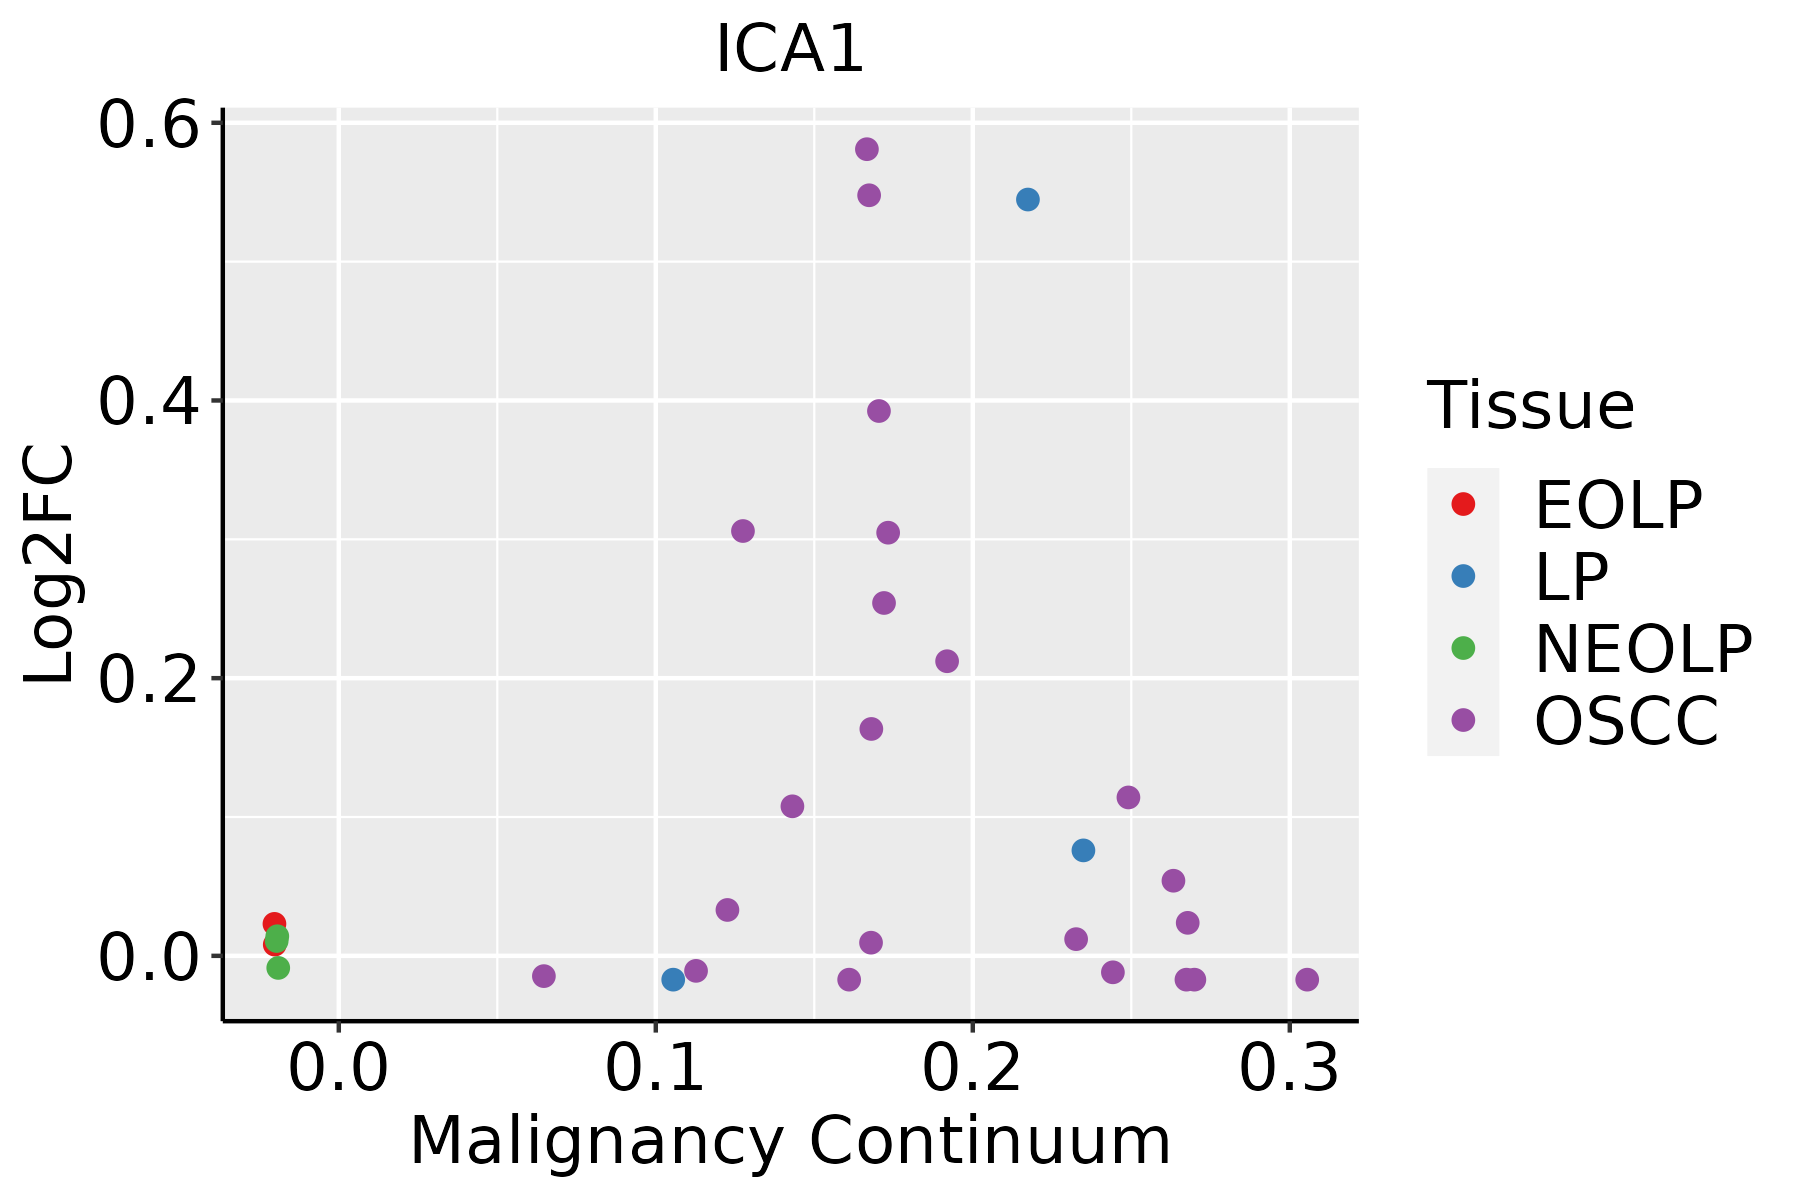 | EOLP: Erosive Oral lichen planus |
| LP: leukoplakia | ||
| NEOLP: Non-erosive oral lichen planus | ||
| OSCC: Oral squamous cell carcinoma | ||
| Prostate | 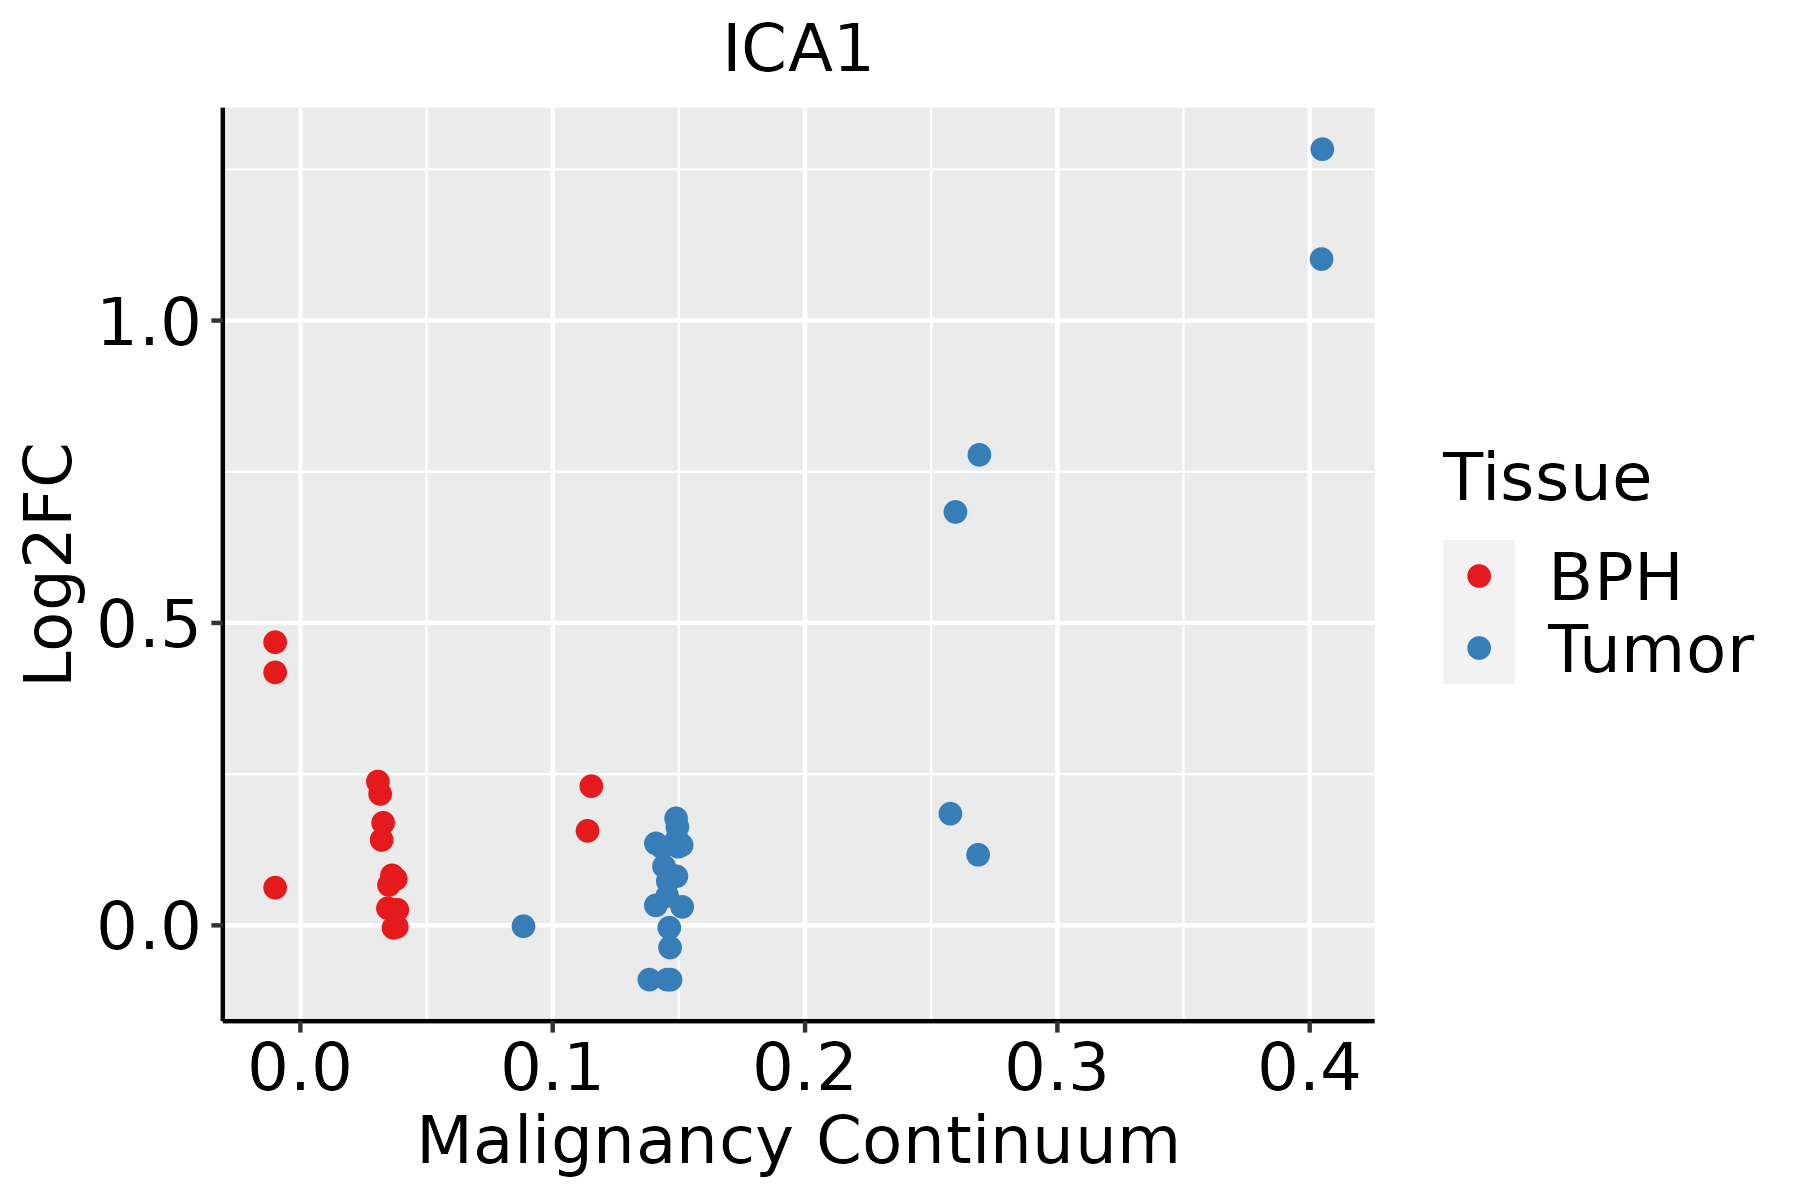 | BPH: Benign Prostatic Hyperplasia |
| Thyroid |  | ATC: Anaplastic thyroid cancer |
| HT: Hashimoto's thyroiditis | ||
| PTC: Papillary thyroid cancer |
| ∗log2FC in expression of this searched gene in stem-like cells from each diseased tissue sample relative to stem-like cells in normal samples in each tissue plotted against the malignancy continuum. Samples are colored based on if they are from different disease stage. |
Top |
Malignant transformation related pathway analysis |
| Find out the enriched GO biological processes and KEGG pathways involved in transition from healthy to precancer to cancer |
| Tissue | Disease Stage | Enriched GO biological Processes |
| Colorectum | AD |  |
| Colorectum | SER |  |
| Colorectum | MSS |  |
| Colorectum | MSI-H |  |
| Colorectum | FAP |  |
| ∗Top 15 enriched GO BP terms are showed in the bar plot of each disease state in each tissue. Each row represents a significant GO biological process which is colored according to the -log10(p.adjust). |
| Page: 1 2 3 4 5 6 7 8 9 |
| GO ID | Tissue | Disease Stage | Description | Gene Ratio | Bg Ratio | pvalue | p.adjust | Count |
| GO:0046883 | Colorectum | FAP | regulation of hormone secretion | 50/2622 | 249/18723 | 4.97e-03 | 3.32e-02 | 50 |
| GO:0046879 | Colorectum | FAP | hormone secretion | 57/2622 | 295/18723 | 6.67e-03 | 4.12e-02 | 57 |
| GO:00507084 | Colorectum | CRC | regulation of protein secretion | 49/2078 | 268/18723 | 3.00e-04 | 4.75e-03 | 49 |
| GO:00093064 | Colorectum | CRC | protein secretion | 59/2078 | 359/18723 | 1.32e-03 | 1.48e-02 | 59 |
| GO:00355924 | Colorectum | CRC | establishment of protein localization to extracellular region | 59/2078 | 360/18723 | 1.41e-03 | 1.54e-02 | 59 |
| GO:00230611 | Colorectum | CRC | signal release | 72/2078 | 463/18723 | 1.95e-03 | 1.96e-02 | 72 |
| GO:00716924 | Colorectum | CRC | protein localization to extracellular region | 59/2078 | 368/18723 | 2.37e-03 | 2.27e-02 | 59 |
| GO:00507964 | Colorectum | CRC | regulation of insulin secretion | 30/2078 | 165/18723 | 4.44e-03 | 3.48e-02 | 30 |
| GO:00300734 | Colorectum | CRC | insulin secretion | 34/2078 | 195/18723 | 5.10e-03 | 3.91e-02 | 34 |
| GO:00158334 | Colorectum | CRC | peptide transport | 43/2078 | 264/18723 | 6.47e-03 | 4.68e-02 | 43 |
| GO:000930617 | Esophagus | ESCC | protein secretion | 190/8552 | 359/18723 | 3.22e-03 | 1.34e-02 | 190 |
| GO:003559217 | Esophagus | ESCC | establishment of protein localization to extracellular region | 190/8552 | 360/18723 | 3.77e-03 | 1.53e-02 | 190 |
| GO:007169210 | Esophagus | ESCC | protein localization to extracellular region | 193/8552 | 368/18723 | 5.01e-03 | 1.92e-02 | 193 |
| GO:005070810 | Esophagus | ESCC | regulation of protein secretion | 142/8552 | 268/18723 | 9.31e-03 | 3.24e-02 | 142 |
| GO:003559212 | Liver | HCC | establishment of protein localization to extracellular region | 176/7958 | 360/18723 | 7.96e-03 | 3.15e-02 | 176 |
| GO:000930612 | Liver | HCC | protein secretion | 175/7958 | 359/18723 | 9.32e-03 | 3.57e-02 | 175 |
| GO:000930610 | Oral cavity | OSCC | protein secretion | 169/7305 | 359/18723 | 1.04e-03 | 5.34e-03 | 169 |
| GO:003559210 | Oral cavity | OSCC | establishment of protein localization to extracellular region | 169/7305 | 360/18723 | 1.21e-03 | 6.08e-03 | 169 |
| GO:00716929 | Oral cavity | OSCC | protein localization to extracellular region | 172/7305 | 368/18723 | 1.40e-03 | 6.79e-03 | 172 |
| GO:00507089 | Oral cavity | OSCC | regulation of protein secretion | 126/7305 | 268/18723 | 4.41e-03 | 1.79e-02 | 126 |
| Page: 1 2 3 4 |
| Pathway ID | Tissue | Disease Stage | Description | Gene Ratio | Bg Ratio | pvalue | p.adjust | qvalue | Count |
| Page: 1 |
Top |
Cell-cell communication analysis |
| Identification of potential cell-cell interactions between two cell types and their ligand-receptor pairs for different disease states |
| Ligand | Receptor | LRpair | Pathway | Tissue | Disease Stage |
| Page: 1 |
Top |
Single-cell gene regulatory network inference analysis |
| Find out the significant the regulons (TFs) and the target genes of each regulon across cell types for different disease states |
| TF | Cell Type | Tissue | Disease Stage | Target Gene | RSS | Regulon Activity |
| ∗The dot plots of a searched regulon are shown for all cell subpopulations in each disease state of each tissue based on the regulon specific score inferred using pySCENIC and by calculating the average expression. |
| Page: 1 |
Top |
Somatic mutation of malignant transformation related genes |
| Annotation of somatic variants for genes involved in malignant transformation |
| Hugo Symbol | Variant Class | Variant Classification | dbSNP RS | HGVSc | HGVSp | HGVSp Short | SWISSPROT | BIOTYPE | SIFT | PolyPhen | Tumor Sample Barcode | Tissue | Histology | Sex | Age | Stage | Therapy Types | Drugs | Outcome |
| ICA1 | SNV | Missense_Mutation | novel | c.31G>A | p.Asp11Asn | p.D11N | Q05084 | protein_coding | deleterious_low_confidence(0.03) | benign(0.019) | TCGA-AN-A046-01 | Breast | breast invasive carcinoma | Female | >=65 | I/II | Unknown | Unknown | SD |
| ICA1 | deletion | Frame_Shift_Del | c.1250_1251delNN | p.Pro417GlnfsTer30 | p.P417Qfs*30 | Q05084 | protein_coding | TCGA-C8-A1HN-01 | Breast | breast invasive carcinoma | Female | <65 | I/II | Unknown | Unknown | SD | |||
| ICA1 | SNV | Missense_Mutation | novel | c.565G>A | p.Glu189Lys | p.E189K | Q05084 | protein_coding | deleterious(0) | probably_damaging(1) | TCGA-2W-A8YY-01 | Cervix | cervical & endocervical cancer | Female | <65 | I/II | Chemotherapy | cisplatin | CR |
| ICA1 | SNV | Missense_Mutation | c.246G>C | p.Lys82Asn | p.K82N | Q05084 | protein_coding | tolerated(0.19) | benign(0.178) | TCGA-DR-A0ZM-01 | Cervix | cervical & endocervical cancer | Female | <65 | III/IV | Unspecific | Cisplatin | SD | |
| ICA1 | SNV | Missense_Mutation | c.519N>A | p.Met173Ile | p.M173I | Q05084 | protein_coding | deleterious(0.02) | probably_damaging(0.998) | TCGA-VS-A94X-01 | Cervix | cervical & endocervical cancer | Female | <65 | I/II | Chemotherapy | cisplatin | PD | |
| ICA1 | SNV | Missense_Mutation | novel | c.1376N>C | p.Phe459Ser | p.F459S | Q05084 | protein_coding | deleterious(0) | probably_damaging(0.999) | TCGA-ZJ-AAXF-01 | Cervix | cervical & endocervical cancer | Female | <65 | I/II | Unknown | Unknown | SD |
| ICA1 | SNV | Missense_Mutation | rs768714490 | c.98N>T | p.Thr33Met | p.T33M | Q05084 | protein_coding | deleterious(0) | probably_damaging(0.998) | TCGA-A6-4105-01 | Colorectum | colon adenocarcinoma | Male | >=65 | I/II | Unknown | Unknown | PD |
| ICA1 | SNV | Missense_Mutation | novel | c.995G>A | p.Gly332Asp | p.G332D | Q05084 | protein_coding | tolerated(0.63) | benign(0.023) | TCGA-AA-3949-01 | Colorectum | colon adenocarcinoma | Female | >=65 | III/IV | Unknown | Unknown | SD |
| ICA1 | SNV | Missense_Mutation | novel | c.218T>C | p.Leu73Ser | p.L73S | Q05084 | protein_coding | deleterious(0) | probably_damaging(0.998) | TCGA-AA-3950-01 | Colorectum | colon adenocarcinoma | Female | >=65 | I/II | Unknown | Unknown | SD |
| ICA1 | SNV | Missense_Mutation | rs570072277 | c.931C>T | p.Arg311Cys | p.R311C | Q05084 | protein_coding | tolerated(0.08) | benign(0.001) | TCGA-CA-6717-01 | Colorectum | colon adenocarcinoma | Male | <65 | I/II | Chemotherapy | oxaliplatin | CR |
| Page: 1 2 3 4 5 6 |
Top |
Related drugs of malignant transformation related genes |
| Identification of chemicals and drugs interact with genes involved in malignant transfromation |
| (DGIdb 4.0) |
| Entrez ID | Symbol | Category | Interaction Types | Drug Claim Name | Drug Name | PMIDs |
| 3382 | ICA1 | NA | tramadol | TRAMADOL | 30971809 | |
| 3382 | ICA1 | NA | o-desmethyl-tramadol | 30971809 | ||
| 3382 | ICA1 | NA | o-desmethyltramadol | 30971809 |
| Page: 1 |

Copyright 2023-Present -The University of Texas Health Science Center at Houston |