Schematic overview of the cellular and molecular mechanisms involved in the cancer progression, including the proposed cellular and molecular mechanisms in cancer cells trajectory. AT1: alveolar type 1 cells; AT2: alveolar type 2 cells; AAH: atypical adenomatous hyperplasia; AIS: adenocarcinoma in situ; MIA: minimally invasive adenocarcinoma; IA: invasive adenocarcinoma; EMT: epithelial-mesenchymal transition

Home

Download

Statistics

Help

Contact

Center for Computational Systems Medicine
leaf

Gene summary

leaf

Malignant transformation analysis

leaf

Malignant transformation related pathway analysis

leaf

Cell-cell communication analysis

leaf

Single-cell gene regulatory network inference analysis

leaf

Somatic mutation of malignant transformation related genes

leaf

Related drugs of malignant transformation related genes

Gene: IBTK

Gene summary for IBTK

check button Gene summary.

Gene informationSpeciesHuman
Gene symbol

IBTK

Gene ID

25998

Gene nameinhibitor of Bruton tyrosine kinase
Gene AliasBTBD26
Cytomap6q14.1
Gene Typeprotein-coding
GO ID

GO:0001932

UniProtAcc

B7ZLE0


Top

Malignant transformation analysis

check button Identification of the aberrant gene expression in precancerous and cancerous lesions by comparing the gene expression of stem-like cells in diseased tissues with normal stem cells
check button Malignant transformation involving gene list.
Entrez IDSymbolReplicatesSpeciesOrganTissueAdj P-valueLog2FCMalignancy
25998IBTKHTA11_3410_2000001011HumanColorectumAD2.10e-09-5.34e-010.0155
25998IBTKHTA11_7696_3000711011HumanColorectumAD2.58e-04-3.52e-010.0674
25998IBTKHTA11_6818_2000001021HumanColorectumAD2.18e-02-5.09e-010.0588
25998IBTKHTA11_99999974143_84620HumanColorectumMSS2.96e-08-4.65e-010.3005
25998IBTKA015-C-203HumanColorectumFAP1.56e-19-3.51e-01-0.1294
25998IBTKA015-C-204HumanColorectumFAP1.52e-02-2.41e-01-0.0228
25998IBTKA014-C-040HumanColorectumFAP1.97e-02-3.81e-01-0.1184
25998IBTKA002-C-201HumanColorectumFAP4.14e-11-4.04e-010.0324
25998IBTKA001-C-119HumanColorectumFAP3.49e-02-3.40e-01-0.1557
25998IBTKA001-C-108HumanColorectumFAP1.12e-10-1.22e-01-0.0272
25998IBTKA002-C-205HumanColorectumFAP2.00e-15-3.74e-01-0.1236
25998IBTKA015-C-006HumanColorectumFAP4.33e-09-2.94e-01-0.0994
25998IBTKA015-C-106HumanColorectumFAP6.03e-07-2.47e-01-0.0511
25998IBTKA002-C-114HumanColorectumFAP2.11e-12-3.53e-01-0.1561
25998IBTKA015-C-104HumanColorectumFAP1.09e-20-3.23e-01-0.1899
25998IBTKA001-C-014HumanColorectumFAP1.65e-06-1.50e-010.0135
25998IBTKA002-C-016HumanColorectumFAP1.96e-10-2.51e-010.0521
25998IBTKA015-C-002HumanColorectumFAP5.44e-08-2.85e-01-0.0763
25998IBTKA001-C-203HumanColorectumFAP3.30e-04-2.23e-01-0.0481
25998IBTKA002-C-116HumanColorectumFAP4.54e-18-2.21e-01-0.0452
Page: 1 2 3 4 5 6 7 8 

check button Transcriptomic changes along malignancy continuum.
TissueExpression DynamicsAbbreviation
Colorectum (GSE201348)The image shows the transcriptomic changes along malignancy continuum.log2FC in expression of this searched gene in stem-like cells from each diseased tissue sample relative to stem-like cells in normal samples in each tissue plotted against the malignancy continuum. Samples are colored based on if they are from different disease stage.
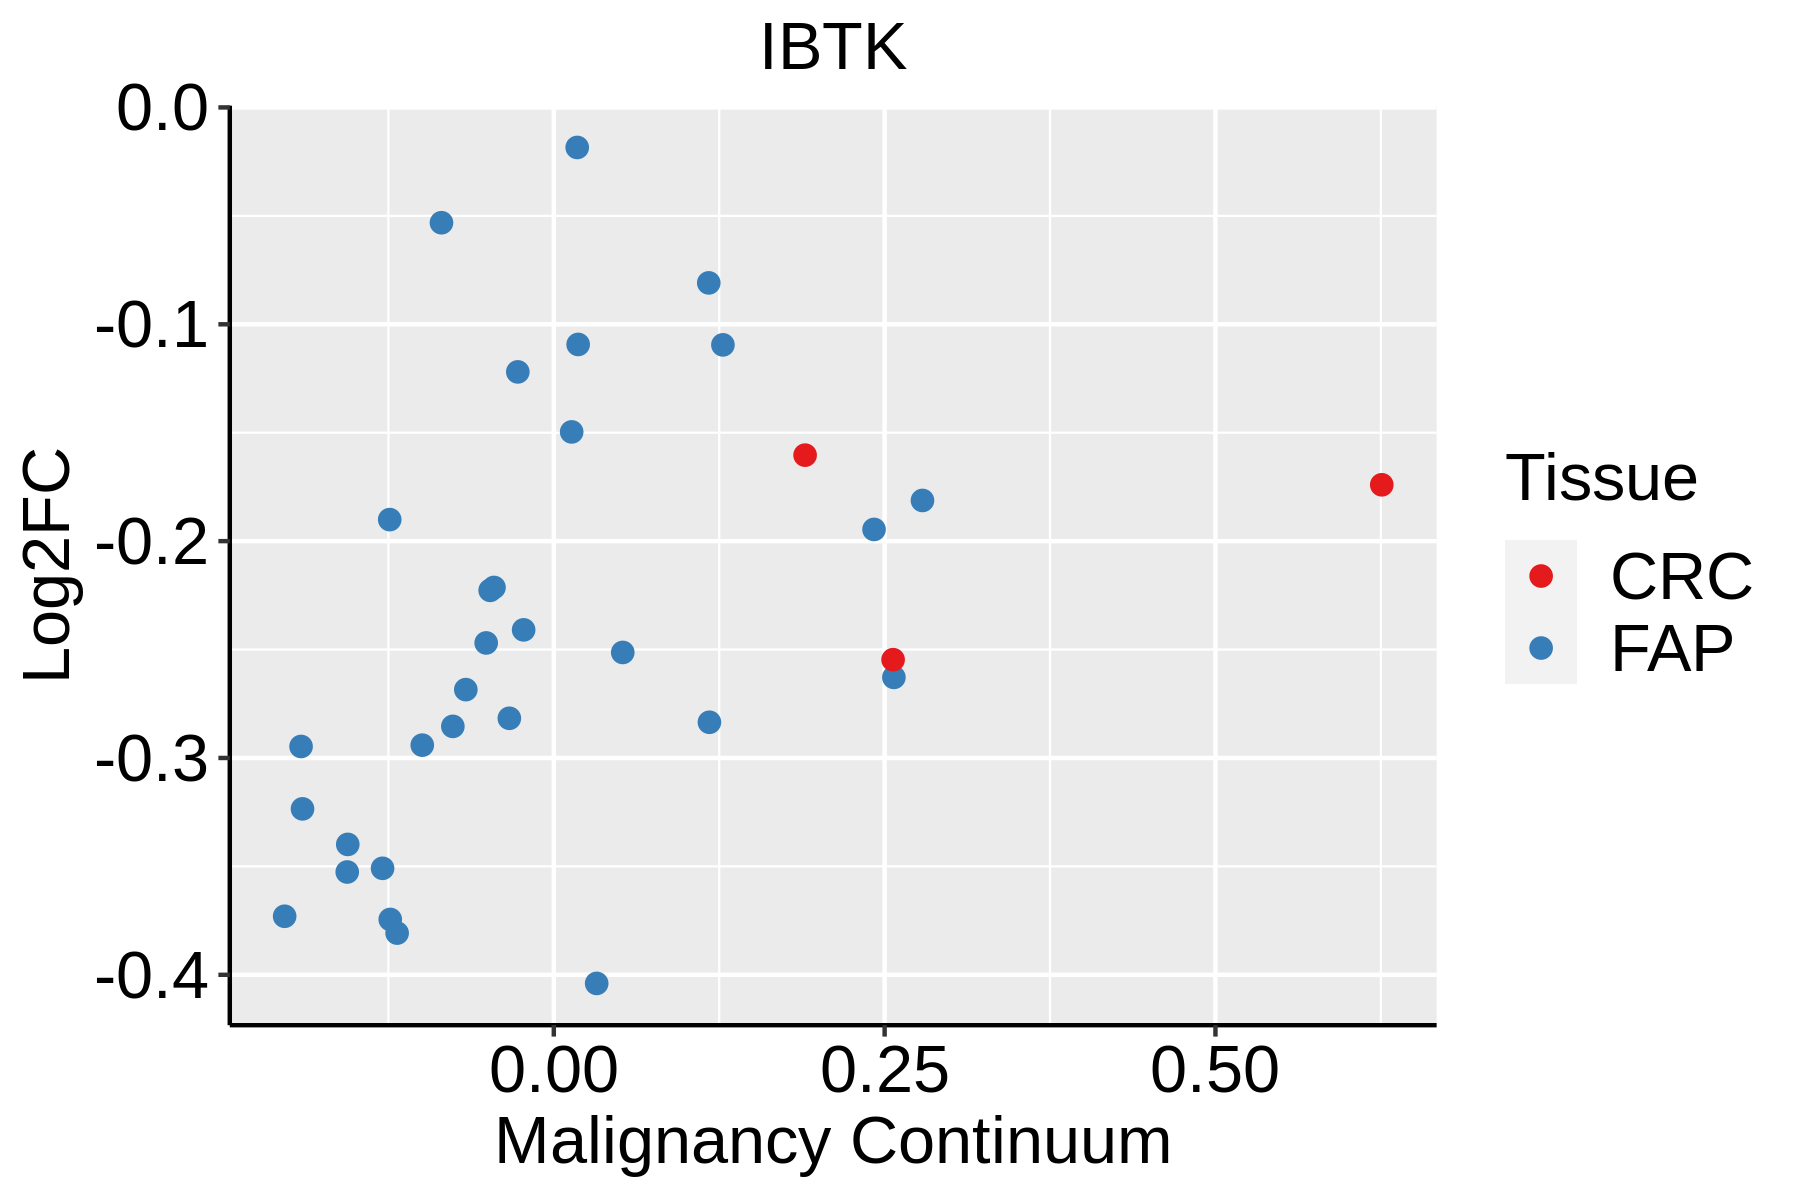
FAP: Familial adenomatous polyposis
CRC: Colorectal cancer
Colorectum (HTA11)The image shows the transcriptomic changes along malignancy continuum.log2FC in expression of this searched gene in stem-like cells from each diseased tissue sample relative to stem-like cells in normal samples in each tissue plotted against the malignancy continuum. Samples are colored based on if they are from different disease stage.AD: Adenomas
SER: Sessile serrated lesions
MSI-H: Microsatellite-high colorectal cancer
MSS: Microsatellite stable colorectal cancer
EsophagusThe image shows the transcriptomic changes along malignancy continuum.log2FC in expression of this searched gene in stem-like cells from each diseased tissue sample relative to stem-like cells in normal samples in each tissue plotted against the malignancy continuum. Samples are colored based on if they are from different disease stage.
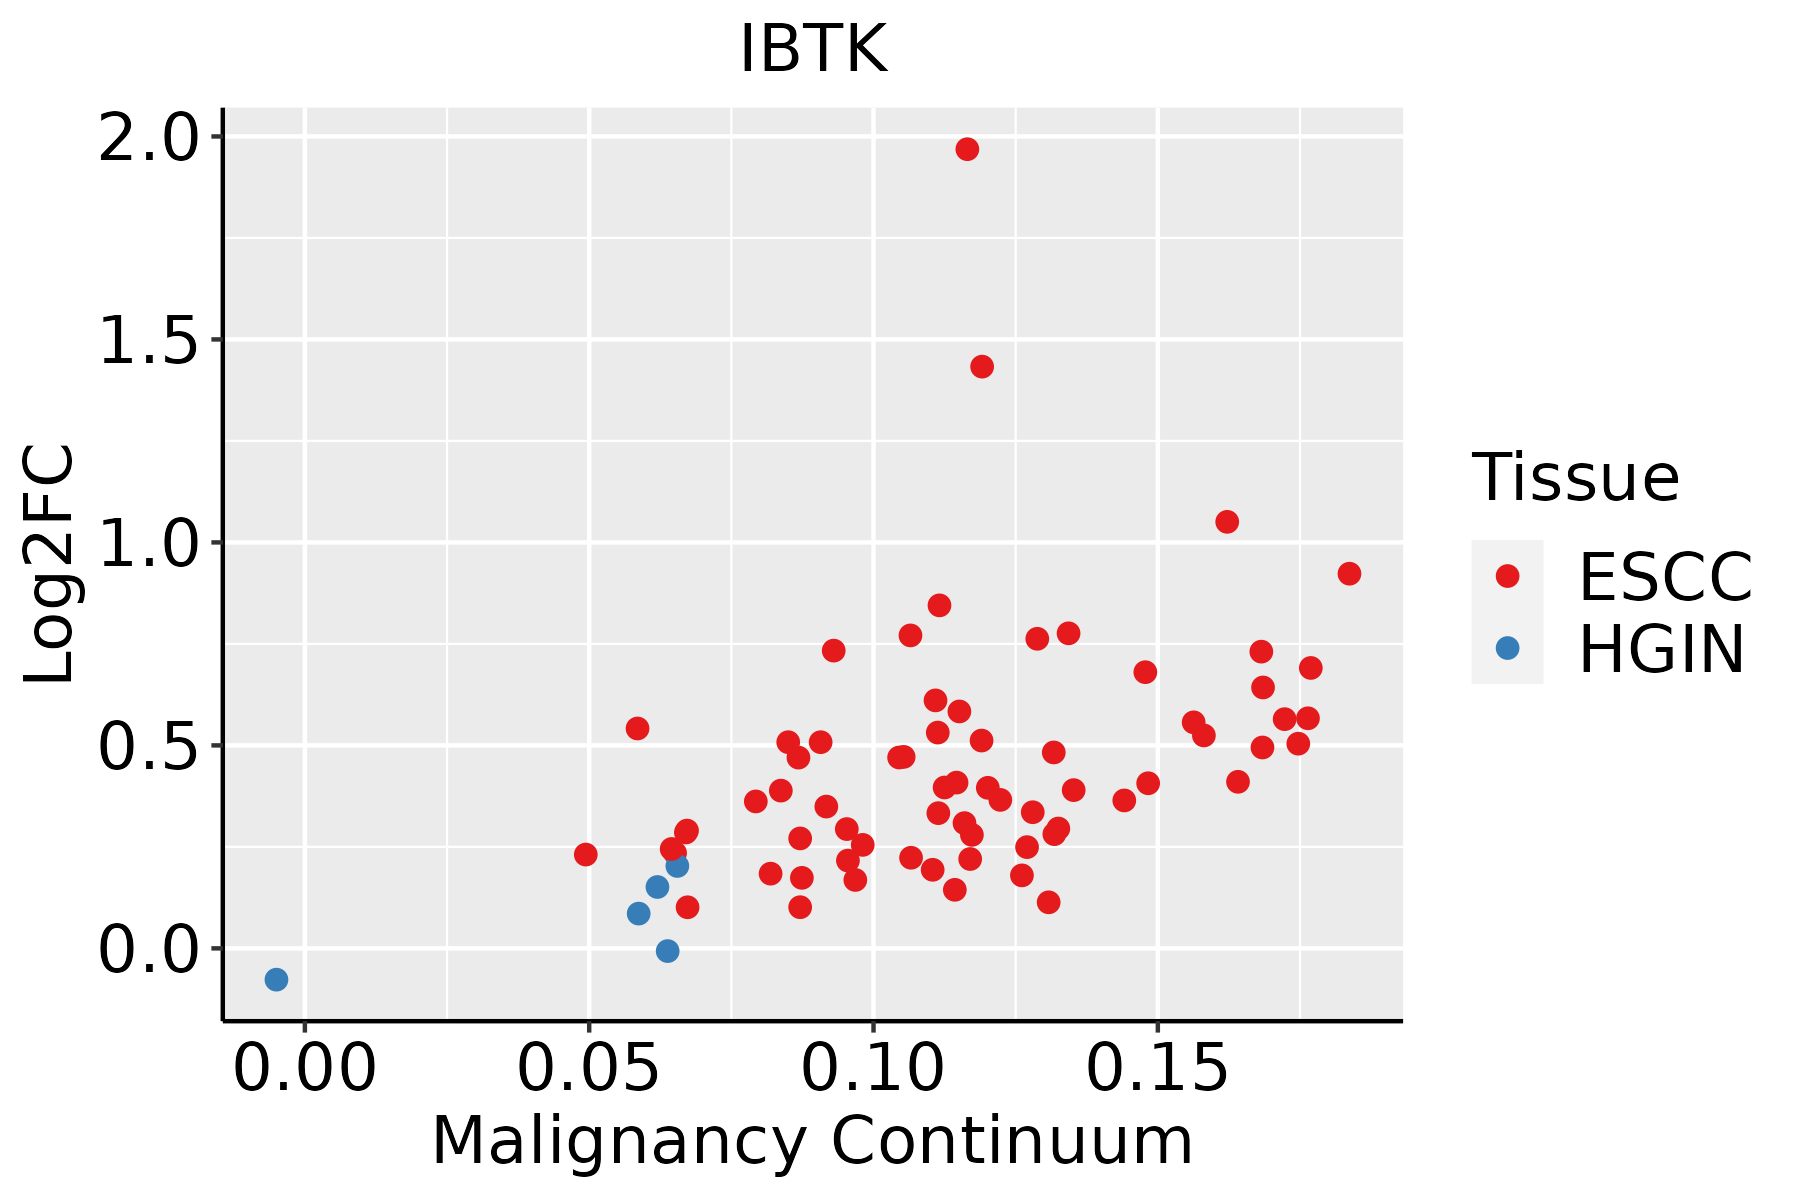
ESCC: Esophageal squamous cell carcinoma
HGIN: High-grade intraepithelial neoplasias
LGIN: Low-grade intraepithelial neoplasias
LiverThe image shows the transcriptomic changes along malignancy continuum.log2FC in expression of this searched gene in stem-like cells from each diseased tissue sample relative to stem-like cells in normal samples in each tissue plotted against the malignancy continuum. Samples are colored based on if they are from different disease stage.
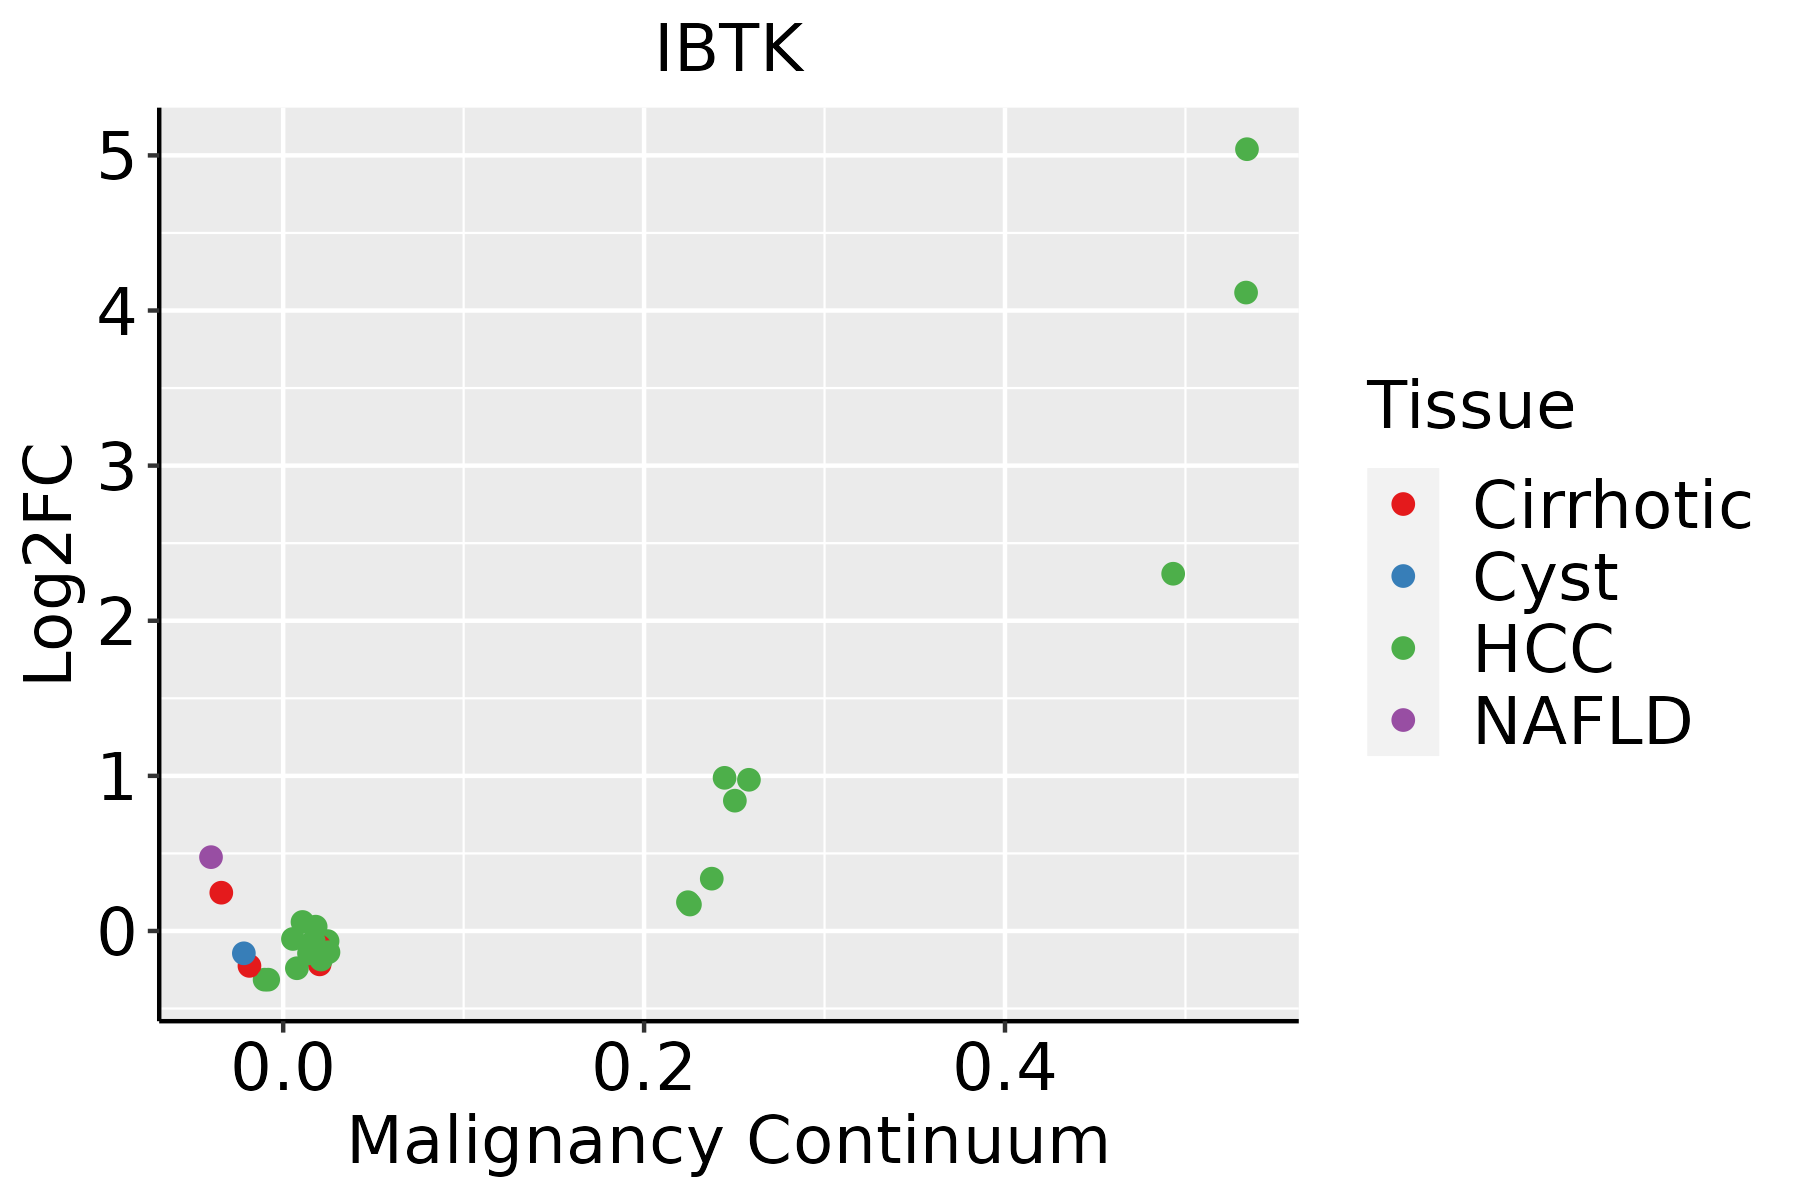
HCC: Hepatocellular carcinoma
NAFLD: Non-alcoholic fatty liver disease
LungThe image shows the transcriptomic changes along malignancy continuum.log2FC in expression of this searched gene in stem-like cells from each diseased tissue sample relative to stem-like cells in normal samples in each tissue plotted against the malignancy continuum. Samples are colored based on if they are from different disease stage.
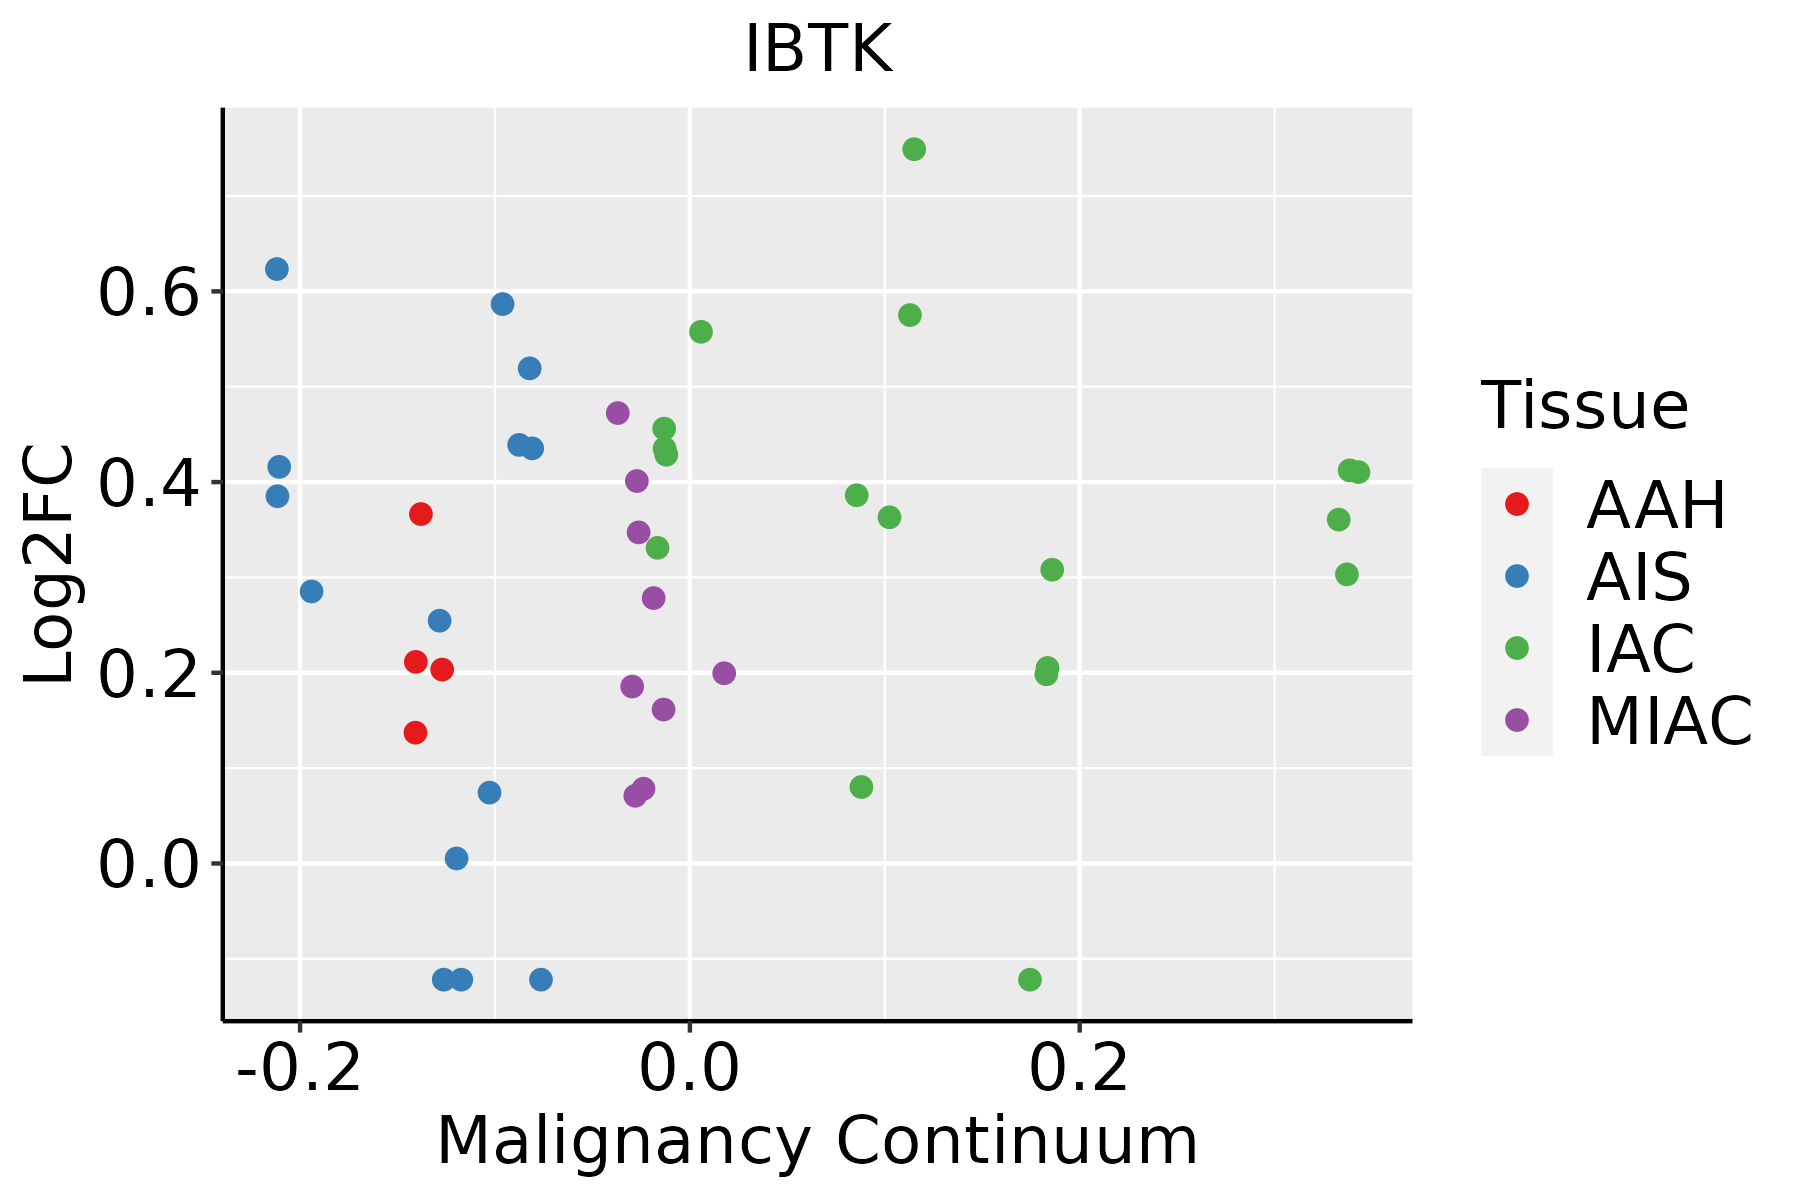
AAH: Atypical adenomatous hyperplasia
AIS: Adenocarcinoma in situ
IAC: Invasive lung adenocarcinoma
MIA: Minimally invasive adenocarcinoma
Oral CavityThe image shows the transcriptomic changes along malignancy continuum.log2FC in expression of this searched gene in stem-like cells from each diseased tissue sample relative to stem-like cells in normal samples in each tissue plotted against the malignancy continuum. Samples are colored based on if they are from different disease stage.EOLP: Erosive Oral lichen planus
LP: leukoplakia
NEOLP: Non-erosive oral lichen planus
OSCC: Oral squamous cell carcinoma
SkinThe image shows the transcriptomic changes along malignancy continuum.log2FC in expression of this searched gene in stem-like cells from each diseased tissue sample relative to stem-like cells in normal samples in each tissue plotted against the malignancy continuum. Samples are colored based on if they are from different disease stage.AK: Actinic keratosis
cSCC: Cutaneous squamous cell carcinoma
SCCIS:squamous cell carcinoma in situ
ThyroidThe image shows the transcriptomic changes along malignancy continuum.log2FC in expression of this searched gene in stem-like cells from each diseased tissue sample relative to stem-like cells in normal samples in each tissue plotted against the malignancy continuum. Samples are colored based on if they are from different disease stage.ATC: Anaplastic thyroid cancer
HT: Hashimoto's thyroiditis
PTC: Papillary thyroid cancer
∗log2FC in expression of this searched gene in stem-like cells from each diseased tissue sample relative to stem-like cells in normal samples in each tissue plotted against the malignancy continuum. Samples are colored based on if they are from different disease stage.

Top

Malignant transformation related pathway analysis

check buttonFind out the enriched GO biological processes and KEGG pathways involved in transition from healthy to precancer to cancer
check button Figure of enriched GO biological processes.
TissueDisease StageEnriched GO biological Processes
ColorectumADGO analysis - Figure of enriched GO biological processes: Top 15 enriched GO BP terms are showed in the bar plot of each disease state in each tissue. Each row represents a significant GO biological process which is colored according to the -log10(p.adjust).
ColorectumSERGO analysis - Figure of enriched GO biological processes: Top 15 enriched GO BP terms are showed in the bar plot of each disease state in each tissue. Each row represents a significant GO biological process which is colored according to the -log10(p.adjust).
ColorectumMSSGO analysis - Figure of enriched GO biological processes: Top 15 enriched GO BP terms are showed in the bar plot of each disease state in each tissue. Each row represents a significant GO biological process which is colored according to the -log10(p.adjust).
ColorectumMSI-HGO analysis - Figure of enriched GO biological processes: Top 15 enriched GO BP terms are showed in the bar plot of each disease state in each tissue. Each row represents a significant GO biological process which is colored according to the -log10(p.adjust).
ColorectumFAPGO analysis - Figure of enriched GO biological processes: Top 15 enriched GO BP terms are showed in the bar plot of each disease state in each tissue. Each row represents a significant GO biological process which is colored according to the -log10(p.adjust).
∗Top 15 enriched GO BP terms are showed in the bar plot of each disease state in each tissue. Each row represents a significant GO biological process which is colored according to the -log10(p.adjust).
Page: 1 2 3 4 5 6 7 8 9 

check button Enriched GO biological processes.
GO IDTissueDisease StageDescriptionGene RatioBg Ratiopvaluep.adjustCount
GO:0001933111EsophagusESCCnegative regulation of protein phosphorylation213/8552342/187233.54e-109.76e-09213
GO:003367319EsophagusESCCnegative regulation of kinase activity154/8552237/187231.38e-093.27e-08154
GO:000646920EsophagusESCCnegative regulation of protein kinase activity140/8552212/187231.53e-093.56e-08140
GO:0051235110EsophagusESCCmaintenance of location200/8552327/187231.01e-082.02e-07200
GO:00507322EsophagusESCCnegative regulation of peptidyl-tyrosine phosphorylation42/855259/187236.35e-054.84e-0442
GO:0051651111EsophagusESCCmaintenance of location in cell126/8552214/187236.57e-055.00e-04126
GO:00610997EsophagusESCCnegative regulation of protein tyrosine kinase activity25/855231/187237.13e-055.38e-0425
GO:00182124EsophagusESCCpeptidyl-tyrosine modification202/8552378/187231.34e-036.39e-03202
GO:00181084EsophagusESCCpeptidyl-tyrosine phosphorylation200/8552375/187231.60e-037.45e-03200
GO:00507303EsophagusESCCregulation of peptidyl-tyrosine phosphorylation144/8552264/187232.22e-039.78e-03144
GO:00610972EsophagusESCCregulation of protein tyrosine kinase activity55/855290/187232.27e-039.99e-0355
GO:00423267LiverNAFLDnegative regulation of phosphorylation67/1882385/187235.49e-061.98e-0467
GO:00459367LiverNAFLDnegative regulation of phosphate metabolic process73/1882441/187231.31e-053.93e-0473
GO:00105637LiverNAFLDnegative regulation of phosphorus metabolic process73/1882442/187231.42e-054.17e-0473
GO:00513487LiverNAFLDnegative regulation of transferase activity49/1882268/187232.61e-057.03e-0449
GO:00336736LiverNAFLDnegative regulation of kinase activity40/1882237/187237.49e-049.50e-0340
GO:00019337LiverNAFLDnegative regulation of protein phosphorylation52/1882342/187231.63e-031.74e-0252
GO:00512356LiverNAFLDmaintenance of location50/1882327/187231.75e-031.82e-0250
GO:004593612LiverCirrhoticnegative regulation of phosphate metabolic process154/4634441/187238.78e-071.83e-05154
GO:001056312LiverCirrhoticnegative regulation of phosphorus metabolic process154/4634442/187231.02e-062.11e-05154
Page: 1 2 3 4 5 6 7 8 9 

check button Enriched KEGG pathways.
Pathway IDTissueDisease StageDescriptionGene RatioBg Ratiopvaluep.adjustqvalueCount
Page: 1 

Top

Cell-cell communication analysis

check buttonIdentification of potential cell-cell interactions between two cell types and their ligand-receptor pairs for different disease states
LigandReceptorLRpairPathwayTissueDisease Stage
Page: 1 

Top

Single-cell gene regulatory network inference analysis

check buttonFind out the significant the regulons (TFs) and the target genes of each regulon across cell types for different disease states
TFCell TypeTissueDisease StageTarget GeneRSSRegulon Activity
∗The dot plots of a searched regulon are shown for all cell subpopulations in each disease state of each tissue based on the regulon specific score inferred using pySCENIC and by calculating the average expression.
Page: 1 

Top

Somatic mutation of malignant transformation related genes

check buttonAnnotation of somatic variants for genes involved in malignant transformation
Hugo SymbolVariant ClassVariant ClassificationdbSNP RSHGVScHGVSpHGVSp ShortSWISSPROTBIOTYPESIFTPolyPhenTumor Sample BarcodeTissueHistologySexAgeStageTherapy TypesDrugsOutcome
IBTKSNVMissense_Mutationnovelc.346G>Tp.Asp116Tyrp.D116YQ9P2D0protein_codingdeleterious(0)probably_damaging(1)TCGA-AN-A046-01Breastbreast invasive carcinomaFemale>=65I/IIUnknownUnknownSD
IBTKSNVMissense_Mutationrs757965458c.865N>Ap.Val289Ilep.V289IQ9P2D0protein_codingtolerated(0.15)possibly_damaging(0.906)TCGA-AN-A0AK-01Breastbreast invasive carcinomaFemale>=65I/IIUnknownUnknownSD
IBTKSNVMissense_Mutationc.3443C>Tp.Ser1148Phep.S1148FQ9P2D0protein_codingdeleterious(0.05)possibly_damaging(0.526)TCGA-BH-A0H5-01Breastbreast invasive carcinomaFemale<65I/IIChemotherapycytoxanCR
IBTKSNVMissense_Mutationc.3134N>Tp.Ser1045Phep.S1045FQ9P2D0protein_codingdeleterious(0)possibly_damaging(0.556)TCGA-C8-A275-01Breastbreast invasive carcinomaFemale<65I/IIUnknownUnknownSD
IBTKSNVMissense_Mutationc.1406N>Cp.Arg469Thrp.R469TQ9P2D0protein_codingtolerated(0.06)benign(0.094)TCGA-E2-A10C-01Breastbreast invasive carcinomaFemale<65I/IIChemotherapycytoxanSD
IBTKSNVMissense_Mutationrs772636120c.2201N>Ap.Ser734Asnp.S734NQ9P2D0protein_codingtolerated(0.14)possibly_damaging(0.448)TCGA-GM-A2DO-01Breastbreast invasive carcinomaFemale<65I/IIHormone TherapytamoxiphenCR
IBTKSNVMissense_Mutationnovelc.604N>Cp.Gly202Argp.G202RQ9P2D0protein_codingdeleterious(0)probably_damaging(1)TCGA-GM-A5PV-01Breastbreast invasive carcinomaFemale<65I/IIChemotherapytaxotereCR
IBTKSNVMissense_Mutationrs376596320c.467G>Ap.Gly156Aspp.G156DQ9P2D0protein_codingdeleterious(0)probably_damaging(1)TCGA-2W-A8YY-01Cervixcervical & endocervical cancerFemale<65I/IIChemotherapycisplatinCR
IBTKSNVMissense_Mutationc.106T>Gp.Phe36Valp.F36VQ9P2D0protein_codingdeleterious(0)probably_damaging(0.999)TCGA-2W-A8YY-01Cervixcervical & endocervical cancerFemale<65I/IIChemotherapycisplatinCR
IBTKSNVMissense_Mutationc.113N>Gp.Ser38Cysp.S38CQ9P2D0protein_codingdeleterious(0.02)probably_damaging(0.949)TCGA-EA-A50E-01Cervixcervical & endocervical cancerFemale<65I/IIUnknownUnknownPD
Page: 1 2 3 4 5 6 7 8 9 10 11 12 13 

Top

Related drugs of malignant transformation related genes

check buttonIdentification of chemicals and drugs interact with genes involved in malignant transfromation
(DGIdb 4.0)
Entrez IDSymbolCategoryInteraction TypesDrug Claim NameDrug NamePMIDs
Page: 1