
|
|||||
|
 | |
| |
| |
| |
| |
| |
|
Gene: HMGCL |
Gene summary for HMGCL |
| Gene information | Species | Human | Gene symbol | HMGCL | Gene ID | 3155 |
| Gene name | 3-hydroxy-3-methylglutaryl-CoA lyase | |
| Gene Alias | HL | |
| Cytomap | 1p36.11 | |
| Gene Type | protein-coding | GO ID | GO:0001889 | UniProtAcc | P35914 |
Top |
Malignant transformation analysis |
| Identification of the aberrant gene expression in precancerous and cancerous lesions by comparing the gene expression of stem-like cells in diseased tissues with normal stem cells |
| Entrez ID | Symbol | Replicates | Species | Organ | Tissue | Adj P-value | Log2FC | Malignancy |
| 3155 | HMGCL | HTA11_3410_2000001011 | Human | Colorectum | AD | 5.05e-10 | 2.49e-01 | 0.0155 |
| 3155 | HMGCL | HTA11_2487_2000001011 | Human | Colorectum | SER | 4.92e-15 | 4.94e-01 | -0.1808 |
| 3155 | HMGCL | HTA11_1938_2000001011 | Human | Colorectum | AD | 9.81e-06 | 3.67e-01 | -0.0811 |
| 3155 | HMGCL | HTA11_78_2000001011 | Human | Colorectum | AD | 1.23e-05 | 3.26e-01 | -0.1088 |
| 3155 | HMGCL | HTA11_347_2000001011 | Human | Colorectum | AD | 1.16e-21 | 5.21e-01 | -0.1954 |
| 3155 | HMGCL | HTA11_411_2000001011 | Human | Colorectum | SER | 1.96e-03 | 6.60e-01 | -0.2602 |
| 3155 | HMGCL | HTA11_2112_2000001011 | Human | Colorectum | SER | 1.29e-04 | 4.94e-01 | -0.2196 |
| 3155 | HMGCL | HTA11_3361_2000001011 | Human | Colorectum | AD | 1.81e-03 | 2.68e-01 | -0.1207 |
| 3155 | HMGCL | HTA11_83_2000001011 | Human | Colorectum | SER | 1.25e-09 | 5.35e-01 | -0.1526 |
| 3155 | HMGCL | HTA11_696_2000001011 | Human | Colorectum | AD | 1.27e-10 | 3.61e-01 | -0.1464 |
| 3155 | HMGCL | HTA11_866_2000001011 | Human | Colorectum | AD | 1.68e-03 | 2.95e-01 | -0.1001 |
| 3155 | HMGCL | HTA11_1391_2000001011 | Human | Colorectum | AD | 1.15e-07 | 3.06e-01 | -0.059 |
| 3155 | HMGCL | HTA11_2992_2000001011 | Human | Colorectum | SER | 1.21e-02 | 4.05e-01 | -0.1706 |
| 3155 | HMGCL | HTA11_5216_2000001011 | Human | Colorectum | SER | 4.21e-05 | 4.21e-01 | -0.1462 |
| 3155 | HMGCL | HTA11_546_2000001011 | Human | Colorectum | AD | 4.89e-06 | 4.50e-01 | -0.0842 |
| 3155 | HMGCL | HTA11_7862_2000001011 | Human | Colorectum | AD | 3.54e-03 | 3.57e-01 | -0.0179 |
| 3155 | HMGCL | HTA11_866_3004761011 | Human | Colorectum | AD | 1.34e-06 | 2.79e-01 | 0.096 |
| 3155 | HMGCL | HTA11_4255_2000001011 | Human | Colorectum | SER | 1.09e-04 | 4.89e-01 | 0.0446 |
| 3155 | HMGCL | HTA11_10623_2000001011 | Human | Colorectum | AD | 7.21e-05 | 4.07e-01 | -0.0177 |
| 3155 | HMGCL | HTA11_10711_2000001011 | Human | Colorectum | AD | 3.68e-04 | 2.80e-01 | 0.0338 |
| Page: 1 2 3 4 5 6 7 |
| Tissue | Expression Dynamics | Abbreviation |
| Colorectum (GSE201348) |  | FAP: Familial adenomatous polyposis |
| CRC: Colorectal cancer | ||
| Colorectum (HTA11) |  | AD: Adenomas |
| SER: Sessile serrated lesions | ||
| MSI-H: Microsatellite-high colorectal cancer | ||
| MSS: Microsatellite stable colorectal cancer | ||
| Esophagus | 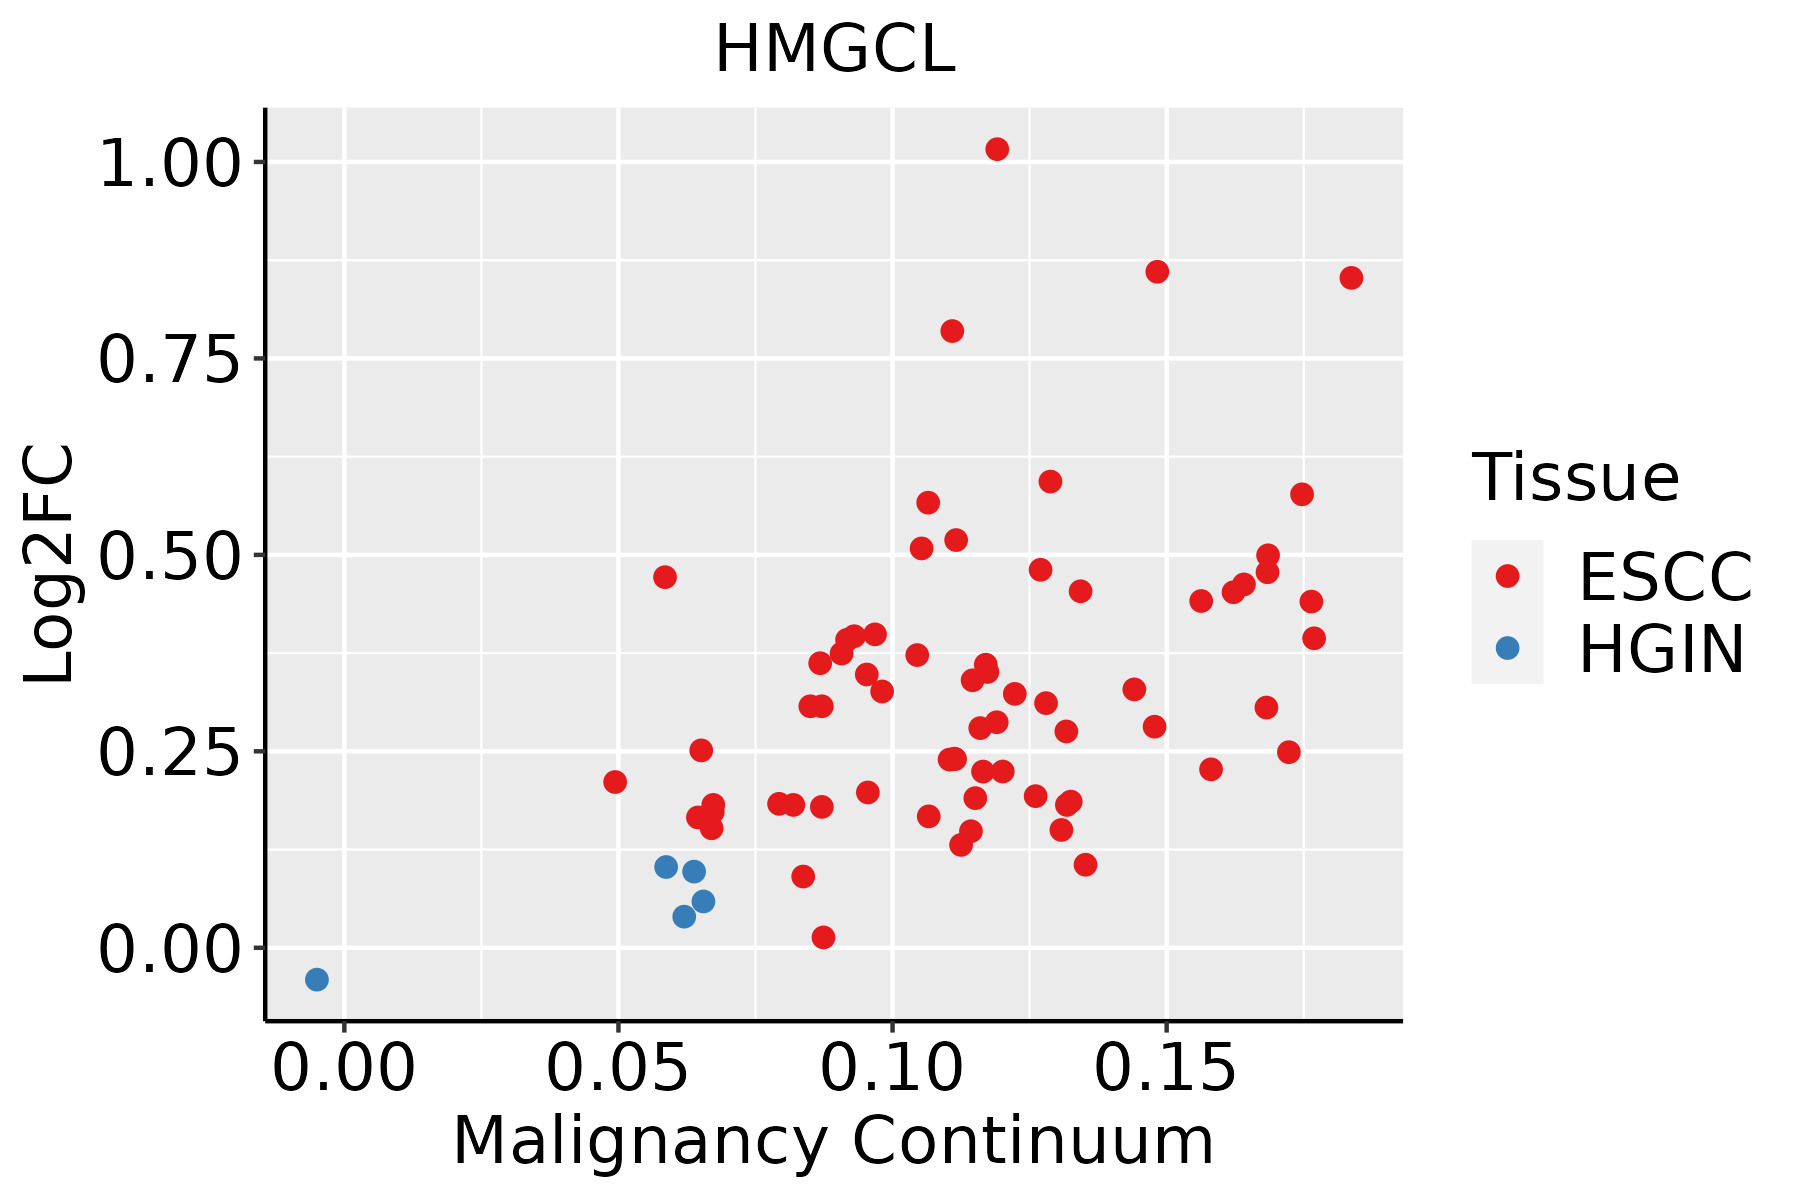 | ESCC: Esophageal squamous cell carcinoma |
| HGIN: High-grade intraepithelial neoplasias | ||
| LGIN: Low-grade intraepithelial neoplasias | ||
| Liver | 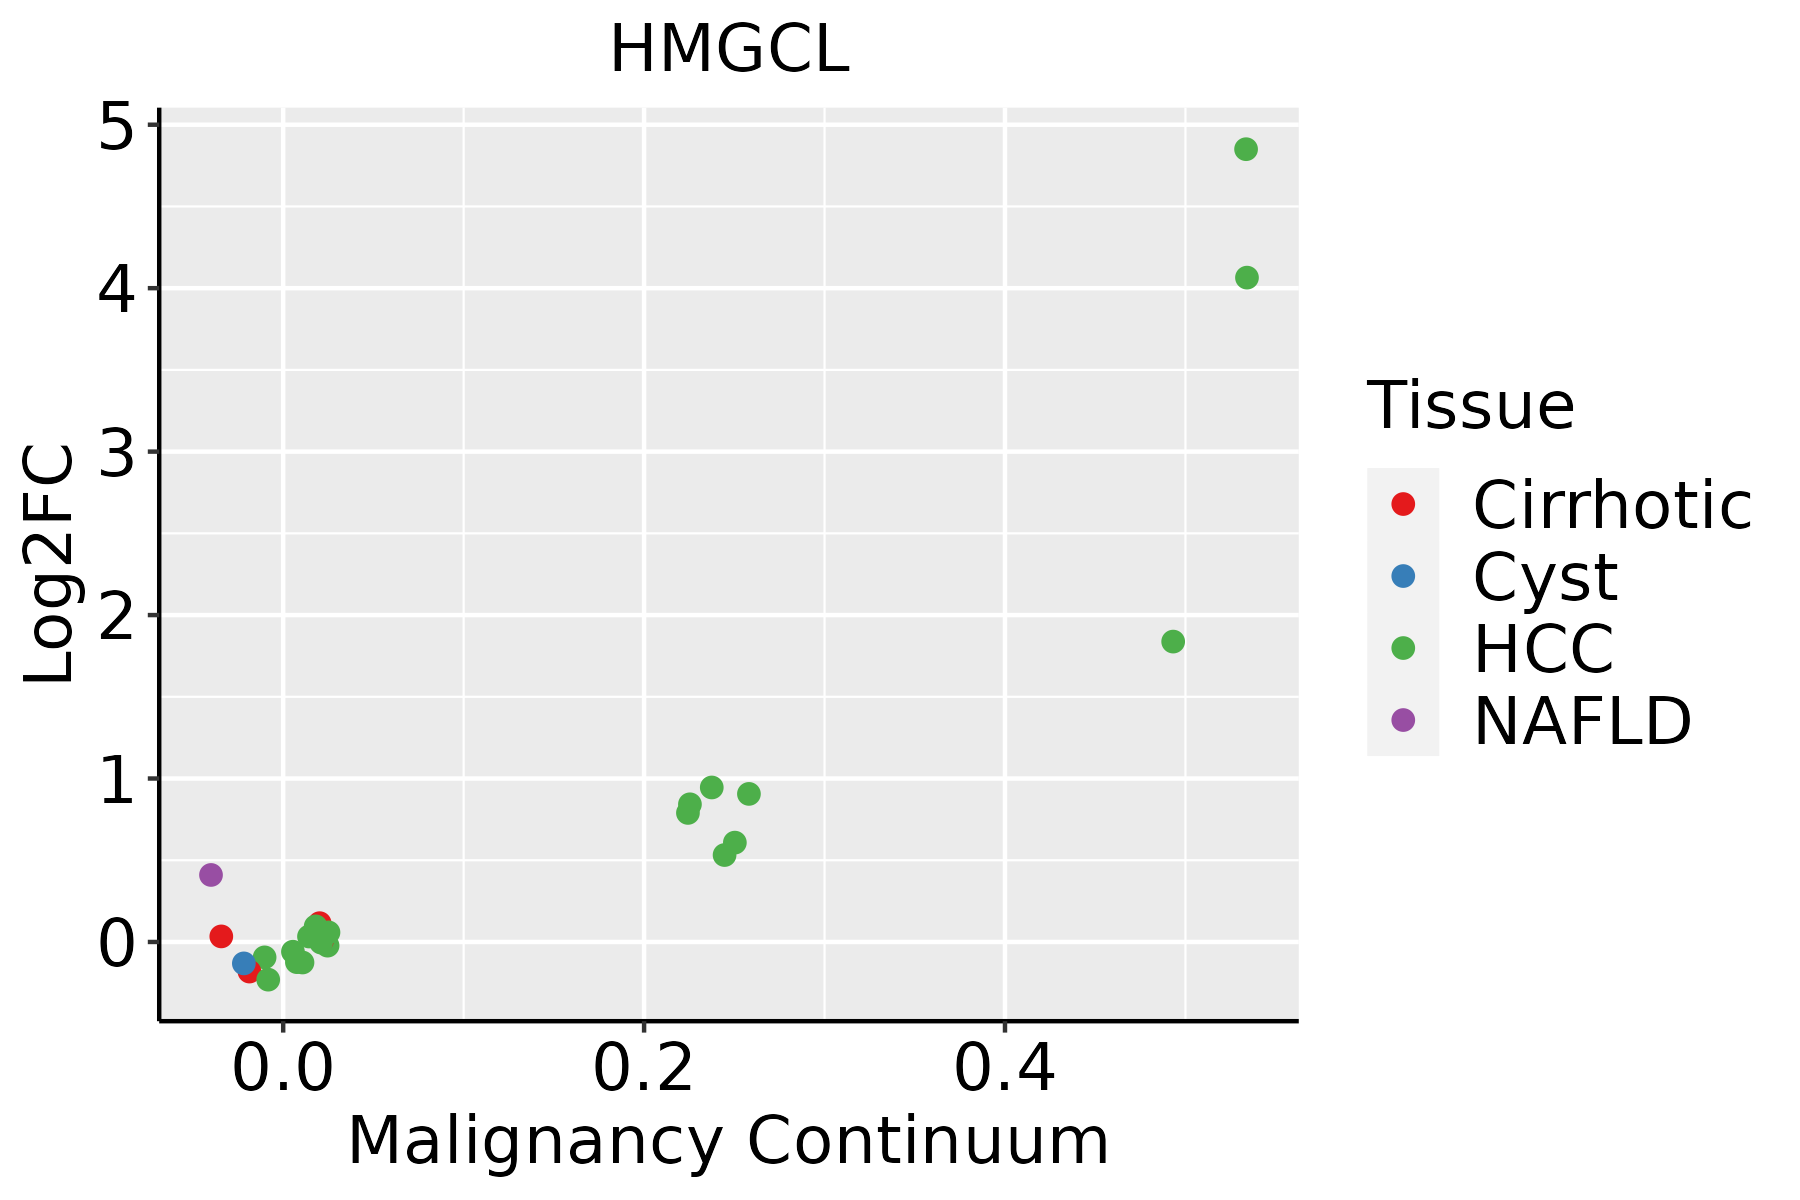 | HCC: Hepatocellular carcinoma |
| NAFLD: Non-alcoholic fatty liver disease | ||
| Oral Cavity | 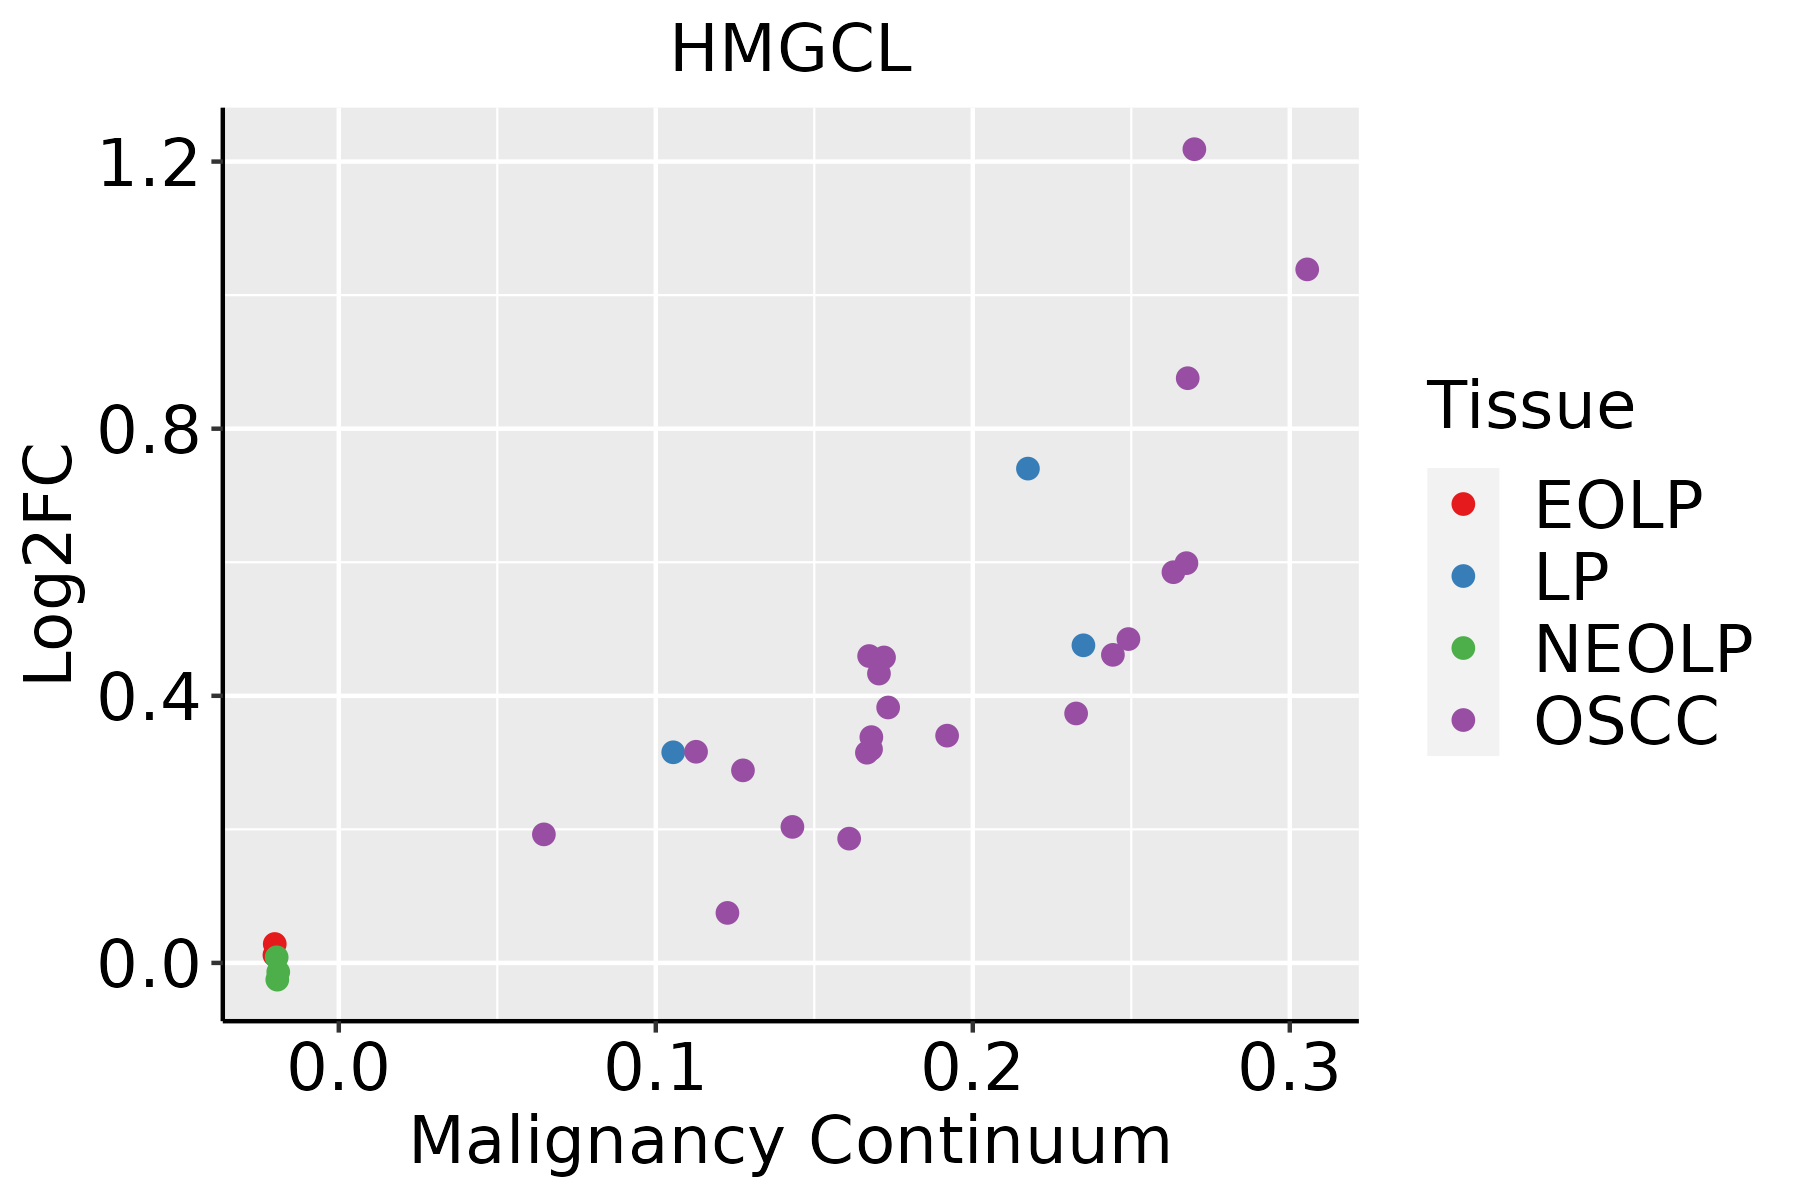 | EOLP: Erosive Oral lichen planus |
| LP: leukoplakia | ||
| NEOLP: Non-erosive oral lichen planus | ||
| OSCC: Oral squamous cell carcinoma | ||
| Thyroid |  | ATC: Anaplastic thyroid cancer |
| HT: Hashimoto's thyroiditis | ||
| PTC: Papillary thyroid cancer |
| ∗log2FC in expression of this searched gene in stem-like cells from each diseased tissue sample relative to stem-like cells in normal samples in each tissue plotted against the malignancy continuum. Samples are colored based on if they are from different disease stage. |
Top |
Malignant transformation related pathway analysis |
| Find out the enriched GO biological processes and KEGG pathways involved in transition from healthy to precancer to cancer |
| Tissue | Disease Stage | Enriched GO biological Processes |
| Colorectum | AD |  |
| Colorectum | SER |  |
| Colorectum | MSS |  |
| Colorectum | MSI-H |  |
| Colorectum | FAP |  |
| ∗Top 15 enriched GO BP terms are showed in the bar plot of each disease state in each tissue. Each row represents a significant GO biological process which is colored according to the -log10(p.adjust). |
| Page: 1 2 3 4 5 6 7 8 9 |
| GO ID | Tissue | Disease Stage | Description | Gene Ratio | Bg Ratio | pvalue | p.adjust | Count |
| GO:00061632 | Colorectum | MSS | purine nucleotide metabolic process | 128/3467 | 396/18723 | 2.04e-11 | 3.02e-09 | 128 |
| GO:00091502 | Colorectum | MSS | purine ribonucleotide metabolic process | 121/3467 | 368/18723 | 2.08e-11 | 3.02e-09 | 121 |
| GO:00725212 | Colorectum | MSS | purine-containing compound metabolic process | 132/3467 | 416/18723 | 4.13e-11 | 4.86e-09 | 132 |
| GO:00092592 | Colorectum | MSS | ribonucleotide metabolic process | 123/3467 | 385/18723 | 1.17e-10 | 1.20e-08 | 123 |
| GO:00196932 | Colorectum | MSS | ribose phosphate metabolic process | 124/3467 | 396/18723 | 4.11e-10 | 3.49e-08 | 124 |
| GO:00091172 | Colorectum | MSS | nucleotide metabolic process | 144/3467 | 489/18723 | 1.87e-09 | 1.35e-07 | 144 |
| GO:00067532 | Colorectum | MSS | nucleoside phosphate metabolic process | 145/3467 | 497/18723 | 3.25e-09 | 2.23e-07 | 145 |
| GO:00610082 | Colorectum | MSS | hepaticobiliary system development | 51/3467 | 150/18723 | 4.33e-06 | 1.23e-04 | 51 |
| GO:00018892 | Colorectum | MSS | liver development | 50/3467 | 147/18723 | 5.28e-06 | 1.44e-04 | 50 |
| GO:00316672 | Colorectum | MSS | response to nutrient levels | 125/3467 | 474/18723 | 1.24e-05 | 2.88e-04 | 125 |
| GO:00425942 | Colorectum | MSS | response to starvation | 56/3467 | 197/18723 | 4.25e-04 | 5.21e-03 | 56 |
| GO:00442822 | Colorectum | MSS | small molecule catabolic process | 94/3467 | 376/18723 | 9.85e-04 | 9.86e-03 | 94 |
| GO:00067902 | Colorectum | MSS | sulfur compound metabolic process | 85/3467 | 339/18723 | 1.52e-03 | 1.39e-02 | 85 |
| GO:0070542 | Colorectum | MSS | response to fatty acid | 21/3467 | 64/18723 | 4.39e-03 | 3.11e-02 | 21 |
| GO:00160542 | Colorectum | MSS | organic acid catabolic process | 61/3467 | 240/18723 | 4.72e-03 | 3.31e-02 | 61 |
| GO:0006091110 | Esophagus | ESCC | generation of precursor metabolites and energy | 331/8552 | 490/18723 | 3.86e-23 | 8.45e-21 | 331 |
| GO:0048732111 | Esophagus | ESCC | gland development | 269/8552 | 436/18723 | 7.81e-12 | 2.95e-10 | 269 |
| GO:0031667111 | Esophagus | ESCC | response to nutrient levels | 289/8552 | 474/18723 | 9.25e-12 | 3.47e-10 | 289 |
| GO:004259419 | Esophagus | ESCC | response to starvation | 133/8552 | 197/18723 | 4.31e-10 | 1.14e-08 | 133 |
| GO:0006753110 | Esophagus | ESCC | nucleoside phosphate metabolic process | 288/8552 | 497/18723 | 1.80e-08 | 3.50e-07 | 288 |
| Page: 1 2 3 4 5 6 7 8 9 10 11 12 |
| Pathway ID | Tissue | Disease Stage | Description | Gene Ratio | Bg Ratio | pvalue | p.adjust | qvalue | Count |
| hsa00280 | Colorectum | AD | Valine, leucine and isoleucine degradation | 25/2092 | 48/8465 | 3.97e-05 | 3.41e-04 | 2.18e-04 | 25 |
| hsa002801 | Colorectum | AD | Valine, leucine and isoleucine degradation | 25/2092 | 48/8465 | 3.97e-05 | 3.41e-04 | 2.18e-04 | 25 |
| hsa002802 | Colorectum | MSS | Valine, leucine and isoleucine degradation | 21/1875 | 48/8465 | 6.73e-04 | 4.51e-03 | 2.76e-03 | 21 |
| hsa002803 | Colorectum | MSS | Valine, leucine and isoleucine degradation | 21/1875 | 48/8465 | 6.73e-04 | 4.51e-03 | 2.76e-03 | 21 |
| hsa041467 | Esophagus | ESCC | Peroxisome | 55/4205 | 82/8465 | 1.04e-03 | 3.27e-03 | 1.68e-03 | 55 |
| hsa002809 | Esophagus | ESCC | Valine, leucine and isoleucine degradation | 34/4205 | 48/8465 | 2.34e-03 | 6.54e-03 | 3.35e-03 | 34 |
| hsa0414612 | Esophagus | ESCC | Peroxisome | 55/4205 | 82/8465 | 1.04e-03 | 3.27e-03 | 1.68e-03 | 55 |
| hsa0028014 | Esophagus | ESCC | Valine, leucine and isoleucine degradation | 34/4205 | 48/8465 | 2.34e-03 | 6.54e-03 | 3.35e-03 | 34 |
| hsa002806 | Liver | NAFLD | Valine, leucine and isoleucine degradation | 20/1043 | 48/8465 | 3.03e-07 | 1.65e-05 | 1.33e-05 | 20 |
| hsa00650 | Liver | NAFLD | Butanoate metabolism | 11/1043 | 27/8465 | 1.88e-04 | 3.62e-03 | 2.92e-03 | 11 |
| hsa04146 | Liver | NAFLD | Peroxisome | 19/1043 | 82/8465 | 4.37e-03 | 4.10e-02 | 3.30e-02 | 19 |
| hsa0028011 | Liver | NAFLD | Valine, leucine and isoleucine degradation | 20/1043 | 48/8465 | 3.03e-07 | 1.65e-05 | 1.33e-05 | 20 |
| hsa006501 | Liver | NAFLD | Butanoate metabolism | 11/1043 | 27/8465 | 1.88e-04 | 3.62e-03 | 2.92e-03 | 11 |
| hsa041461 | Liver | NAFLD | Peroxisome | 19/1043 | 82/8465 | 4.37e-03 | 4.10e-02 | 3.30e-02 | 19 |
| hsa0028021 | Liver | Cirrhotic | Valine, leucine and isoleucine degradation | 32/2530 | 48/8465 | 1.45e-07 | 2.02e-06 | 1.24e-06 | 32 |
| hsa006502 | Liver | Cirrhotic | Butanoate metabolism | 15/2530 | 27/8465 | 4.71e-03 | 1.74e-02 | 1.07e-02 | 15 |
| hsa041462 | Liver | Cirrhotic | Peroxisome | 36/2530 | 82/8465 | 4.79e-03 | 1.74e-02 | 1.07e-02 | 36 |
| hsa0028031 | Liver | Cirrhotic | Valine, leucine and isoleucine degradation | 32/2530 | 48/8465 | 1.45e-07 | 2.02e-06 | 1.24e-06 | 32 |
| hsa006503 | Liver | Cirrhotic | Butanoate metabolism | 15/2530 | 27/8465 | 4.71e-03 | 1.74e-02 | 1.07e-02 | 15 |
| hsa041463 | Liver | Cirrhotic | Peroxisome | 36/2530 | 82/8465 | 4.79e-03 | 1.74e-02 | 1.07e-02 | 36 |
| Page: 1 2 |
Top |
Cell-cell communication analysis |
| Identification of potential cell-cell interactions between two cell types and their ligand-receptor pairs for different disease states |
| Ligand | Receptor | LRpair | Pathway | Tissue | Disease Stage |
| Page: 1 |
Top |
Single-cell gene regulatory network inference analysis |
| Find out the significant the regulons (TFs) and the target genes of each regulon across cell types for different disease states |
| TF | Cell Type | Tissue | Disease Stage | Target Gene | RSS | Regulon Activity |
| ∗The dot plots of a searched regulon are shown for all cell subpopulations in each disease state of each tissue based on the regulon specific score inferred using pySCENIC and by calculating the average expression. |
| Page: 1 |
Top |
Somatic mutation of malignant transformation related genes |
| Annotation of somatic variants for genes involved in malignant transformation |
| Hugo Symbol | Variant Class | Variant Classification | dbSNP RS | HGVSc | HGVSp | HGVSp Short | SWISSPROT | BIOTYPE | SIFT | PolyPhen | Tumor Sample Barcode | Tissue | Histology | Sex | Age | Stage | Therapy Types | Drugs | Outcome |
| HMGCL | SNV | Missense_Mutation | rs121964997 | c.122N>A | p.Arg41Gln | p.R41Q | P35914 | protein_coding | deleterious(0) | probably_damaging(0.989) | TCGA-AG-3896-01 | Colorectum | rectum adenocarcinoma | Female | >=65 | I/II | Unknown | Unknown | SD |
| HMGCL | SNV | Missense_Mutation | c.656C>A | p.Ser219Tyr | p.S219Y | P35914 | protein_coding | deleterious(0) | benign(0.364) | TCGA-F5-6814-01 | Colorectum | rectum adenocarcinoma | Male | <65 | I/II | Unknown | Unknown | SD | |
| HMGCL | SNV | Missense_Mutation | c.866N>A | p.Gly289Asp | p.G289D | P35914 | protein_coding | deleterious(0.01) | probably_damaging(0.983) | TCGA-AP-A1DV-01 | Endometrium | uterine corpus endometrioid carcinoma | Female | <65 | I/II | Unknown | Unknown | SD | |
| HMGCL | SNV | Missense_Mutation | rs368145582 | c.347C>T | p.Ala116Val | p.A116V | P35914 | protein_coding | deleterious(0.01) | possibly_damaging(0.749) | TCGA-AX-A1CE-01 | Endometrium | uterine corpus endometrioid carcinoma | Female | <65 | I/II | Unspecific | Paclitaxel | SD |
| HMGCL | SNV | Missense_Mutation | novel | c.742G>A | p.Ala248Thr | p.A248T | P35914 | protein_coding | deleterious(0.01) | probably_damaging(0.969) | TCGA-AX-A2HC-01 | Endometrium | uterine corpus endometrioid carcinoma | Female | <65 | III/IV | Chemotherapy | paclitaxel | PD |
| HMGCL | SNV | Missense_Mutation | rs761552111 | c.806N>T | p.Ala269Val | p.A269V | P35914 | protein_coding | deleterious(0) | probably_damaging(0.976) | TCGA-BG-A0MQ-01 | Endometrium | uterine corpus endometrioid carcinoma | Female | >=65 | I/II | Unknown | Unknown | SD |
| HMGCL | SNV | Missense_Mutation | c.434A>G | p.Glu145Gly | p.E145G | P35914 | protein_coding | deleterious(0) | benign(0.228) | TCGA-DF-A2KN-01 | Endometrium | uterine corpus endometrioid carcinoma | Female | Unknown | I/II | Unknown | Unknown | SD | |
| HMGCL | SNV | Missense_Mutation | novel | c.367N>A | p.Glu123Lys | p.E123K | P35914 | protein_coding | deleterious(0) | probably_damaging(0.999) | TCGA-EO-A22R-01 | Endometrium | uterine corpus endometrioid carcinoma | Female | <65 | I/II | Unknown | Unknown | SD |
| HMGCL | SNV | Missense_Mutation | c.334G>T | p.Gly112Cys | p.G112C | P35914 | protein_coding | deleterious(0) | probably_damaging(0.999) | TCGA-37-5819-01 | Lung | lung squamous cell carcinoma | Male | <65 | III/IV | Unknown | Unknown | SD | |
| HMGCL | SNV | Missense_Mutation | c.750N>T | p.Gln250His | p.Q250H | P35914 | protein_coding | deleterious(0) | probably_damaging(0.992) | TCGA-60-2714-01 | Lung | lung squamous cell carcinoma | Female | >=65 | I/II | Chemotherapy | taxol | SD |
| Page: 1 2 |
Top |
Related drugs of malignant transformation related genes |
| Identification of chemicals and drugs interact with genes involved in malignant transfromation |
| (DGIdb 4.0) |
| Entrez ID | Symbol | Category | Interaction Types | Drug Claim Name | Drug Name | PMIDs |
| Page: 1 |

Copyright 2023-Present -The University of Texas Health Science Center at Houston |