
|
|||||
|
 | |
| |
| |
| |
| |
| |
|
Gene: HMGA2 |
Gene summary for HMGA2 |
| Gene information | Species | Human | Gene symbol | HMGA2 | Gene ID | 8091 |
| Gene name | high mobility group AT-hook 2 | |
| Gene Alias | BABL | |
| Cytomap | 12q14.3 | |
| Gene Type | protein-coding | GO ID | GO:0000075 | UniProtAcc | F5H2A4 |
Top |
Malignant transformation analysis |
| Identification of the aberrant gene expression in precancerous and cancerous lesions by comparing the gene expression of stem-like cells in diseased tissues with normal stem cells |
| Entrez ID | Symbol | Replicates | Species | Organ | Tissue | Adj P-value | Log2FC | Malignancy |
| 8091 | HMGA2 | HTA11_3410_2000001011 | Human | Colorectum | AD | 6.78e-14 | -5.69e-01 | 0.0155 |
| 8091 | HMGA2 | HTA11_2487_2000001011 | Human | Colorectum | SER | 3.70e-03 | -4.12e-01 | -0.1808 |
| 8091 | HMGA2 | HTA11_696_2000001011 | Human | Colorectum | AD | 3.29e-08 | -4.23e-01 | -0.1464 |
| 8091 | HMGA2 | HTA11_866_2000001011 | Human | Colorectum | AD | 9.57e-03 | -2.99e-01 | -0.1001 |
| 8091 | HMGA2 | HTA11_866_3004761011 | Human | Colorectum | AD | 1.36e-15 | -6.43e-01 | 0.096 |
| 8091 | HMGA2 | HTA11_8622_2000001021 | Human | Colorectum | SER | 1.62e-04 | -6.97e-01 | 0.0528 |
| 8091 | HMGA2 | HTA11_10711_2000001011 | Human | Colorectum | AD | 6.02e-03 | -4.46e-01 | 0.0338 |
| 8091 | HMGA2 | HTA11_7696_3000711011 | Human | Colorectum | AD | 2.17e-11 | -5.36e-01 | 0.0674 |
| 8091 | HMGA2 | HTA11_99999971662_82457 | Human | Colorectum | MSS | 1.44e-05 | -4.01e-01 | 0.3859 |
| 8091 | HMGA2 | HTA11_99999973899_84307 | Human | Colorectum | MSS | 1.00e-06 | -6.66e-01 | 0.2585 |
| 8091 | HMGA2 | HTA11_99999974143_84620 | Human | Colorectum | MSS | 1.74e-33 | -7.56e-01 | 0.3005 |
| 8091 | HMGA2 | F007 | Human | Colorectum | FAP | 1.89e-08 | -4.77e-01 | 0.1176 |
| 8091 | HMGA2 | A002-C-010 | Human | Colorectum | FAP | 1.22e-12 | -4.83e-01 | 0.242 |
| 8091 | HMGA2 | A001-C-207 | Human | Colorectum | FAP | 1.05e-05 | -2.96e-01 | 0.1278 |
| 8091 | HMGA2 | A015-C-203 | Human | Colorectum | FAP | 2.47e-29 | -6.63e-01 | -0.1294 |
| 8091 | HMGA2 | A015-C-204 | Human | Colorectum | FAP | 4.14e-10 | -4.44e-01 | -0.0228 |
| 8091 | HMGA2 | A014-C-040 | Human | Colorectum | FAP | 1.69e-07 | -5.90e-01 | -0.1184 |
| 8091 | HMGA2 | A002-C-201 | Human | Colorectum | FAP | 1.97e-24 | -5.89e-01 | 0.0324 |
| 8091 | HMGA2 | A001-C-119 | Human | Colorectum | FAP | 7.39e-21 | -7.33e-01 | -0.1557 |
| 8091 | HMGA2 | A001-C-108 | Human | Colorectum | FAP | 5.46e-18 | -5.67e-01 | -0.0272 |
| Page: 1 2 3 4 5 6 |
| Tissue | Expression Dynamics | Abbreviation |
| Colorectum (GSE201348) |  | FAP: Familial adenomatous polyposis |
| CRC: Colorectal cancer | ||
| Colorectum (HTA11) |  | AD: Adenomas |
| SER: Sessile serrated lesions | ||
| MSI-H: Microsatellite-high colorectal cancer | ||
| MSS: Microsatellite stable colorectal cancer | ||
| Esophagus | 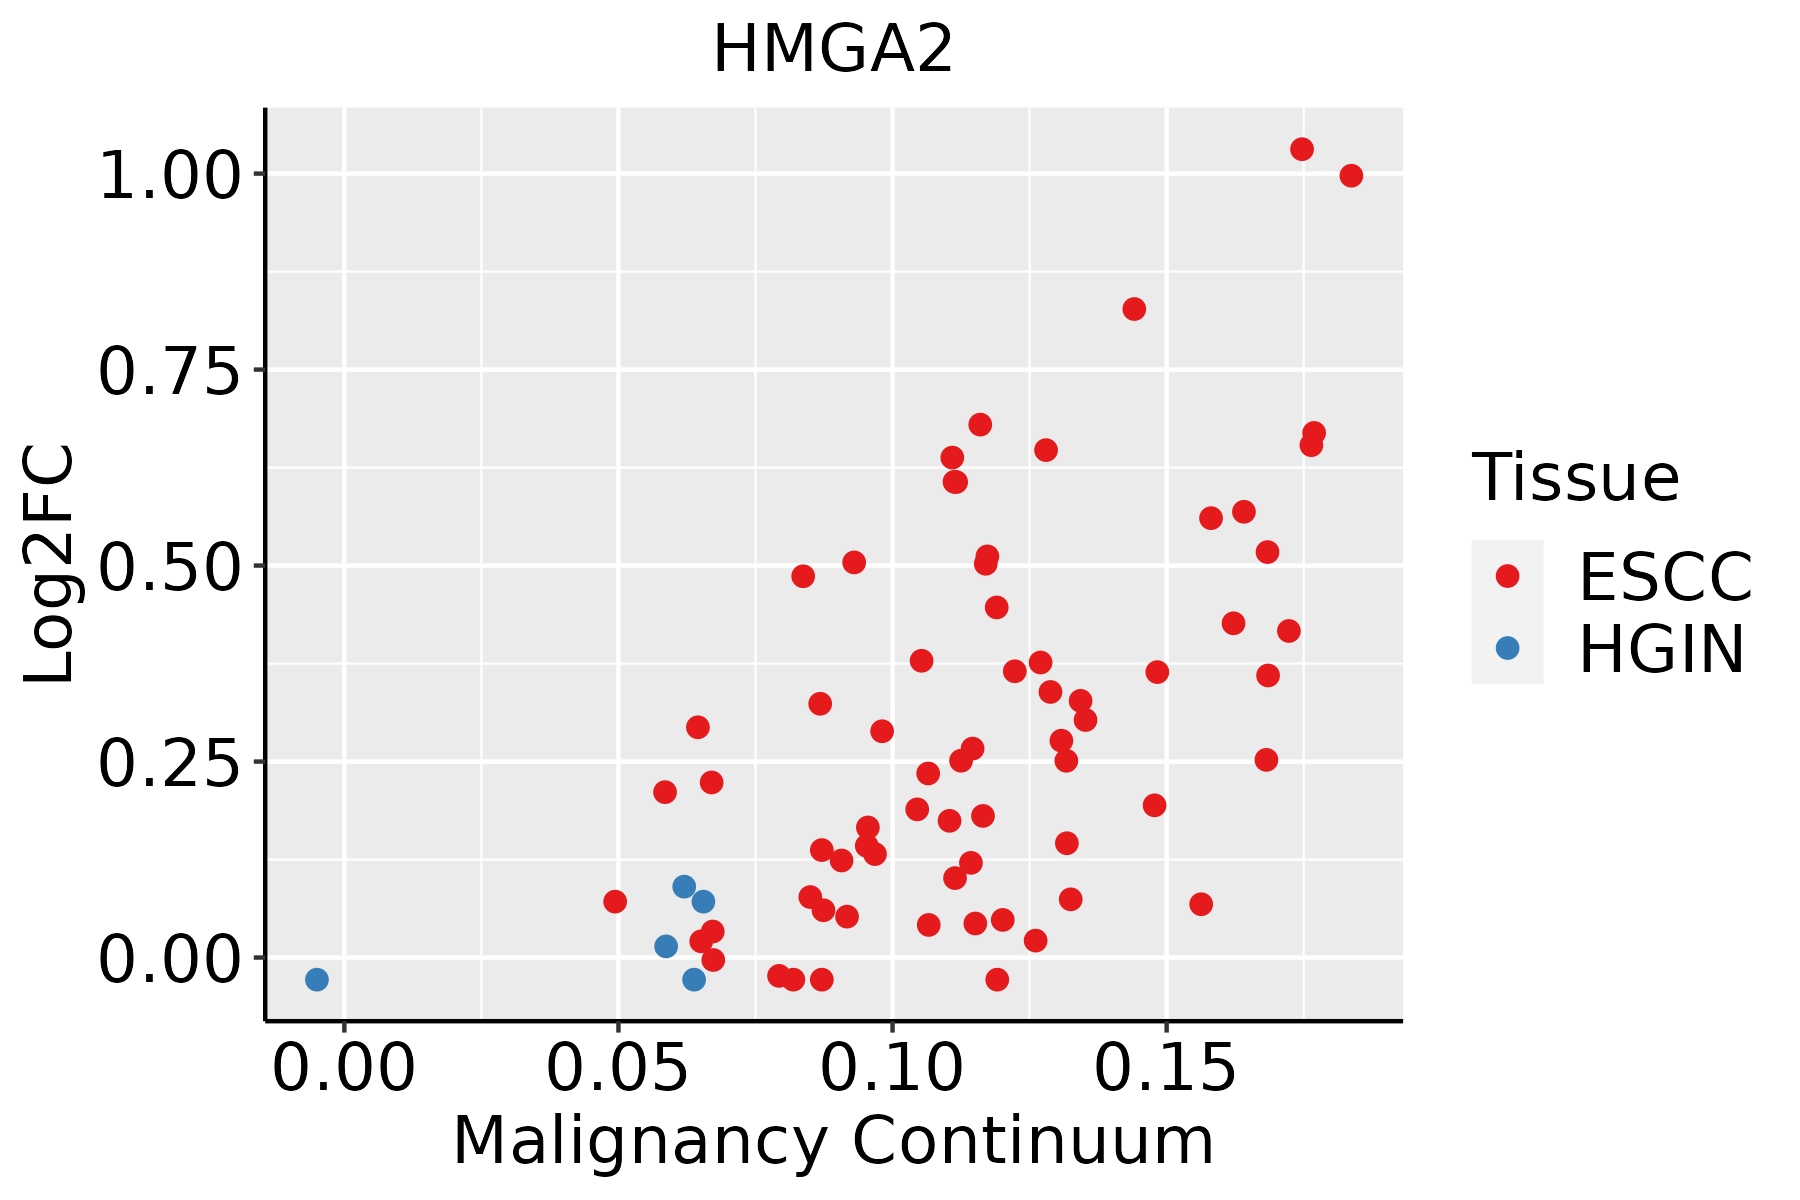 | ESCC: Esophageal squamous cell carcinoma |
| HGIN: High-grade intraepithelial neoplasias | ||
| LGIN: Low-grade intraepithelial neoplasias | ||
| Lung |  | AAH: Atypical adenomatous hyperplasia |
| AIS: Adenocarcinoma in situ | ||
| IAC: Invasive lung adenocarcinoma | ||
| MIA: Minimally invasive adenocarcinoma | ||
| Oral Cavity |  | EOLP: Erosive Oral lichen planus |
| LP: leukoplakia | ||
| NEOLP: Non-erosive oral lichen planus | ||
| OSCC: Oral squamous cell carcinoma | ||
| Thyroid | 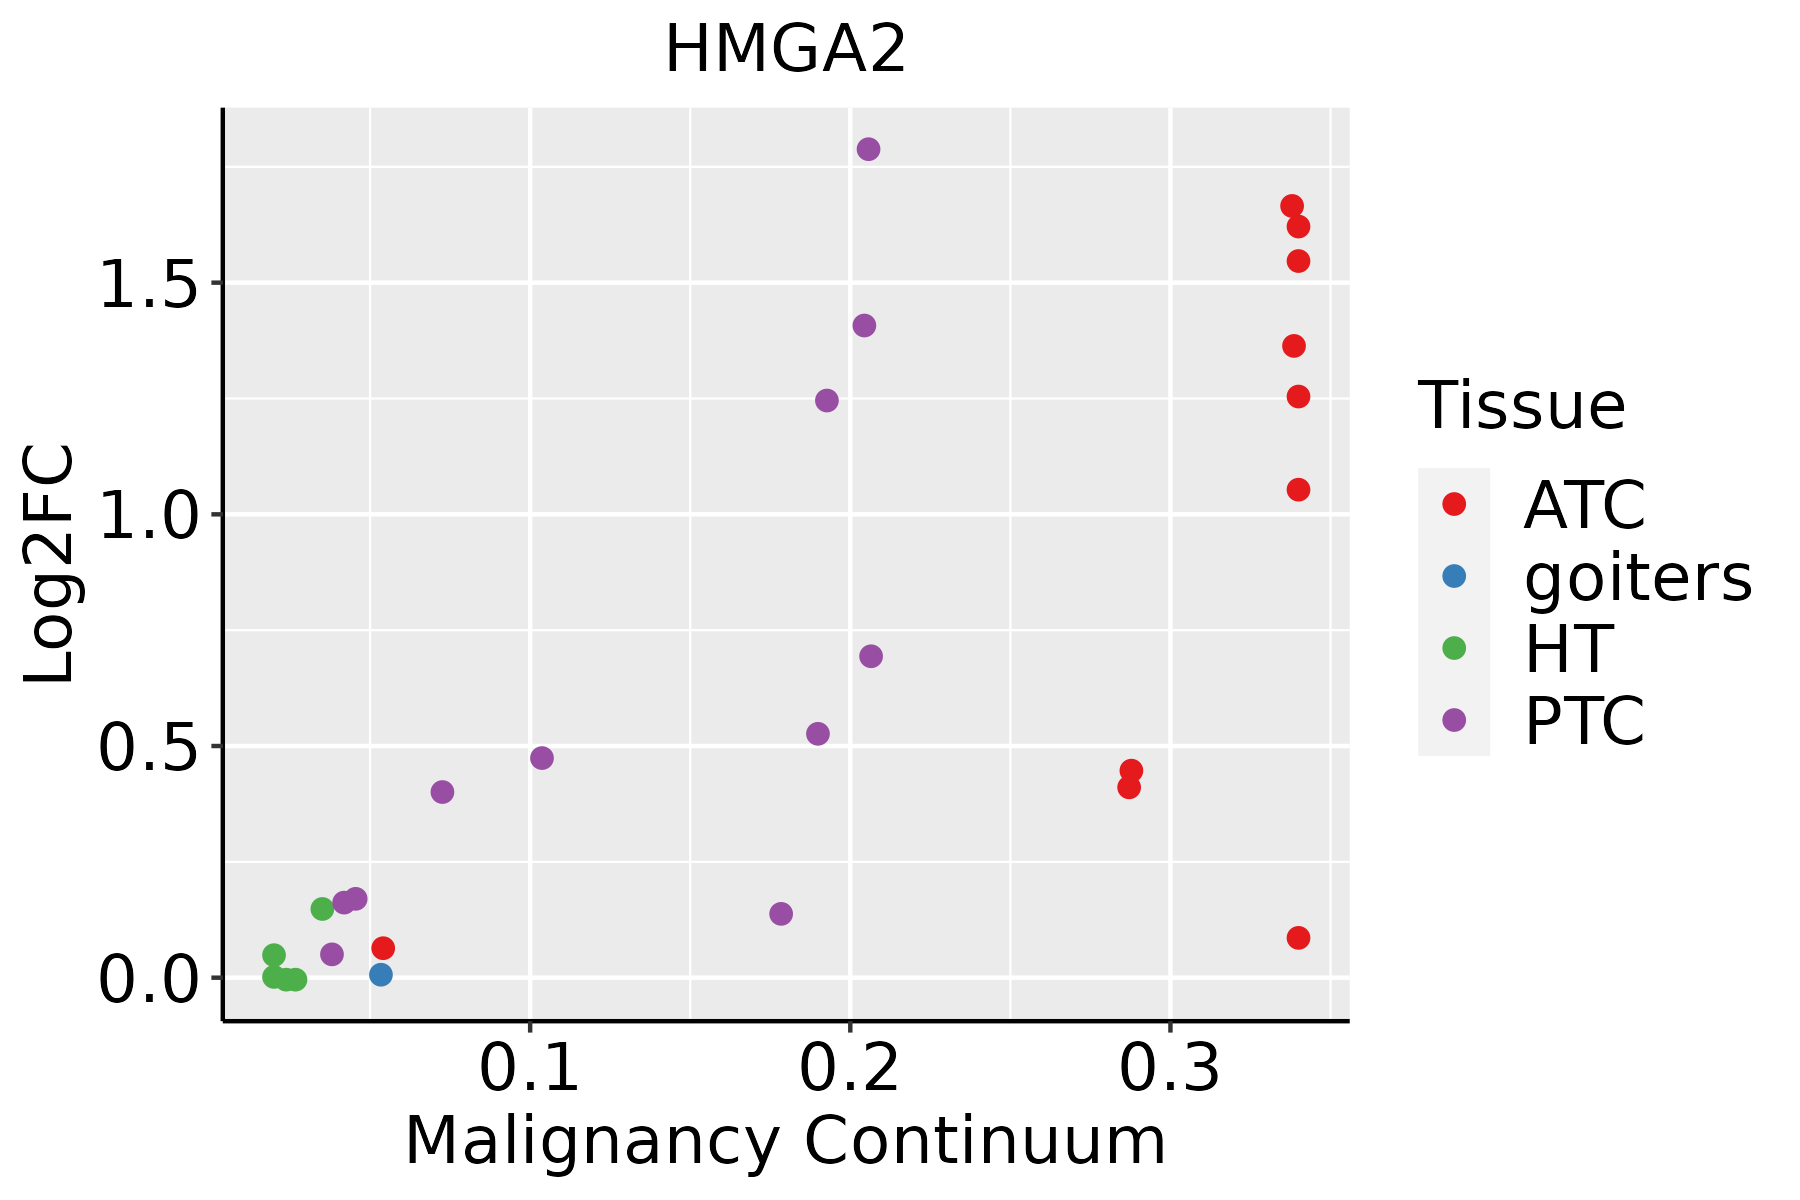 | ATC: Anaplastic thyroid cancer |
| HT: Hashimoto's thyroiditis | ||
| PTC: Papillary thyroid cancer |
| ∗log2FC in expression of this searched gene in stem-like cells from each diseased tissue sample relative to stem-like cells in normal samples in each tissue plotted against the malignancy continuum. Samples are colored based on if they are from different disease stage. |
Top |
Malignant transformation related pathway analysis |
| Find out the enriched GO biological processes and KEGG pathways involved in transition from healthy to precancer to cancer |
| Tissue | Disease Stage | Enriched GO biological Processes |
| Colorectum | AD |  |
| Colorectum | SER |  |
| Colorectum | MSS |  |
| Colorectum | MSI-H |  |
| Colorectum | FAP |  |
| ∗Top 15 enriched GO BP terms are showed in the bar plot of each disease state in each tissue. Each row represents a significant GO biological process which is colored according to the -log10(p.adjust). |
| Page: 1 2 3 4 5 6 7 8 9 |
| GO ID | Tissue | Disease Stage | Description | Gene Ratio | Bg Ratio | pvalue | p.adjust | Count |
| GO:00713831 | Colorectum | SER | cellular response to steroid hormone stimulus | 55/2897 | 204/18723 | 1.66e-05 | 5.05e-04 | 55 |
| GO:00444031 | Colorectum | SER | biological process involved in symbiotic interaction | 72/2897 | 290/18723 | 2.08e-05 | 6.02e-04 | 72 |
| GO:00485451 | Colorectum | SER | response to steroid hormone | 80/2897 | 339/18723 | 5.15e-05 | 1.25e-03 | 80 |
| GO:00510521 | Colorectum | SER | regulation of DNA metabolic process | 83/2897 | 359/18723 | 8.03e-05 | 1.77e-03 | 83 |
| GO:00190801 | Colorectum | SER | viral gene expression | 29/2897 | 94/18723 | 1.32e-04 | 2.66e-03 | 29 |
| GO:00190791 | Colorectum | SER | viral genome replication | 37/2897 | 131/18723 | 1.36e-04 | 2.72e-03 | 37 |
| GO:00434011 | Colorectum | SER | steroid hormone mediated signaling pathway | 38/2897 | 136/18723 | 1.42e-04 | 2.82e-03 | 38 |
| GO:00097551 | Colorectum | SER | hormone-mediated signaling pathway | 49/2897 | 190/18723 | 1.54e-04 | 3.00e-03 | 49 |
| GO:00305221 | Colorectum | SER | intracellular receptor signaling pathway | 63/2897 | 265/18723 | 2.47e-04 | 4.20e-03 | 63 |
| GO:00507921 | Colorectum | SER | regulation of viral process | 43/2897 | 164/18723 | 2.57e-04 | 4.31e-03 | 43 |
| GO:00511011 | Colorectum | SER | regulation of DNA binding | 33/2897 | 118/18723 | 3.70e-04 | 5.71e-03 | 33 |
| GO:00063251 | Colorectum | SER | chromatin organization | 89/2897 | 409/18723 | 4.15e-04 | 6.17e-03 | 89 |
| GO:19039001 | Colorectum | SER | regulation of viral life cycle | 38/2897 | 148/18723 | 8.76e-04 | 1.06e-02 | 38 |
| GO:00305181 | Colorectum | SER | intracellular steroid hormone receptor signaling pathway | 31/2897 | 116/18723 | 1.25e-03 | 1.41e-02 | 31 |
| GO:00511001 | Colorectum | SER | negative regulation of binding | 40/2897 | 162/18723 | 1.46e-03 | 1.59e-02 | 40 |
| GO:00336741 | Colorectum | SER | positive regulation of kinase activity | 95/2897 | 467/18723 | 2.62e-03 | 2.41e-02 | 95 |
| GO:00714811 | Colorectum | SER | cellular response to X-ray | 7/2897 | 14/18723 | 2.64e-03 | 2.41e-02 | 7 |
| GO:00331441 | Colorectum | SER | negative regulation of intracellular steroid hormone receptor signaling pathway | 13/2897 | 38/18723 | 3.40e-03 | 2.90e-02 | 13 |
| GO:00073691 | Colorectum | SER | gastrulation | 43/2897 | 185/18723 | 3.44e-03 | 2.92e-02 | 43 |
| GO:0045444 | Colorectum | SER | fat cell differentiation | 51/2897 | 229/18723 | 3.96e-03 | 3.26e-02 | 51 |
| Page: 1 2 3 4 5 6 7 8 9 10 11 12 13 14 15 16 17 18 19 20 21 22 23 24 25 26 27 28 29 30 31 32 33 34 35 36 37 |
| Pathway ID | Tissue | Disease Stage | Description | Gene Ratio | Bg Ratio | pvalue | p.adjust | qvalue | Count |
| hsa05202 | Colorectum | FAP | Transcriptional misregulation in cancer | 45/1404 | 193/8465 | 9.19e-03 | 3.33e-02 | 2.03e-02 | 45 |
| hsa052021 | Colorectum | FAP | Transcriptional misregulation in cancer | 45/1404 | 193/8465 | 9.19e-03 | 3.33e-02 | 2.03e-02 | 45 |
| hsa052028 | Esophagus | ESCC | Transcriptional misregulation in cancer | 116/4205 | 193/8465 | 2.08e-03 | 5.95e-03 | 3.05e-03 | 116 |
| hsa0520213 | Esophagus | ESCC | Transcriptional misregulation in cancer | 116/4205 | 193/8465 | 2.08e-03 | 5.95e-03 | 3.05e-03 | 116 |
| hsa052026 | Lung | IAC | Transcriptional misregulation in cancer | 40/1053 | 193/8465 | 6.90e-04 | 5.90e-03 | 3.92e-03 | 40 |
| hsa0520211 | Lung | IAC | Transcriptional misregulation in cancer | 40/1053 | 193/8465 | 6.90e-04 | 5.90e-03 | 3.92e-03 | 40 |
| hsa052022 | Lung | AIS | Transcriptional misregulation in cancer | 39/961 | 193/8465 | 2.15e-04 | 2.41e-03 | 1.54e-03 | 39 |
| hsa052023 | Lung | AIS | Transcriptional misregulation in cancer | 39/961 | 193/8465 | 2.15e-04 | 2.41e-03 | 1.54e-03 | 39 |
| Page: 1 |
Top |
Cell-cell communication analysis |
| Identification of potential cell-cell interactions between two cell types and their ligand-receptor pairs for different disease states |
| Ligand | Receptor | LRpair | Pathway | Tissue | Disease Stage |
| Page: 1 |
Top |
Single-cell gene regulatory network inference analysis |
| Find out the significant the regulons (TFs) and the target genes of each regulon across cell types for different disease states |
| TF | Cell Type | Tissue | Disease Stage | Target Gene | RSS | Regulon Activity |
| HMGA2 | ICAF | Breast | Healthy | PAPPA,TAF4B,TIAM2, etc. | 2.19e-01 |  |
| HMGA2 | CAF | Breast | IDC | PAPPA,TAF4B,TIAM2, etc. | 4.14e-02 |  |
| HMGA2 | CAF | Breast | Precancer | PAPPA,TAF4B,TIAM2, etc. | 2.23e-01 |  |
| HMGA2 | DC | Cervix | CC | BCAS2,IGF2BP2,PAM, etc. | 1.30e-01 |  |
| HMGA2 | PLA | Cervix | CC | BCAS2,IGF2BP2,PAM, etc. | 2.51e-01 | |
| HMGA2 | MAIT | Cervix | CC | BCAS2,IGF2BP2,PAM, etc. | 7.90e-02 | |
| HMGA2 | BMEM | Cervix | CC | BCAS2,IGF2BP2,PAM, etc. | 6.93e-02 | |
| HMGA2 | GC | Cervix | CC | BCAS2,IGF2BP2,PAM, etc. | 1.10e-01 | |
| HMGA2 | ABS | Colorectum | Healthy | AC098850.3,NXPE1,MAP2K6, etc. | 3.63e-01 |  |
| HMGA2 | ASC | Colorectum | Healthy | AC098850.3,NXPE1,MAP2K6, etc. | 1.14e-01 | |
| ∗The dot plots of a searched regulon are shown for all cell subpopulations in each disease state of each tissue based on the regulon specific score inferred using pySCENIC and by calculating the average expression. |
| Page: 1 2 |
Top |
Somatic mutation of malignant transformation related genes |
| Annotation of somatic variants for genes involved in malignant transformation |
| Hugo Symbol | Variant Class | Variant Classification | dbSNP RS | HGVSc | HGVSp | HGVSp Short | SWISSPROT | BIOTYPE | SIFT | PolyPhen | Tumor Sample Barcode | Tissue | Histology | Sex | Age | Stage | Therapy Types | Drugs | Outcome |
| HMGA2 | SNV | Missense_Mutation | novel | c.421N>C | p.Ser141Pro | p.S141P | protein_coding | deleterious_low_confidence(0.01) | benign(0.346) | TCGA-A2-A04R-01 | Breast | breast invasive carcinoma | Female | <65 | I/II | Chemotherapy | taxol | SD | |
| HMGA2 | SNV | Missense_Mutation | novel | c.319N>A | p.Glu107Lys | p.E107K | P52926 | protein_coding | deleterious(0.01) | possibly_damaging(0.905) | TCGA-AN-A046-01 | Breast | breast invasive carcinoma | Female | >=65 | I/II | Unknown | Unknown | SD |
| HMGA2 | SNV | Missense_Mutation | novel | c.310N>A | p.Glu104Lys | p.E104K | P52926 | protein_coding | tolerated(0.27) | possibly_damaging(0.899) | TCGA-Q1-A5R2-01 | Cervix | cervical & endocervical cancer | Female | <65 | I/II | Chemotherapy | cisplatin | PR |
| HMGA2 | deletion | Frame_Shift_Del | c.*4delG | P52926 | protein_coding | TCGA-AZ-4313-01 | Colorectum | colon adenocarcinoma | Female | <65 | I/II | Unknown | Unknown | SD | |||||
| HMGA2 | SNV | Missense_Mutation | c.140G>A | p.Arg47Lys | p.R47K | protein_coding | tolerated_low_confidence(0.08) | probably_damaging(0.937) | TCGA-A5-A0G2-01 | Endometrium | uterine corpus endometrioid carcinoma | Female | <65 | III/IV | Unknown | Unknown | SD | ||
| HMGA2 | SNV | Missense_Mutation | novel | c.230G>A | p.Arg77Lys | p.R77K | protein_coding | tolerated(0.09) | probably_damaging(0.937) | TCGA-A5-A0G2-01 | Endometrium | uterine corpus endometrioid carcinoma | Female | <65 | III/IV | Unknown | Unknown | SD | |
| HMGA2 | SNV | Missense_Mutation | novel | c.397G>A | p.Val133Ile | p.V133I | protein_coding | tolerated_low_confidence(0.13) | benign(0.279) | TCGA-AX-A06F-01 | Endometrium | uterine corpus endometrioid carcinoma | Female | <65 | III/IV | Chemotherapy | carboplatin | SD | |
| HMGA2 | SNV | Missense_Mutation | novel | c.146G>T | p.Arg49Met | p.R49M | protein_coding | deleterious_low_confidence(0) | probably_damaging(0.992) | TCGA-44-6145-01 | Lung | lung adenocarcinoma | Female | <65 | I/II | Unknown | Unknown | SD | |
| HMGA2 | SNV | Missense_Mutation | c.199N>G | p.Lys67Glu | p.K67E | protein_coding | tolerated(0.09) | probably_damaging(0.979) | TCGA-69-7764-01 | Lung | lung adenocarcinoma | Male | >=65 | I/II | Unknown | Unknown | SD | ||
| HMGA2 | SNV | Missense_Mutation | novel | c.410N>T | p.Trp137Leu | p.W137L | protein_coding | deleterious_low_confidence(0.01) | benign(0.155) | TCGA-78-7158-01 | Lung | lung adenocarcinoma | Female | <65 | III/IV | Chemotherapy | carboplatin | PD |
| Page: 1 2 |
Top |
Related drugs of malignant transformation related genes |
| Identification of chemicals and drugs interact with genes involved in malignant transfromation |
| (DGIdb 4.0) |
| Entrez ID | Symbol | Category | Interaction Types | Drug Claim Name | Drug Name | PMIDs |
| Page: 1 |

Copyright 2023-Present -The University of Texas Health Science Center at Houston |